1
WHAT IT MEANS TO PUT
ANALYTICS TO WORK
IF WE WANT TO MAKE better decisions and take the right actions, we have to use analytics. Putting analytics to work is about improving performance in key business domains using data and analysis. For too long, managers have relied on their intuition or their “golden gut” to make decisions. For too long, important calls have been based not on data, but on the experience and unaided judgment of the decision maker. Our research suggests that 40 percent of major decisions are based not on facts, but on the manager’s gut. 1
Sometimes intuitive and experience-based decisions work out well, but often they either go astray or end in disaster: executives pursue mergers and acquisitions to palliate their egos, neglecting the sober considerations that create real value; banks make credit and risk decisions based on unexamined assumptions about always-rising asset values; governments rely on sparse intelligence before deciding whether to wage war. Such are the most extreme cases of ill-informed decision making.
In other cases, nonanalytical decisions don’t lead to tragedy, but they do leave money on the table: businesses price products and services based on their hunches about what the market will bear, not on actual data detailing what consumers have been willing to pay under similar circumstances in the past; managers hire people based on intuition, not on an analysis of the skills and personality traits that predict an employee’s high performance; supply chain managers maintain a comfortable level of inventory, rather than a data-determined optimal level; baseball scouts zoom in on players who “look the part,” not on those with the skills that—according to analytics—win games.
Socrates said, “The unexamined life isn’t worth living.” We’d argue that “the unexamined decision isn’t worth making.”
Consider this firsthand report from an executive with a software company. When asked about a recent sales seminar put on by the firm, he replied: “It went fine. We had attendees from 110 companies who received a keynote presentation designed to instill confidence in our company’s future and to encourage cross-selling, and all twelve technical sessions were well received.”
That would be enough for many companies. “I guess no decision needs to be made other than to continue holding these seminars at a pace of twelve per quarter around the country,” he reflected. But after further thought, he voiced some disquieting questions about what the sales seminar did not reveal:
• How many attendees were existing customers and how many were prospects?
• Were there attendees from every customer within the geographic area?
• Were there attendees from every prospect in the geographic area?
• Which attendees were high-growth prospects?
• How many attendees also attended the company’s annual conference?
His company simply didn’t know the answers to these questions. It had never bothered to gather and analyze the data. The executive considers his company to be more analytical than most, but, at least with regard to these seminars, it has a long way to go. As this anecdote suggests, even relatively smart and sophisticated companies are missing opportunities to put analytics to work and thereby profit from better decisions.
Companies that continue to manage on autopilot—by having sales seminars because that’s what’s always been done, for example—are not competing as effectively as they could be. In this book, we’ll provide you with a set of tools to make your organization more analytical. We’ll demonstrate that becoming more analytical is not solely the responsibility of a manager: it’s an essential concern for the entire organization.
What’s the payoff for putting analytics to work in your organization? There are many, as shown in “Some Benefits of Being Analytical.” We believe it’s no accident that the companies we cite as outstanding analytical competitors are often also outstanding performers. Analytics aren’t the only way an organization can succeed, but in most industries there are excellent illustrations that the analytical path is a viable route to success.
Some Benefits of Being Analytical
• Help manage and steer the business in turbulent times. Analytics give managers tools to understand the dynamics of their business, including how economic and marketplace shifts influence business performance.
• Know what’s really working. Rigorous analytical testing can establish whether your intervention is causing desired changes in your business, or whether it’s simply the result of random statistical fluctuations.
• Leverage previous investments in IT and information to get more insight, faster execution, and more business value in many business processes.
• Cut costs and improve efficiency. Optimization techniques can minimize asset requirements, and predictive models can anticipate market shifts and enable companies to move quickly to slash costs and eliminate waste.
• Manage risk. Greater regulatory oversight will require more precise metrics and risk management models.
• Anticipate changes in market conditions. You can detect patterns in the vast amount of customer and market data coming your way.
• Have a basis for improving decisions over time. If you are using clear logic and explicit supporting data to make a decision, you or someone else can examine the decision process more easily and try to improve it.
What Do We Mean by “Analytical”?
By analytical we mean the use of analysis, data, and systematic reasoning to make decisions. What kind of analysis? What kind of data? What kind of reasoning? There are no hard-and-fast answers; we contend that almost any analytical process can be good if provided in a serious, systematic fashion.
Many approaches to analysis are fair game, from the latest optimization techniques to tried-and-true versions of root-cause analysis. Perhaps the most common is statistical analysis, in which data are used to make inferences about a population from a sample. Variations of statistical analysis can be used for a huge variety of decisions—from knowing whether something that happened in the past was a result of your intervention, to predicting what may happen in the future. Statistical analysis can be powerful, but it’s often complex, and sometimes employs untenable assumptions about the data and the business environment.
When done correctly, statistical analyses can be both simple and valuable. You may remember from your college statistics course that “measures of central tendency”—means, medians, and modes (everybody always forgets what a mode is; it’s simply the category with the highest frequency)—are useful ways to express what’s going on in data. Sometimes analysis simply means a visual exploration of data in graphic form. You can look at a series of points on a two-dimensional graph, for example, and notice a pattern or relationship. Are there outliers in a pattern that require explanation? Are some values out of range? Visual analysis helps us to “stay close to the data” using “exploratory data analysis,” an approach that the great statistician John Tukey made respectable and Edward Tufte further popularized by helping people create clear visual representations of their data. 2
The key is to always be thinking about how to become more analytical and fact based in your decision making and to use the appropriate level of analysis for the decision at hand—and when analyses and decisions are working well, not to rest on your laurels, lest you get stuck in a decision-making rut and be unable to adapt quickly when conditions change.
Some areas of business, like environmental sustainability, haven’t historically used data or analysis, so you could become more analytical by creating simple metrics of key activities (for example, a carbon footprint), reporting them on a regular basis, and acting on the patterns that emerge. This initial step would accomplish a lot—but getting an organization to agree upon metrics in a new area is no easy task.
In other areas, such as customer behavior, you may have so much detailed data available—from a loyalty card program, say, or a Web site—that making good decisions about how to treat customers requires sophisticated analytics, including detailed segmentation, scoring customers based on their propensity to exhibit certain behaviors, and next-best-offer analysis for what customers should buy next. Producing a mere report would be seriously underachieving in this data-rich domain.
Of course, some forms of analysis don’t require quantitative data. For example, in the fields of corporate anthropology and ethnography, marketers conduct analysis by systematically observing customers while they use products or shop in stores. As Yogi Berra noted, “You can observe a lot just by watching.” The most rigorous marketers employ video and systematic behavior coding to ensure that all recorded behaviors can be analyzed later in detail. Ethnography can help companies identify problems that customers have with their products and services. Data gained through observation can also shed light on a statistical association. We may know that men with young families purchase both beer and diapers in the grocery store, but only systematic observation can reveal which they buy first, and whether it makes sense to shelve them in close proximity or at opposite ends of the store.
The most analytical firms and managers employ a combination of techniques, both quantitative and qualitative. eBay, for example, undertakes extensive and varied analyses by performing randomized tests of Web page variations before making any change to the Web site or the business model. With more than a billion page views per day, eBay can run thousands of such experiments, many concurrently. To make sense of all these tests, eBay built its own application, called the eBay Experimentation Platform, to lead testers through the process and to keep track of what’s being tested at what times on what pages. Of course, you may not feel that you can undertake the kinds of complex and detailed testing and analyses that eBay, blessed with a massive amount of data (all those mouse clicks), can support.
But in addition to online testing, eBay considers changes to its Web site using a variety of analytical approaches: the company conducts extensive, face-to-face testing with its customers, including lab studies, home visits, participatory design sessions, focus groups, and iterative trade-off analysis. eBay also conducts quantitative visual design research and eye-tracking studies, and diary studies to see how users feel about potential changes. The company will make no significant changes to its site without these analyses. This analytical orientation is not the only reason eBay is successful, but it’s clearly one factor, with 113 million items for sale in over fifty thousand categories at any given time.
It’s not our goal in this book to provide you with a list of all possible analytical tools, but rather to persuade you that putting analytics to work can help your managers and employees make better decisions, and help your organization perform better. Analytics aren’t just a way of looking at a particular problem, but rather an organizational capability that can be measured and improved. It is our goal to describe the primary components of that capability and the best ways to strengthen them. Think of this book as therapy for your organization’s analytical brain.
What Kinds of Questions Can Analytics Answer?
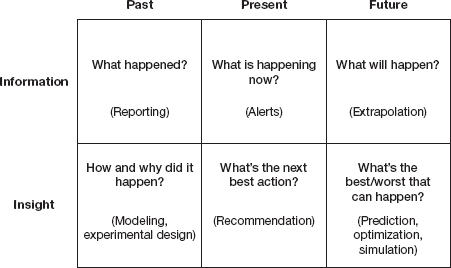
Every organization needs to answer some fundamental questions about its business. Taking an analytical approach begins with anticipating how information will be used to address common questions (see figure 1-1). These questions are organized across two dimensions:
• Time frame. Are we looking at the past, present, or future?
• Innovation. Are we working with known information or gaining new insight?
The matrix in figure 1-1 identifies the six key questions that data and analytics can address in organizations. The first set of challenges is using information more effectively. The “past” information cell is the realm of traditional business reporting, rather than analytics. By applying rules of thumb, you can generate alerts about the present—what’s happening right now (like whenever an activity strays outside of its normal performance pattern). Using simple extrapolation of past patterns creates information about the future, such as forecasts. All of these questions are useful to answer, but they don’t tell you why something happens or how likely it is to recur.
The second set of questions requires different tools to dig deeper and produce new insights. Insight into the past is gained by statistical modeling activities, which explain how and why things happened. Insight into the present takes the form of recommendations about what to do right now—for example, what additional product offering might interest a customer. Insight into the future comes from prediction, optimization, and simulation techniques to create the best possible future results.
Key questions addressed by analytics
Together these questions encompass much of what an organization needs to know about itself. The matrix can also be used to challenge existing uses of information. You may find, for example, that many of your “business intelligence” activities are in the top row. Moving from purely information-oriented questions to those involving insights is likely to give you a much better understanding of the dynamics of your business operations.
Analytics for the Rest of Us
In our previous book, Competing on Analytics, we described companies that build their entire strategies around their analytical capabilities. We were gratified by the success of a book on such a nerdy topic, and we certainly still believe that analytical competition is a viable strategic choice for companies in almost every industry.
However, as we talked about the book to readers and conference attendees around the world, we found that we’d missed a big audience. Many of our readers worked in companies that didn’t want to become analytical competitors, but rather wanted to move their organizations toward greater analytical maturity. They believed that making decisions on facts and analytics was beneficial, but they didn’t necessarily want to build their companies and value propositions around doing so. Although they politely listened to our speeches and praised our book, we could see that they were really in the market for some slightly different ideas.
While we suspect this book will be of great interest to analytical competitors, it speaks more directly to a broader base of organizations: those aiming to become more analytical. If you think that your organization ought to make more decisions based on facts (not unaided intuition or prejudice), or if you want to unleash the potential buried in your company’s data, this book will help you. We still urge companies, over time, to move toward a mentality and strategy of competing on analytics—we think that’s where the greatest benefits lie. But those who seek a more incremental approach can still be more analytical, even if primarily competing on other factors, such as product innovation, customer relationships, operational excellence, and so forth.
In this book we occasionally refer to analytical competitors, such as Harrah’s Entertainment, Capital One, and Progressive Insurance, because they are great repositories of leading analytical practices. But most of the companies we describe in this book are not aggressive analytical competitors—they’ve just figured out how to make more analytical decisions and have profited from them.
Why It’s Time to Put Analytics to Work
Most companies today have massive amounts of data at their disposal. The data may come from transaction-oriented applications such as ERP (enterprise resource planning) systems from software vendors such as SAP and Oracle, scanner data in retail environments, customer loyalty programs, financial transactions, or clickstream data from customer Web activity. But what do they do with all this information? Not nearly enough.
Managers we interviewed at a retail grocery chain confessed to this deficiency when we asked them what they did with their data. One manager said, “Well, we sell it. In fact, we make more money selling data to retail data syndication firms than we do selling meat.” We dutifully said that result was impressive, but the firm’s managers also admitted to a less impressive fact—that they later buy back their own data, mixed with that of local competitors.
“What else do you do with it?” we asked.
“We store it on disk,” they told us. “Then we put it on tape. Then we store it under a mountain so that it’s safe from nuclear attack.”
“But what do you actually do with it to manage your business?” we persisted.
“Not much,” they confessed. “That’s why we wanted to talk with you.”
Companies, governments, and nonprofits, in sophisticated economies and developing nations alike, stumble over the same ineffective strategies as this retailer. They collect and store a lot of data, but they don’t use it effectively. They have information and they make decisions, but they don’t analyze the information to inform their decision making.
Of course, companies won’t become analytical all at once. Instead, they will do so one decision at a time. They’ll look at individual decisions and say, “We can do better.” Then they’ll apply fact-based and quantitative analysis to make that decision more accurately, more consistently, and with an eye toward the future, rather than just reporting on the past. When they realize how much better they make that one decision, they’ll move on to others. To some extent, this creeping improvement of decisions is inevitable as our society becomes more computerized, data-rich, and analytical. However, those who move forward with intent and urgency have an edge over those who simply evolve.
Where Do Analytics Apply?
Analytics can help to transform just about any part of your business or organization. Many organizations start where they make their money—in customer relationships. They use analytics to segment their customers and identify their best ones. They analyze data to understand customer behaviors, predict their customers’ wants and needs, and offer fitting products and promotions. They ensure that the money and resources devoted to marketing focus on the most effective campaigns and channels. They price products for maximum profitability at levels that they know their customers will pay. Finally, they identify the customers at greatest risk of attrition, and intervene to try to keep them.
Supply chain and operations is also an area where analytics are commonly put to work. The most effective supply chain organizations optimize inventory levels and delivery routes, for example. They also segment their inventory items by cost and velocity, build key facilities in the best locations, and ensure that the right products are available in the right quantities. If they’re in service businesses, they measure and fine-tune service operations.
Human resources, a traditionally intuitive domain, increasingly uses analytics in hiring and employee retention. Just as sports teams analyze data to pick and keep the best players, firms are using analytical criteria to select valuable employees and identify those who are most likely to depart. They’re also identifying which operational employees should work at which times to maximize sales and profits.
Not surprisingly, analytics can also be applied to the most numerical of business areas: finance and accounting. Instead of just putting financial and nonfinancial metrics on scorecards, leading firms are using analytics to determine which factors truly drive financial performance. In this era of instability, financial and other firms are using analytics to monitor and reduce risk. And recent problems in the investment industry notwithstanding, no one really believes that the serious business of investment can proceed without analytics. In banking and insurance, the use of analytics to issue credit and underwrite insurance policies grows ever more common and sophisticated.
We have little doubt that the use of analytics will continue to grow—in businesses, nonprofits, and governments—in part because the volume and variety of available data will continue to grow. As more processes are automated and instrumented with sensors, the only way to control them efficiently is to analyze the vast volumes of data they produce. Today, smart grids use analytics to optimize and reduce energy usage for sustainability. Someday, we may live on a “smart planet,” with the ability to monitor and analyze all aspects of the environment. It’s already an analytical world, and it will only become more so.
When Are Analytics Not Practical?
We feel strongly that most organizations can benefit from a more analytical approach. However, there are some times when being analytical just doesn’t fit the situation. These include the following:
When There’s No Time. Some decisions must be made before data can be gathered systematically. One of the best examples is the decision Gary Klein addresses in his book Sources of Power. 3 When a firefighter is in a burning building, trying to decide whether the floor is about to collapse, he has to “gather data” rapidly by observing his surroundings. He’s unlikely to perform a logistic regression analysis.
When There’s No Precedent. If something has never been done before, it’s hard to get data about it. The obvious analytical response in such a situation is to perform a small-scale randomized test on the idea and see if it works. But sometimes testing isn’t possible, either. Mike Linton, formerly the chief marketing officer for Best Buy, says that it’s not always possible to use analytics before making marketing decisions: “You have to mix the ‘ready/aim/fire’ analytical decision making with the ‘ready/fire/aim’ approaches sometimes. For example, we tied a new Paul McCartney CD we were selling exclusively with promotion of his concert tour. That had never been done before, to our knowledge, and we couldn’t test it. You use all the decision tools at your disposal, but sometimes you have to go with intuition.” 4 It is worth noting, though, that Best Buy defines beforehand how it will evaluate the success and impact of such experiments, thus creating new insights and building a platform for making fact-based decisions the next time.
When History Is Misleading. Even when ample precedents exist, as the fine print on the stockbroker ads warns, “past performance is not necessarily indicative of future results.” Improbable, unpredictable events, called “black swans” by Nassim Nicholas Taleb, are immune to analysis. 5 Though Taleb unwisely discounts all statistical analysis because of these anomalies, statistical analysis is very useful most of the time. Rather than abandoning statistics altogether, companies should try to identify those unusual times when the past is not a good guide to the present.
When the Decision Maker Has Considerable Experience. Sometimes a decision maker has made a particular decision often enough to have internalized the process of gathering and analyzing data. If you’re an experienced home appraiser, for example, you can approximate what a home is worth without feeding data into an algorithm.
When the Variables Can’t Be Measured. Some decisions are difficult to make analytically because the key variables in the analysis are hard to measure with rigor. For example, while the process of finding a romantic partner or spouse has been the subject of considerable quantitative analysis (as employed by firms such as eHarmony), we’re not strong believers in the power of analytics to help you choose a mate. Analytics can be a start, but cannot replace intuitive judgments in such domains; you may want to meet your “match” in person before buying a ring!
Even though they’re not always feasible, analytics are valuable enough that they should be the first, rather than the last, resort in making decisions. In many intuitive organizations, analytics are merely a rationalization, wherein data is selected to support a decision that’s already been made. As the Scottish writer Andrew Lang commented, “Statistics are often used as a drunken man uses a lamppost—for support rather than illumination.” Intuition, too often the default tool of decision makers, should be employed only when there is no alternative. Even in the circumstances listed above, in which intuition is appropriate, it’s worthwhile to track the intuition applied, the decisions made, and the results. Over time, such recordkeeping can turn intuition into rules of thumb and even algorithms.
When Analytical Decisions Need Scrutiny
We are inevitably headed to a more analytical future; you can’t put all the data genies back in their server bottles. But if we are going to use analytics, we have to do it well. The same process and logic errors that cause people to err without analytics can creep into analytical decisions. Analytics at Work is a guidebook for smart people who want to learn how to avoid the pitfalls shown in “Typical Decision-Making Errors.”
As “Typical Decision-Making Errors” demonstrates, even companies with the best intentions of being analytical can err in many ways if not careful. For example, a Canadian power generation firm, TransAlta, made a spreadsheet error that cost the company $24 million in hedging contracts. 6 NASA famously lost a $125 million Mars Orbiter spacecraft by neglecting to consistently employ the metric system in its analyses. The state of North Carolina based an important decision on a faulty model that incorporated overly positive assumptions about the jobs and sales taxes that new employers in the state would bring. As a result, the state gave out millions of dollars in incentives that may not have been warranted. 7
North Carolina’s misstep demonstrates a typical problem: analytical thinking based on invalid or outdated assumptions. Every quantitative analysis is based on assumptions. Technical assumptions might include a belief that a sample is randomly selected or that data are normally distributed. Assumptions about the world that a model reflects may encourage the erroneous belief that factors outside the model are held constant, when they actually aren’t. Most models assume accuracy only within the range of data gathered, barring the possibility of accurate predictions or explanations outside of the model’s specific times, geographies, or types of people. Attempting to judge factors outside of the model’s range could cause serious trouble. That was one of the problems in the recent financial crisis (see “Analytics and the 2007–2009 Financial Crisis”).
Typical Decision-Making Errors
Logic Errors
• Not asking the right questions
• Making incorrect assumptions and failing to test them
• Using analytics to justify what you want to do (gaming or rigging the model/data) instead of letting the facts guide you to the right answer
• Failing to take the time to understand all the alternatives or interpret the data correctly
Process Errors
• Making careless mistakes (transposed numbers in a spreadsheet or a mistake in a model)
• Failing to consider analysis and insights in decisions
• Failing to consider alternatives seriously
• Using incorrect or insufficient decision-making criteria
• Gathering data or completing analysis too late to be of any use
• Postponing decisions because you’re always dissatisfied with the data and analysis you already have
Analytics and the 2007–2009 Financial Crisis
It’s clear that the financial services industry has used analytics in the wrong way. The financial industry’s subprime crisis in 2007–2009 illustrates many analytical approaches gone wrong. For example, banks used analytics to issue subprime mortgage loans. Many firms continued to make loans even though a close analysis of the data would have suggested that many customers were beginning to default on them.
A series of faulty assumptions compounded the problem: Wall Street “quants” included an excessive number of years of history in their trading models for mortgage-backed securities to make them look less risky;a mortgage lending models relied on the assumption that housing prices would continue to rise; and credit default models were based on the assumption of liquidity in credit markets.
It’s also clear that risk analytics are not what they should be. AIG became a government-owned firm primarily because of its inability to price and predict credit defaults; Moody’s, Standard & Poors, and Fitch were clearly unable to assess the risk of mortgage-backed securities and attach accurate credit ratings to them. The 1987 stock market crash was caused in part by a similar inability to assess the risk of portfolio insurance.
Going forward, financial firms need to radically change their analytical focus. They need to make the assumptions behind the models much more explicit and transparent. They need to incorporate the systematic monitoring of analytical models into their businesses. They—and their regulators—need to be skeptical about the ability to model and manage risk in extraordinary circumstances.
Perhaps most important, financial executives need to learn much more about the models that are running their businesses. In search of outsized returns, they’ve taken on investment and debt securities that are bundled up in algorithmic combinations that they don’t understand. Cowed by this accumulation of daunting numbers, these executives have abdicated responsibility for managing risk. If you’re a U.S. citizen, you now own part of several such firms; wouldn’t you prefer that the executives running your business understand how it works?
a. Saul Hansell, “How Wall Street Quants Lied to Their Computers,” New York Times blog, http://bits.blogs.nytimes.com/2008/09/18/how-wall-streets-quants-lied-to-their-computers/.
Not everyone was drawn into poor analytical decisions in the financial services industry. For example, according to an article about Wells Fargo:
Richard Kovacevich, chairman of Wells Fargo, and his lieutenants deliberately steered clear of the riskiest sorts of subprime mortgages—“stated income” or “low documentation” loans to borrowers with sketchy credit. They stayed out even though it caused them to lose market share in the short term that would have generated big loan fees. “We talked about what others [banks, investment firms and mortgage brokers] were doing,” but decided “it’s economically unsound” and “doesn’t make sense,” he says. By making such risky loans to financially stretched borrowers, “you’re basically saying, ‘Defraud me,’” adds Mr. Kovacevich, whose bank has avoided the huge losses incurred at rivals. Giving that kind of loan “isn’t in our DNA.” 8
Maybe it takes an analytical CEO to understand these now-obvious risks. Kovacevich of Wells Fargo is known for his interest in fact-based decision making and quantitative testing. The bank has done pretty well in the current crisis, and was able to pick up a large rival, Wachovia, at a bargain price. Ed Clark, the CEO of Toronto Dominion Bank and a Harvard PhD in economics, also resisted the subprime wave, and insisted that his managers understand the deals they did buy into. 9
As the financial and investment industries (and for that matter, all industries) become more data oriented and analytical, it is incumbent upon senior executives to master some degree of analytical complexity. Otherwise, they’re not going to be able to push back when some trader suggests that they take on inordinate and poorly understood risk, putting their institutions and their customers in great jeopardy.
Combining Art and Science
Analytics will continue to be critical in financial services and all other industries, so the best decision makers will be those who combine the science of quantitative analysis with the art of sound reasoning. Such art comes from experience, conservative judgment, and the savvy to question and push back on assumptions that don’t make sense. Art also plays a role in creatively formulating and solving problems—from data collection to modeling to imagining how results can best be deployed and managed.
A good illustration of the art of judgment arose when one of us (Tom) was talking casually with an airline pilot at a social gathering about his work on analytics. The pilot responded, “Oh, yes, we’ve got lots of that in modern airliners—avionics, lots of computers, ‘fly by wire,’ and all that. But I still occasionally find it useful to look out the window.” A good business executive will take the pilot’s advice—certainly pay attention to the computers and analytics that help to run the business, but always look out the window for threats that the analytical models can’t predict.
Some firms actively try to balance art and science. Netflix’s CEO, Reed Hastings, started the company with a strong scientific orientation, but he tries to ensure that managers and employees don’t neglect art in decisions. For example, he sponsored a series of discussions on storytelling to ensure that Netflix employees could express even analytical results in a compelling narrative form.
Netflix’s chief content officer, Ted Sarandos, is responsible for choosing films that Netflix will distribute. He confirms the need for art and science: “For a technology company like Netflix, we are the group that is most dependent on art. What we do is probably 70 percent science, 30 percent art. Our buying staff has to have their finger on the pulse of the market to make their decisions. A high box-office performer won’t necessarily be a high video performer, and vice versa. The box office is an indicator, as a proxy for awareness, but not for demand.” 10
In a variety of ways, art is already built into analytics. First is the hypothesis, which is really an intuition about what’s happening in the data. Hypotheses enter the realm of science when subjected to the requisite testing.
Choosing the business area to support with analytics also requires art. As we describe in chapter 5, creating targets for analytical activity calls for a mixture of intuition, strategy and management frameworks, and experience. To choose the best target, the decision maker must also have a vision of where a company and its industry are headed and what its customers will value in the future. This kind of integrative, big-picture assessment is something that human brains tend to do better than computers.
Art also comes in when smart, experienced humans decide that their analytical models no longer apply. Recognizing the limits of analytics is a key human trait that will not change.
While analytics are not perfect, we prefer them to the shoddy alternatives of bias, prejudice, self-justification, and unaided intuition. Humans often make long lists of excuses not to be analytical, but there’s plenty of research showing that data, facts, and analysis are powerful aids to decision making, and that the decisions made on them are better than those made through intuition or gut instinct. Therefore, use analytics. If you can measure and analyze something, do it—but don’t forget to incorporate your experience, knowledge, and qualitative insights about the world.
Finally, what makes analytical organizations so interesting, in our view, is the needed combination of human and computational perspectives. Analytical decision making is at the intersection of individual and organizational capabilities. How analytical an organization becomes depends upon the quality of the sum total of decisions across the organization—decisions made by distributed decision makers who may not even talk to each other about the role of analytics in their deliberations. The quality and analytical soundness of those decisions depends on not just the intelligence and experience of the decision makers, but on a host of organizational factors that can be assessed and improved. We’ll spend the next ten chapters talking about them.