Software development can be a complex and (at times) error-prone process. As you have learned over the course of reading this book, the Objective-C platform provides a myriad of features to make you a more efficient, productive programmer. However, the bottom line is that the programs you write will have bugs; so the question is how do you mitigate them? Specifically, how do you detect bugs, validate program correctness, and analyze program control flow? Or perhaps of even greater importance, what is the process you use for debugging code? For example, do you analyze program state by inserting debugging statements in your source code? The Xcode debugger is the key tool for detecting runtime and logical errors in your software. In addition, it provides a variety of features that can also make you better at debugging.
In this appendix, you will learn about debugging your programs in Xcode using the LLVM Debugger (LLDB). We’ll begin by briefly reviewing the LLVM compiler infrastructure, several of whose components are leveraged by LLDB. Next, you will explore the design of LLDB and review its key components. You will then learn how Xcode supports debugging with LLDB, and finally debug a few example programs with LLDB, thereby becoming familiar with some of its key features. By the end of this appendix, you should be convinced of the power and capability of LLDB, and will use it whenever you program with Xcode using Objective-C.
LLVM Overview
LLVM (originally an acronym for Low Level Virtual Machine) was conceived as a compiler framework for programs written in arbitrary languages. Currently, the LLVM project consists of a collection of modular, reusable components (libraries, toolsets, runtimes) used for program analysis and compilation (as shown in Figure C-1).
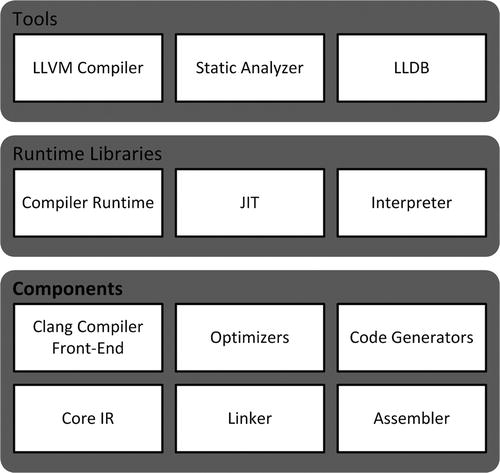
Figure C-1. LLVM project components
These components can be used as infrastructure to implement a variety of capabilities, such as compilers, optimizers, and debuggers. The following are brief definitions for several of the components under the LLVM project:
- Clang compiler: Clang is a modern compiler for the C, Objective-C, and C++ programming languages. It is responsible for parsing, validating, and diagnosing errors in the input code, and then translating the parsed code into LLVM intermediate representation (IR). Like the LLVM project, Clang is itself divided into modular, reusable libraries that expose public APIs.
- Optimizers: The LLVM optimizers perform code optimization, traversing some portion of code to either collect information or perform transformations. Their features include compile-time optimization, link-time optimization, and optimization across language boundaries.
- Code generator: The LLVM target-independent code generator is a framework that provides a suite of reusable components for translating the LLVM internal representation to the machine code for a specified target—either in assembly form (suitable for a static compiler) or in binary machine code form (usable for a JIT compiler).
- Disassembler: The disassembler takes an LLVM bitcode file and converts it into human-readable LLVM assembly language.
- JIT: The LLVM Just-in-Time (JIT) compiler performs runtime translation of LLVM IR code into machine code. It also performs runtime optimization based on dynamic information.
As depicted in Figure C-1, a few of the tools that have been built using the LLVM project components include the LLVM compiler (the standard compiler for Xcode), the static analyzer (also used by Xcode), and the LLDB debugger. Xcode’s integration with LLVM components and tools provides many benefits in addition to Objective-C source code compilation. These benefits include real-time notification of warnings and errors as you type your code, suggested corrections for coding mistakes, improved code completion, source code static analysis, and comprehensive support for program debugging with LLDB, the default debugger for Xcode.
LLDB
LLDB is a modern, high-performance debugger for the C, C++, and Objective-C programming languages. It is built as a set of reusable components that leverage existing components and libraries of the LLVM Project (Clang compiler, JIT, disassembler, etc.). LLDB provides up-to-date C, C++, and Objective-C language support, support for expressions that can declare local variables and types, just-in-time compilation of expressions for improved performance, and a public API that enables LLDB to be used for other purposes (disassembly, object and symbol file introspection, etc.) in addition to debugging. The entire LLDB API is also available as Python functions through a script-bridging interface. This means the LLDB API’s can be used directly from Python or, alternatively, Python can be used within the LLDB command-line tool. LLDB can be run standalone via its command-line tool or directly within Xcode.
LLDB was developed using object-oriented design practices, including data encapsulation (no global variables) and a plug-in based architecture that facilitates modularity and extensibility. The next few paragraphs provide an overview of the libraries that comprise LLDB and examine in more detail a few of its significant design elements.
LLDB is designed as a collection of libraries that are logically grouped, as follows:
- API: The LLDB public interface, currently written in C++. This API enables LLDB to be reused by other programs. It is also used by the LLDB command-line tool.
- Breakpoint: A collection of classes that implement debugging breakpoints. LLDB supports line breakpoints, symbolic breakpoints, and exception breakpoints. Exception breakpoints are hit anytime an exception is thrown or caught. Symbolic breakpoints cause program execution to pause when a symbol name (e.g., a method invocation or function call) is encountered.
- Commands: A collection of classes that implement the functionality for the textual commands of the LLDB command-line tool.
- Core: Classes that implement basic functionality required by LLDB.
- Data formatters: A collection of classes that implement the data formatters for LLDB. These are used to define custom display options for debugging variables.
- Expressions: These classes are used to perform expression parsing. They can evaluate DWARF expressions up to programming language (e.g., Objective-C) expressions using the Clang compiler front end. DWARF is a general-purpose debugging file format used to support source-level debugging. DWARF expressions describe how to compute a value or how to name a location during the debugging of a program. The expression classes enable a variety of features, including multiline expressions, local variable support, flow control, and persistent expression global variables.
- Host: A set of classes that provide an abstraction from the host on which LLDB is running (system functions, etc.).
- Interpreter: A collection of classes responsible for being the base classes needed for each command object. It is responsible for tracking and running command-line commands.
- Symbol: Classes that provide everything needed in order to parse object files and debug symbols. All the needed classes for compilation units (code and debug info for a source file), functions, lexical blocks within functions, inlined functions, types, declaration locations, and variables are in this section.
- Target: A set of classes that encapsulate data for a debug target (target, process, thread, stack frames, etc.).
- Utility: LLDB utility classes (string data extractors, etc.).
One of the most important features of a debugger is its ability to display the values of objects from the target program, also referred to as expression evaluation. Hence, a debugger’s expression evaluation capabilities are a key element of its design and implementation. Most debuggers implement a custom expression parser, and thus also create custom type representations used by the parser. As a consequence, changes to these type representations (e.g., as a result of programming language changes) requires changes to the parser. In addition, the expression parser aims for compiler-level accuracy. This level of accuracy is extremely difficult (if not impossible) to achieve, and also makes it difficult for the debugger to remain current with changes to the language and/or compiler. These factors, among others, make it difficult to write and maintain a debugger.
LLDB mitigates these issues by utilizing the LLVM Clang compiler front end; specifically, it converts debugging information into Clang data types. This enables LLDB to use Clang to parse command expressions and thus directly support the latest C, C++, Objective C, and Objective C++ language features and runtimes. Debugger error reporting is improved because it is identical to that provided by the compiler. LLDB also leverages the compiler for other functionalities, including making function calls within expressions and disassembling instructions.
LLDB is designed with a plug-in-based architecture for portability and extensibility. This enables it to easily utilize different implementations for supported functionality and to incorporate new plug-ins with no impact on the existing codebase. The plug-in architecture is currently used for object file parsers (currently supports Mach-O and ELF files), object container parsers (Mach-O and BSD archives), debug symbol file parsers (DWARF and Mach-O symbol tables), symbol vendors, disassembly (LLVM and ARM/Thumb), and general debugger plug-ins for host and target-specific functions.
Many programs have multiple threads, and debugging multithreaded applications can be difficult under even the best circumstances. LLDB is designed to support multithreaded debugging. It displays diagnostic information for each thread and provides a set of commands for operating on one or more threads within an application.
LLDB includes a comprehensive set of debugging commands that can be used with both Xcode and the command-line tool. The following are several of the commonly used LLDB debugger commands:
- apropos: Finds a list of debugger commands related to a particular word or subject.
- breakpoint: A set of commands that perform operations on breakpoints (set, clear, enable, disable, etc.). A breakpoint pauses execution of a target program, thereby enabling you to examine its current state. LLDB supports line breakpoints (set on a line of source code), symbolic breakpoints (set on a symbol [e.g., function/method name] in a program), and exception breakpoints (set when an exception is thrown or caught).
- disassemble: Disassemble bytes in a function, an address, and so forth.
- expression: Evaluates a C/C++/Objective-C expression in the current target using both user-defined variables and variables currently in scope.
- frame: A set of commands for operating on the current thread’s stack frame (info, select, variable).
- help: Shows a list of all debugger commands.
- log: A set of commands for operating on logs.
- memory: A set of commands that performs operations on memory (e.g., read from, write to).
- process: A set of commands for operating on a process (launch, kill, attach, detach, connect, etc.).
- register: A set of commands used to access thread registers (read, write, etc.).
- thread:A set of commands used to operate on one or more threads (single step, step over, continue, etc.). This enables you to control execution of a target program being debugged.
- watchpoint: A set of commands for operating on watchpoints (set, clear, enable, disable, etc.). A watchpoint is a form of conditional breakpoints set on a variable. It causes the target to stop execution whenever the value of the watched variable is changed.
LLDB implements a structured command syntax that facilitates its use and provides a mechanism to construct aliases for commonly used commands. The command-line tool also supports command completion for source file names, symbol names, and so forth with the Tab key. The general syntax for LLDB CLI commands is as follows:
<noun> <verb> [-options [option-value]] [argument [argument...]]
Each command has a subcommand (i.e., the verb) along with its applicable options and arguments. Listing C-1 depicts an example of an LLDB debugging session of the application named FirstProject (recall that you developed this application in Chapter 1) using the command-line tool.
Listing C-1. Example LLDB Debug Session Using the Command-Line Tool:
% xcrun lldb
(lldb) target create FirstProject
(lldb) breakpoint set --name main
(lldb) process launch
(lldb) thread step-over
(lldb) breakpoint set --line 42
(lldb) thread continue
(lldb) expression (void)NSLog(@"Date = %@", dateTime)
(lldb) quit
As shown in Listing C-1, xcrun is an Xcode command that loads a binary contained within an Xcode bundle. This enables you to run LLDB from the command line. Next, the target create command loads the FirstProject application as a target for the debugger. The breakpoint set command sets a breakpoint at the main method. The expression (void)NSLog(@"Date = %@", dateTime) command evaluates an Objective-C expression that displays the current value for the dateTime object. The quit command ends the debugging session.
Xcode LLDB Integration
LLDB is the default debugger in Xcode, which augments the standard functionality of LLDB with a variety of features that can make you more efficient at debugging your code. Figure C-2 depicts an example debugging session in Xcode. In the following paragraphs, you will examine these features in more detail.
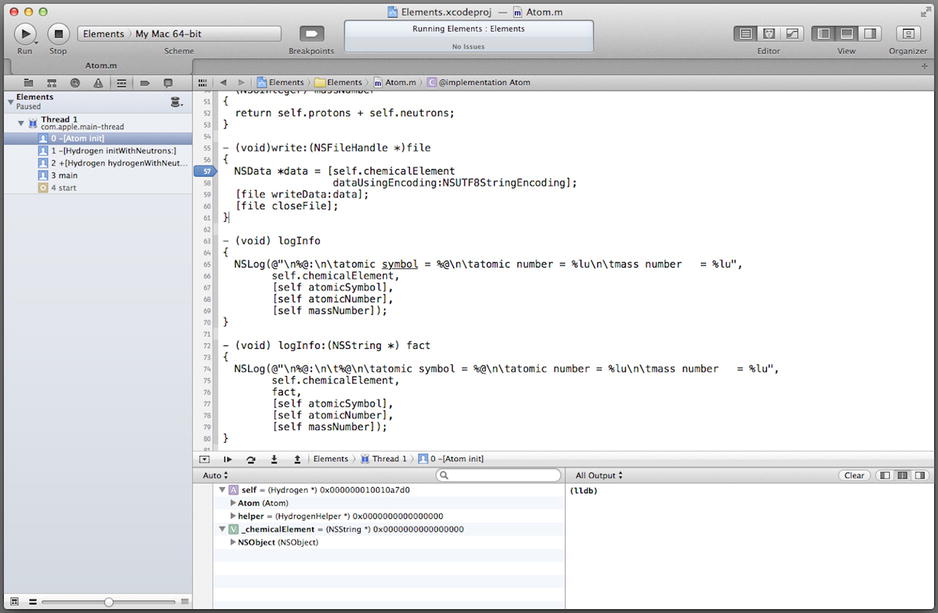
Figure C-2. Xcode debugging with LLDB
Debug Navigator
The debug navigator (displayed by selecting Navigators ![]() Show Debug Navigator from the Xcode View menu) displays the call stacks of your application when paused at a breakpoint. The navigator groups the stack frames by threads or queues (depending upon the view selected). It also enables you to view the memory of variables. The debug navigator opens automatically whenever you pause a running application or it hits a breakpoint. Figure C-3 depicts the debug navigator pane.
Show Debug Navigator from the Xcode View menu) displays the call stacks of your application when paused at a breakpoint. The navigator groups the stack frames by threads or queues (depending upon the view selected). It also enables you to view the memory of variables. The debug navigator opens automatically whenever you pause a running application or it hits a breakpoint. Figure C-3 depicts the debug navigator pane.
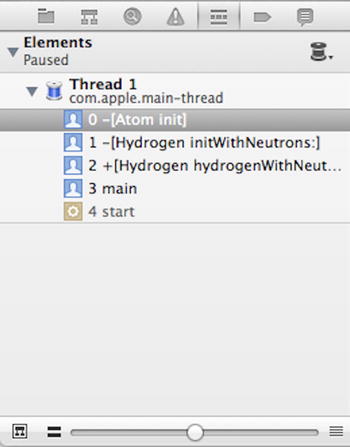
Figure C-3. Debug navigator pane
Breakpoint Navigator
The breakpoint navigator (displayed by selecting Navigators ![]() Show Breakpoint Navigator from the Xcode View menu) is used to edit, disable, and delete breakpoints in a project or workspace. You can add/delete a (line, exception, or symbolic) breakpoint, set breakpoint actions and options, specify the scope of a breakpoint, and share a breakpoint. Figure C-4 depicts the breakpoint navigator pane.
Show Breakpoint Navigator from the Xcode View menu) is used to edit, disable, and delete breakpoints in a project or workspace. You can add/delete a (line, exception, or symbolic) breakpoint, set breakpoint actions and options, specify the scope of a breakpoint, and share a breakpoint. Figure C-4 depicts the breakpoint navigator pane.
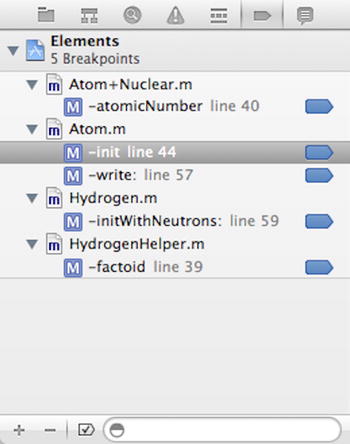
Figure C-4. Breakpoint navigator pane
Breakpoint Actions
A breakpoint action defines an operation performed when a target program reaches a breakpoint. Xcode provides the following breakpoint actions.
- Debugger command: This action evaluates a debugger command. As you recall from earlier in this appendix, the debugger is able to execute C/C++/Objective-C expressions, making this a very powerful tool.
- Log message command: This command logs a message to the output console or speaks a message.
- Shell command: This command executes a shell command (/usr/bin/ls, etc.).
- Sound command: This command plays a sound.
- AppleScript command: This command evaluates AppleScript code.
Breakpoint actions are configured when you edit a breakpoint. This can be done in the breakpoint navigator by Control-clicking the breakpoint, and then choosing Edit Breakpoint . . . from the shortcut menu (as shown in Figure C-5).
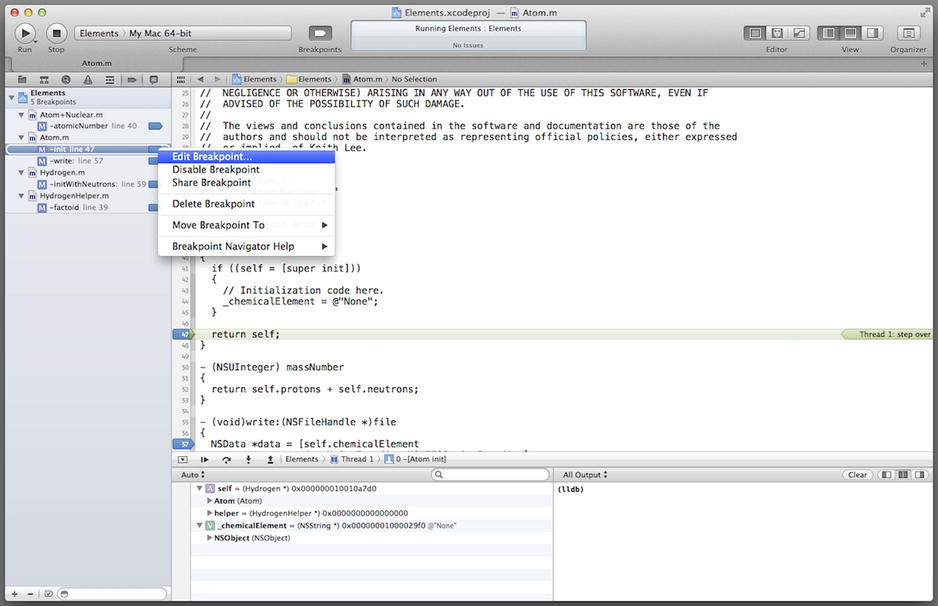
Figure C-5. Editing a breakpoint from the breakpoint navigator pane
The breakpoint action pop-up window enables you to select the type of command to be performed when the target program reaches a breakpoint. You can configure an option that defines additional breakpoint behaviors and you can set other properties specific to the type of breakpoint selected. Figure C-6 displays a breakpoint action configured to perform a debugger command that prints the value of the _chemicalElement instance variable, and then automatically continues program execution after the command is executed.
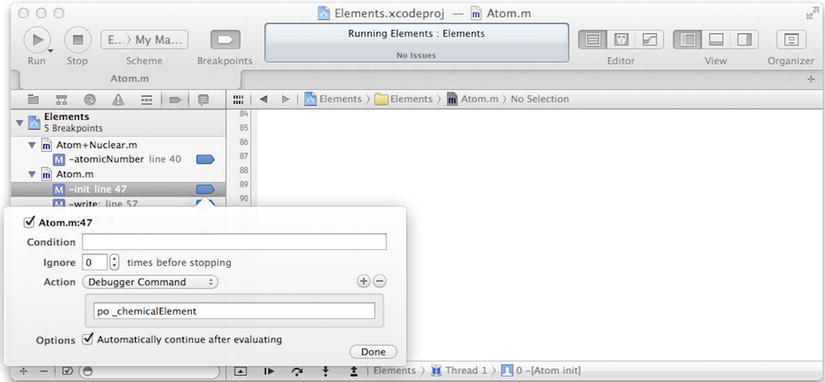
Figure C-6. Configuring a breakpoint action
Debug Area
The debug area is comprised of the debug bar (toolbar located at the top of the debug area), and the content pane (the remainder of the area). The debug bar is used to control program execution and to navigate through source code. The left side of the content pane is used to view program variables and registers. The right side of the content pane is used to view console output and interact with the debugger. The debug area is depicted in Figure C-7.
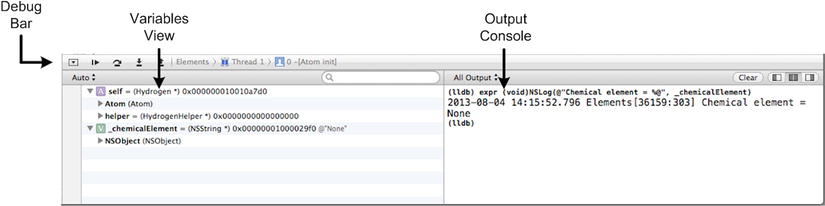
Figure C-7. Debug area
The debug bar is used to control target program execution and to navigate through its source code. There are five buttons on the left of the debug bar; from left to right, these buttons are used to
- Show/hide the debug area.
- Pause/resume program execution.
- Step over (i.e., execute) an instruction. If the instruction is a method/function call, it causes the whole method/function to be executed.
- Step into (i.e., execute) an instruction. If the instruction is a method/function call, it causes the debugger to jump to the first line of the method/function.
- Step out of the method/function. This causes the debugger to complete execution of the current method/function and jump to the next calling method/function or back to the method/function that called it.
The remainder of the debug area displays a pop-up menu that enables you to choose a thread in the program to debug.
The content pane is used to display variables and also provide a command-line interface for entering debugging commands. As depicted in Figure C-7, the left side of the content pane displays the variables view (for displaying values the variables in the current context), while the right side displays the output console (for the LLDB command-line interface in which debugger commands are executed).
Disassembly View
Xcode provides a disassembly view that enables you to view the set of assembly-language instructions seen by the debugger while your program is running. You can configure Xcode to display disassembly only, or both the source code and corresponding disassembly. To choose the disassembly view, select Debug Workflow ![]() Show Disassembly When Debugging from the Xcode Product menu. Figure C-8 displays both the source and disassembly view in the Xcode split editor pane.
Show Disassembly When Debugging from the Xcode Product menu. Figure C-8 displays both the source and disassembly view in the Xcode split editor pane.
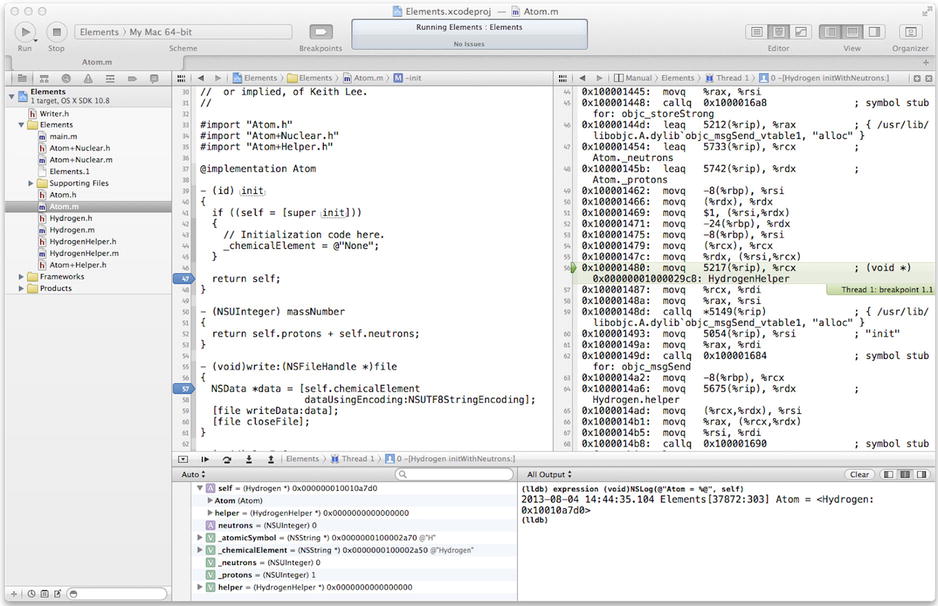
Figure C-8. Disassembly view
Now that you have received an overview of LLDB and debugging with Xcode, you will debug a program using Xcode. In Xcode, create a new project by selecting New ![]() Project . . . from the Xcode File menu. In the New Project Assistant pane, create a command-line application by selecting the Command Line Tool icon (from the Application selection under OS X template groups). In the Project Options window, specify BrokenCalculator for the Product Name, choose Foundation for the Project Type, and select ARC memory management by selecting the Use Automatic Reference Countingcheck box. Specify the location in your file system where you want the project to be created (if necessary, select New Folder and enter the name and location for the folder) and uncheck the Source Control check box.
Project . . . from the Xcode File menu. In the New Project Assistant pane, create a command-line application by selecting the Command Line Tool icon (from the Application selection under OS X template groups). In the Project Options window, specify BrokenCalculator for the Product Name, choose Foundation for the Project Type, and select ARC memory management by selecting the Use Automatic Reference Countingcheck box. Specify the location in your file system where you want the project to be created (if necessary, select New Folder and enter the name and location for the folder) and uncheck the Source Control check box.
Now create the calculator class. Select New ![]() File . . . from the Xcode File menu, select the Objective-C class template, and name the class Calculator. Select the BrokenCalculator folder for the files location and the BrokenCalculator project as the target, and then click the Create button. Next, in the project navigator pane, select the Calculator.h file and update the class interface as shown in Listing C-2.
File . . . from the Xcode File menu, select the Objective-C class template, and name the class Calculator. Select the BrokenCalculator folder for the files location and the BrokenCalculator project as the target, and then click the Create button. Next, in the project navigator pane, select the Calculator.h file and update the class interface as shown in Listing C-2.
Listing C-2. Calculator Class Interface
#import <Foundation/Foundation.h>

@interface Calculator : NSObject

- (NSNumber *) sumAddend1:(NSNumber *)adder1 addend2:(NSNumber *)adder2;

@end
The class declares a single instance method for returning the sum of two numbers. Next, use the Xcode project navigator to select the Calculator.m file and code the implementation as shown in Listing C-3.
Listing C-3. Calculator Class Implementation
#import "Calculator.h"

@implementation Calculator

- (NSNumber *) sumAddend1:(NSNumber *)adder1 addend2:(NSNumber *)adder2
{
  return [NSNumber numberWithInteger:([adder1 integerValue] +
                                      [adder2 integerValue])];
}
@end
The method returns the sum of the integer values of the two input parameters. OK, that’s pretty straightforward, now let’s move on to the main() function. In the project navigator, select the main.m file and update the main() function as shown in Listing C-4.
Listing C-4. BrokenCalculator main( ) Function
#import <Foundation/Foundation.h>
#import "Calculator.h"

int main(int argc, const char * argv[])
{
  @autoreleasepool
  {
    // Create instance and numbers to add
    Calculator *calculator = [[Calculator alloc] init];
    NSNumber *addend1 = [NSNumber numberWithInteger:10];
    NSNumber *addend2 = [NSNumber numberWithInteger:15];
    NSNumber *addend3 = [NSNumber numberWithInteger:-25];

    // Add numbers and validate correct sum returned
    NSNumber *sum1 = [calculator sumAddend1:addend1 addend2:addend2];
    NSCAssert(([sum1 intValue] == 25), @"Invalid sum computed");

    NSNumber *sum2 = [calculator sumAddend1:addend1 addend2:addend3];
    NSCAssert(([sum2 intValue] == 15),  @"Invalid sum computed");
  }
  return 0;
}
The method creates a Calculator instance and NSNumber instances, and then adds two numbers and validates that the correct sum is returned. When you compile and run the program, you should observe the messages in the output pane, as shown in Figure C-9.
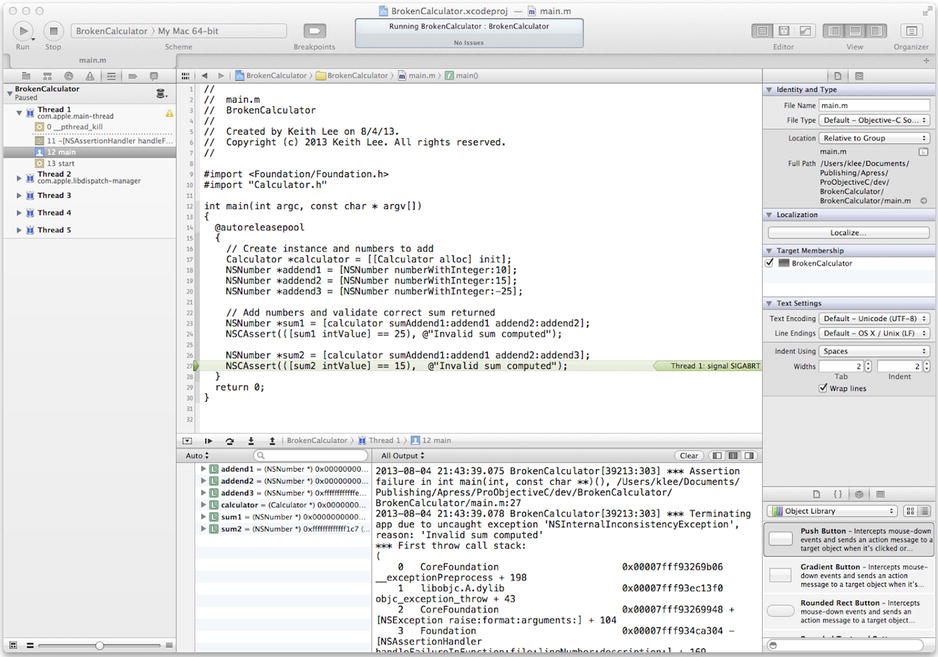
Figure C-9. BrokenCalculator program output
Figure C-9 shows that an exception was thrown—specifically an assertion failed, indicating that the sum returned was not the expected value. Now you will use the debugger to determine the cause of the problem. In the breakpoint navigator, add an exception breakpoint by clicking the plus (+) symbol at the bottom left of the navigator pane and selecting Add Exception Breakpoint . . . from the pop-up menu (as shown in Figure C-10).
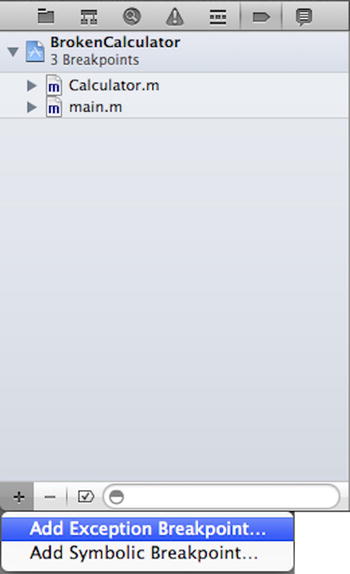
Figure C-10. Adding an exception breakpoint
In the exception breakpoint dialog, there are several settings. For Exception, select All (set on all exceptions), and for Break, select On Throw (set breakpoint when exception is thrown). When you compile and run the program, you should observe that the program pauses in the main function at the following line:
NSCAssert(([sum2 intValue] == 15), @"Invalid sum computed");
You can see that this assertion fails, causing the exception to be thrown. Now you will set some line breakpoints to troubleshoot the program. You set a line breakpoint in Xcode by clicking the gutter next to the corresponding line in your source code. In the project navigator, select the Calculator.m file and set a breakpoint at the line with the following statement:
return [NSNumber numberWithInteger:([adder1 integerValue] +
                                    [adder2 integerValue])];
Next, in the main() function, set a breakpoint at the line with the following statement:
NSCAssert(([sum1 intValue] == 25), @"Invalid sum computed");
Now edit this breakpoint to add a breakpoint action, as shown in Figure C-11.
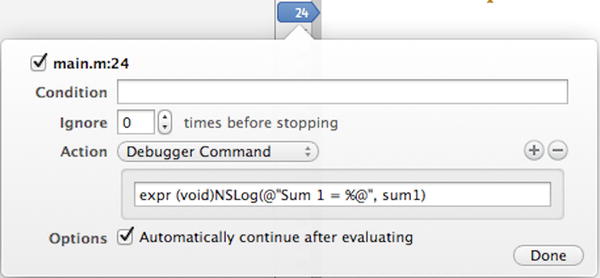
Figure C-11. Edit breakpoint action for calculator sum
This breakpoint action executes a debugger command that logs the value stored in variable sum1.
expr (void)NSLog(@"Sum 1 = %@", sum1)
Notice that the return type must be specified in debugger command expressions. In this case, the type is void, signifying that the NSLog function doesn’t return a value. Also note that the breakpoint option is set to automatically continue after executing. Effectively, this enables you to display the value of a program variable without having to write NSLog statements in your code, and hence avoid cluttering your code with debugging statements! When you compile and run the program, it pauses execution at the line breakpoint set for the sumAddend1:addend2: method, as shown in Figure C-12.
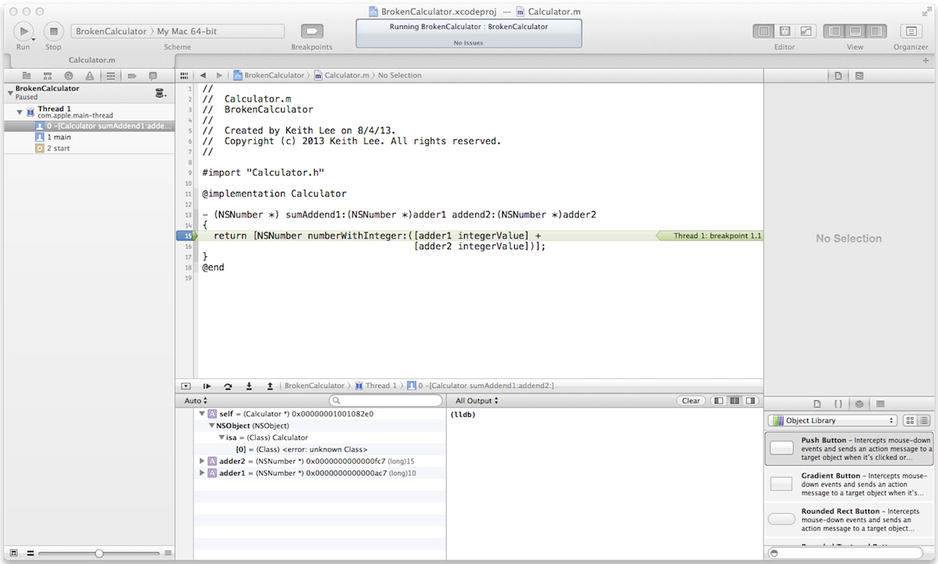
Figure C-12. Pausing execution at line breakpoint in sumAddend1:addend2: method
In the debug area content pane, you can see that the values for variables adder1 and adder2 are as expected. Now you would like to validate the return value from this method. This can be done with the step-out command (located in the debug bar). This command executes the remaining lines of a method/function in which the current execution point lies, and then displays the next statement following the method/function call. Select this button two times. After that is done, the return value is displayed in the content pane display area (Return Value), as shown in Figure C-13.
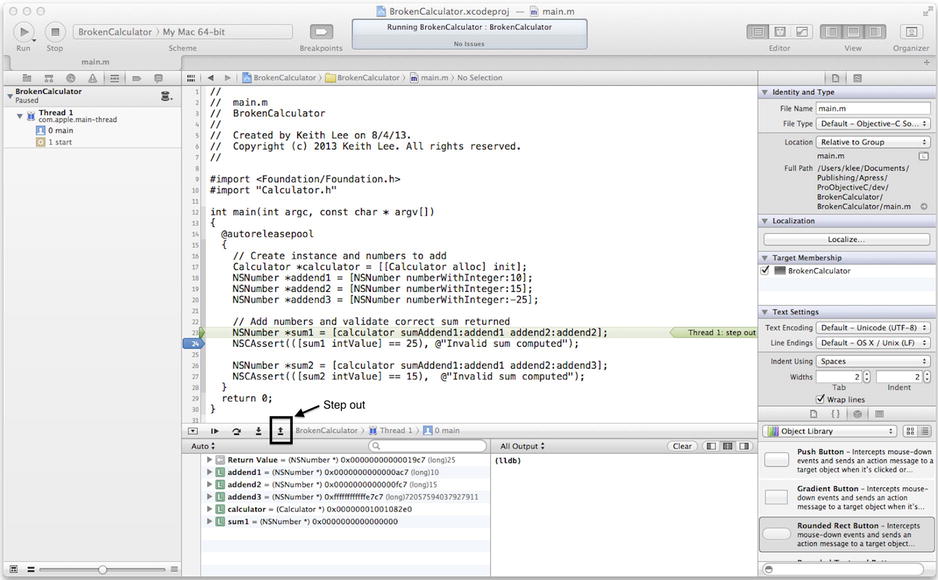
Figure C-13. Displaying the return value of a method using the debugger
The return value of 25 (shown in Figure C-13) is correct. Next, select continue in the debug bar (you may have to click the button two or three times). The output console logs Sum 1 = 25, per the breakpoint action debugger command that you configured earlier. Now observe that the debugger has paused again at the line breakpoint set for the sumAddend1:addend2: method. This time, use the debugger po command in the debug area content pane to display the values for the two parameters:
po adder1
po adder2
The output of these commands is shown in Figure C-14.
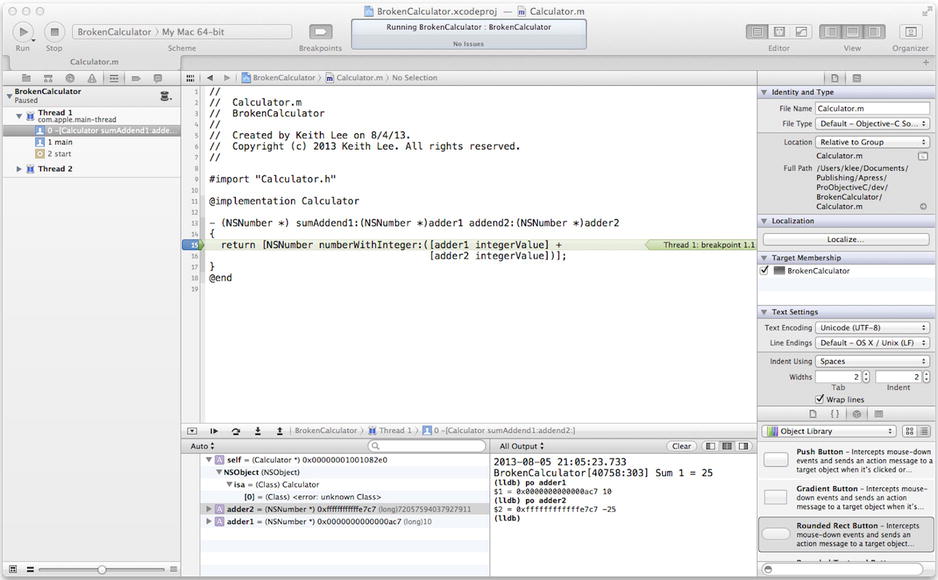
Figure C-14. Displaying the value of variables using Xcode debugger commands
These values (10, –25) are as expected, so select continue to advance the program. Next, the debugger pauses at the NSCAssert. Using the po command, the variable sum2 displays a value of –15 (as shown in Figure C-15).
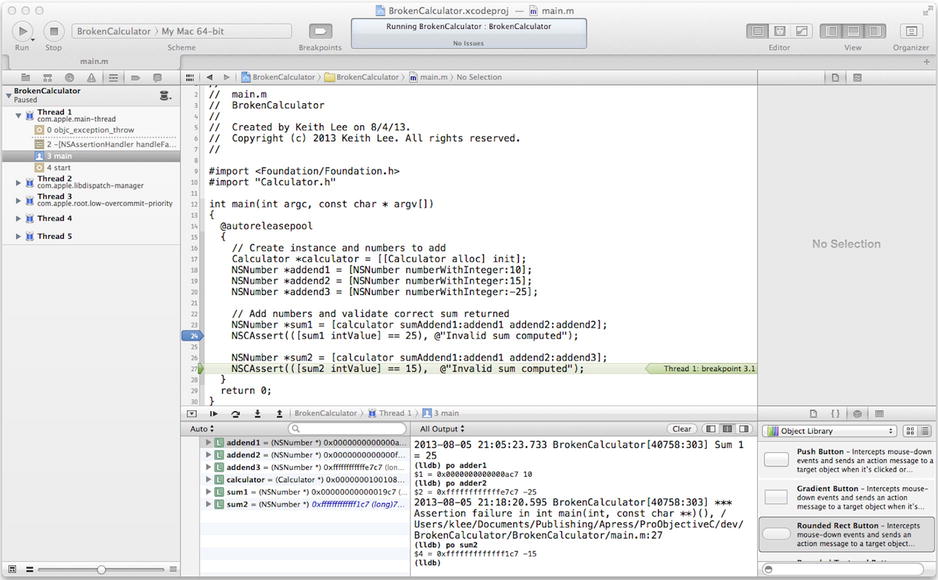
Figure C-15. Displaying a value using the po command
This is the expected value, so why is the assertion failing? Looking at the assertion statement, you can see that the conditional expression is expecting a value of 15, when it should be –15!
NSCAssert(([sum2 intValue] == 15), @"Invalid sum computed");
When you correct the assertion (by changing the value to –15) and run the program again, you will see that it runs successfully. Now even though this was a very contrived example, it illustrates a few of the capabilities of debugging in Xcode using LLDB. Apple provides a variety of documentation on Xcode debugging using LLDB, and the LLDB web site is an essential reference for more information.
In this appendix, you learned about debugging using LLDB, the default debugger for Xcode. Debugging is a mandatory part of software development, so it’s vital to master this skill to become a more efficient, productive programmer. By now I hope that you are convinced of the power and capability of LLDB, and that you will take the time to become skilled at using it on all of your Objective-C software development projects.
You have now reached the end of this book. I hope that it has been (and will continue to be) of use as you develop more OS X and iOS applications. Please feel free to contact me at [email protected] with any questions or comments about this book or about Objective-C in general. Thank you for taking part in this wonderful journey, now signing out!!