
![]()
Troubleshooting and Monitoring
Monitoring and fixing DTS (Data Translation Specification) processes are integral to the development and long-term support of your solution. There are two basic types of solutions. The first is a DTS package that is run completely within the Workbench and does not rely on MSMQ (Microsoft Message Queuing) or being run on a schedule. The second is a DTS package that has been set up within the Console as a scheduled process, also known as an Integration. Both of these use a combination of tools for troubleshooting, as outlined in this chapter.
![]() Note A Publisher (or Bridge) might be seen as an additional solution type, but since it always posts to a MSMQ and is combined with a DTS package, it really is nothing more than a query. It can be monitored using the same tools and approaches as those outlined in this chapter.
Note A Publisher (or Bridge) might be seen as an additional solution type, but since it always posts to a MSMQ and is combined with a DTS package, it really is nothing more than a query. It can be monitored using the same tools and approaches as those outlined in this chapter.
Stand-Alone DTS Packages
Monitoring the first scenario, which is a stand-alone DTS (or a string of DTS files linked together), is the easiest to troubleshoot. You can use a combination of test data, code within your Scribe DTS package, and the Execution Log in the Console or the EXECUTIONLOG table in the SCRIBEINTERNAL database to figure out the cause of your error (see the section “The Execution Log” for more details).
When troubleshooting stand-alone DTS packages, make copies of your original DTS files, and make changes to the contents of your package. For example, if you are getting an error mapping the status code values, make a copy of the DTS, and then hard-code the value of the status code field. Run the package to see if the issue is resolved. Continue to make changes until you discover the error. Once you have solved the issue, make the final changes in the original DTS package and run the process again.
Unfortunately, the options for debugging/troubleshooting are limited. You will have to get creative in how you approach DTS development. The best way to make troubleshooting easy is to keep your packages simple. A package with many steps and many transformations may look good on paper, but debugging it can be time consuming. If you can focus from the beginning on simple one-step, minimal mapping DTS files, your troubleshooting will be minimal. See Chapter 7 on approaches to keeping your solutions simple.
Scheduled DTS Packages (Integrations)
You can schedule two primary types of DTS solutions. The first is a DTS that can run end to end in either the Workbench or the Console. An example of this is a Stand-Alone (or chained) DTS package that picks up data from a database and writes it to a target application using a Scribe adapter. The second is a DTS that can only run end to end within the Console. An example of this is a set of two DTS packages: the first picks up from a SQL database and writes the output to the MSMQ, while the second picks up from the MSMQ and writes it to the target application.
Debugging the first will be the same as debugging a Stand-Alone DTS within the Workbench; you can use the Workbench itself for altering code, and you can use the Execution Log and underlying SQL tables for information on the error. The only difference between the two is that the deployed DTS has been scheduled (all DTS packages run from the workbench must be started manually). As long as the schedule itself is not causing the error (such as a database being offline during the scheduled execution window), then there is nothing but the DTS itself that could be throwing errors.
Troubleshooting a distributed DTS package, which uses the MSMQ and schemas to function in a multithreaded capacity, will require more thought on how best to debug. Take the example of two DTS files, the first picking up from a SQL table and pushing to the MSMQ and the second picking up from the MSMQ and writing to a target application (see Figure 8-1).
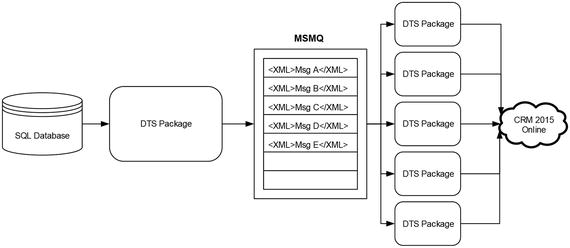
Figure 8-1. Flow of distributed integration using MSMQ
In this case, not only are there additional components beyond the DTS where issues can occur (the schemas, the MSMQ, etc.), but the DTS files themselves cannot be debugged without changes. A DTS that interacts directly with an MSMQ cannot be run successfully within the Workbench. In order to run it, you must modify the connection from reading/writing with the Queue to reading/writing to a file. The file can be an XML document that looks like what will be written to the MSMQ, but the DTS package will have to be changed to debug it. Use the following steps to debug this scenario:
- Make a copy of the first DTS package. Change the target from MSMQ to a file. This can be done by either altering the existing connection or creating a new connection of type XML that outputs to a file, as shown in Figure 8-2.
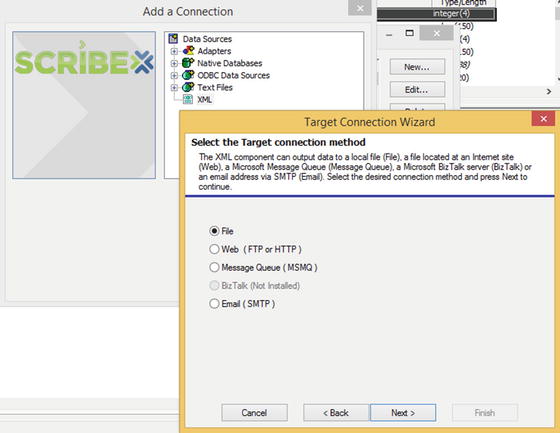
Figure 8-2. Changing output to XML file instead of MSMQ
 Note As an alternative to Steps 1 through 3, which use the DTS package to create an XML document, you can open up an actual XML instance via the Scribe Queue Browser and copy that XML into a file which can be used as the source of Step 4. This, of course, requires that a valid instance of the XML exists in the queue.
 - Modify the query on the DTS package to retrieve a single record. If you know the record that is causing the error, then you can alter your SELECT statement to get only that record, based on ID or other criteria. The goal is to select a single record so that a single XML file is written out.
- Run this DTS package, and note where the XML file is output to. You will use this XML as the source to the second DTS.
- Open the second DTS file, which reads from the MSMQ, and change it to read from an XML file as the source. Again, this can be done by creating a new connection (or altering the existing one) of type XML. Set this source XML to the file that was output in Step 3.
- You can now test the second DTS package. Reading from the XML file simulates picking up data from the MSMQ. You can change data in the source XML document to experiment with different values and to troubleshoot your DTS.
The outcome of these steps is a streamlined file-based solution, as shown in Figure 8-3. In this solution, the DTS packages write to and read from an XML file rather than interacting with the MSMQ, which allows greater control for debugging and troubleshooting purposes.
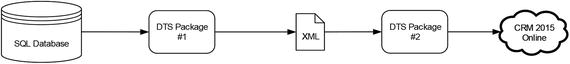
Figure 8-3. Using single XML file flow for simplified troubleshooting
There are a number of options to troubleshooting your DTS packages. Most of them require some level of creativity on the developer’s part to figure out how best to approach this troubleshooting. You will need to think about how to debug while you are writing your DTS packages, and be planning from the start how you will support and maintain your solutions. Keep your DTS files simple, and your troubleshooting will be simple.
Tools for Troubleshooting
This section outlines the key tools that are available within Scribe for troubleshooting. Some of these, like the Queue Browser, will only be of value if you have a DTS solution that uses the MSMQ. Others, like the Data Views, you will likely use only once or twice, as they have little relevance to most developers. The most common tool, which is available for every solution, is the Execution Log and the underlying SQL tables in the SCRIBEINTERNAL database.
For solutions that use MSMQ (which should be anything that has a high number of records and multithreading requirements), the Queue Browser will be a common place to check on the health and status of your solutions. Located under the Integration server folder of the Scribe Console, it allows you to view the contents of the three key Scribe queues (additional ones can be configured). Chapters 6 and 7 deal with using MSMQ, and they discuss how to look for records in the queue.
Once items are in the queue, there is no ability to sort or search the queues within the Scribe Console itself. If you need advanced functionality for finding records, you can work directly with the queue via a custom .NET application or other third-party tool. When dealing with thousands or hundreds of thousands of records—which can be typical in a migration scenario—it is imperative that you have the ability to see what you are passing through your system. You may need to plan for some extra development time in your project to account for working with data in the queues, as troubleshooting data once it is in the queue can be tedious, time consuming, and largely ineffective if just using the Scribe Queue Browser.
The Execution Log
You can view the execution logs and reports from the Scribe Console, as shown in Figure 8-4. This log viewer can be accessed in the Console by clicking Execution Log under the Administration folder. Tabs provide for a variety of filters to be applied to the reports. Once the report is run, results will be displayed. Each result can be double-clicked in order to get more detail. In Figure 8-5, you can see the full details behind a specific error line item.
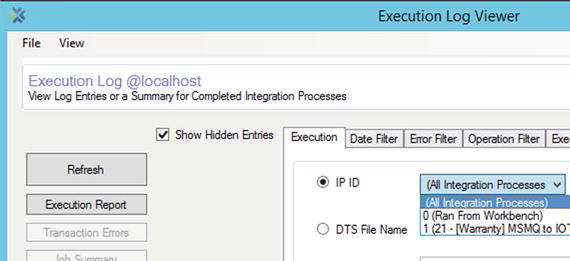
Figure 8-4. Filtering results on the Execution Log Viewer
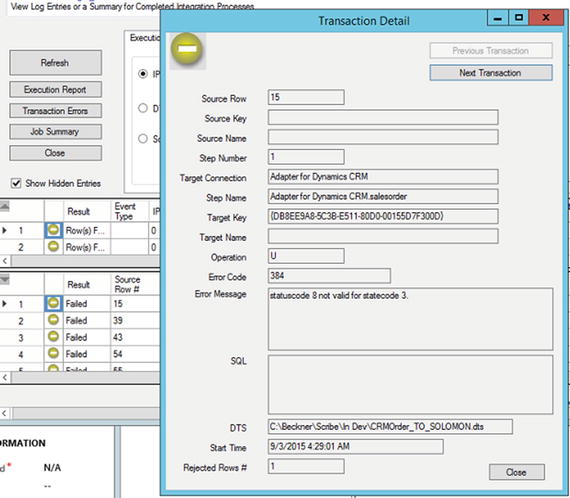
Figure 8-5. Full details behind the log entry
While there is a lot of functionality within the user interface to allow different filtering of data in the reports, you will find getting the results you are interested in via this view can be far more time consuming and complex than it should be. In general, the easiest way to view exceptions is to work with the underlying SQL data directly. The query shown in Listing 8-1 shows how to query the transaction logs using SQL (you will need to run this query from SQL Management Studio).
In the example shown in Figure 8-6, you can see that the actual error produced is shown in the ERRORMESSAGE column. In addition, the row number that encountered the error is shown in the REJECTEDROWNUMBER record. If you have ordered your source result set, then you should be able to trace this REJECTEDROWNUMBER back to a specific record.
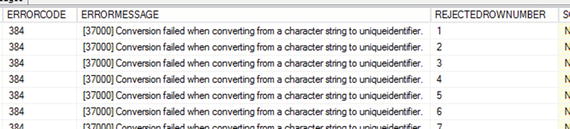
Figure 8-6. The ERRORMESSAGE column contains full error message
![]() Note Always order your source results with an ORDER BY clause. This will ensure that your result set is always in the same order. When you have an error, you will quickly be able to tie the REJECTEDROWNUMBER value back to a specific result in your source data. This is particularly useful with large data sets. If you are processing 50K records, and there are ten errors, you can quickly find the ten that failed, address the issue, and reprocess only those ten records (by modifying the source query to get only those records).
Note Always order your source results with an ORDER BY clause. This will ensure that your result set is always in the same order. When you have an error, you will quickly be able to tie the REJECTEDROWNUMBER value back to a specific result in your source data. This is particularly useful with large data sets. If you are processing 50K records, and there are ten errors, you can quickly find the ten that failed, address the issue, and reprocess only those ten records (by modifying the source query to get only those records).
The Alert Log
The Alert Log resides just below the Execution Log, under the Administration folder in the Console, as shown in Figure 8-7. It is a filtered version of what appears in the Windows Event Log, displaying only data related to Scribe. There is some functionality around filtering that may be of use in troubleshooting.
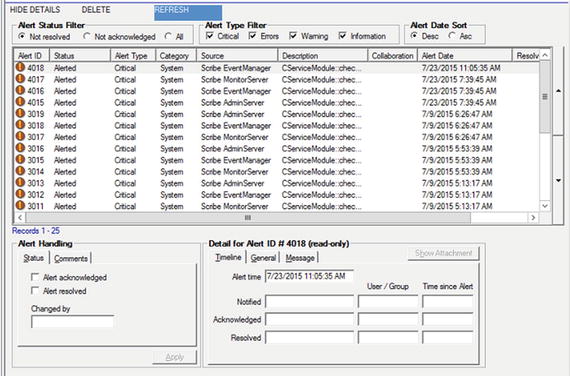
Figure 8-7. The Alert Log—another view into the Windows Event Log
![]() Note Given that the Alert Log is just another view into the Windows Event Log, you will likely want to simply open up the Event Log so that it is in a separate window and easily referenced.
Note Given that the Alert Log is just another view into the Windows Event Log, you will likely want to simply open up the Event Log so that it is in a separate window and easily referenced.
There are several reports that provide roll-up information about alerts and traffic on the Scribe server. These have limited value to an administrator or developer, but they might be fun to look at once in a while. You can access these in the Console under the Administration folder. All reports reside within the Data Views folder. Click this folder and select the report from the right-hand pane. Figure 8-8 shows an example of the Alert Counts by Type report.
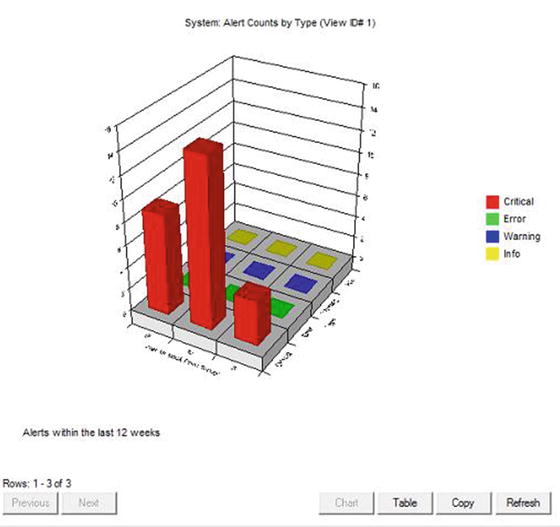
Figure 8-8. Chart reports available for monitoring in Data Views
Monitors can be set up to keep track of system and integration errors. Setting up a monitor will cause alerts to be raised when conditions are met. These alerts can be set up to notify recipients when they occur. You can set up Alert Recipients (see next section) and configure the notification settings. Monitors take a few minutes to configure and can bring peace of mind to administrators who require proactive notifications for production systems.
![]() Note While setting up monitors for autonotification is of some value, you will want to check the health of your Scribe server directly on a daily (or more frequent) basis. If services are disabled, or notifications are not being sent, then you have no way of knowing unless you are logging into the server.
Note While setting up monitors for autonotification is of some value, you will want to check the health of your Scribe server directly on a daily (or more frequent) basis. If services are disabled, or notifications are not being sent, then you have no way of knowing unless you are logging into the server.
Setting up a monitor can be done in the Console under the Integration server folder. There are several types of monitors, including Query and Queue monitors. The Query monitor is available for all types of solutions, and it lets you validate the results of source data. As outlined in Figure 8-9, you can see that the monitor can look at total row count and specific field values.
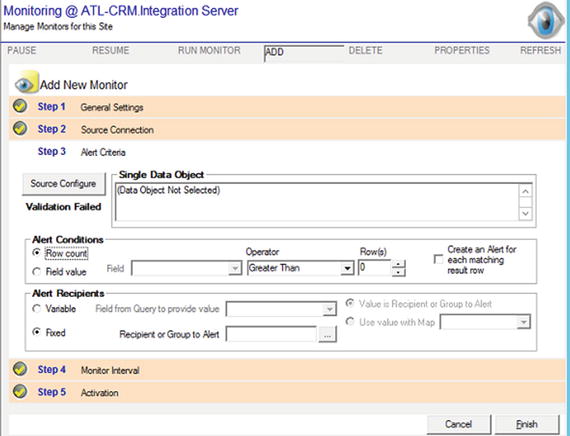
Figure 8-9. Specifying what to monitor on a query
Alert Recipients
You can set up recipients to receive notification when certain events occur within Scribe. These events include Critical Alerts (found in the Alert Log) and events set up within an Integration Process or a Monitor. The Alert Recipients configuration occurs within the Console, under the Administration folder, and allows for the specification of users and notification types. Setting up a user to be notified by e-mail can be done on the Recipients tab, as shown in Figure 8-10.
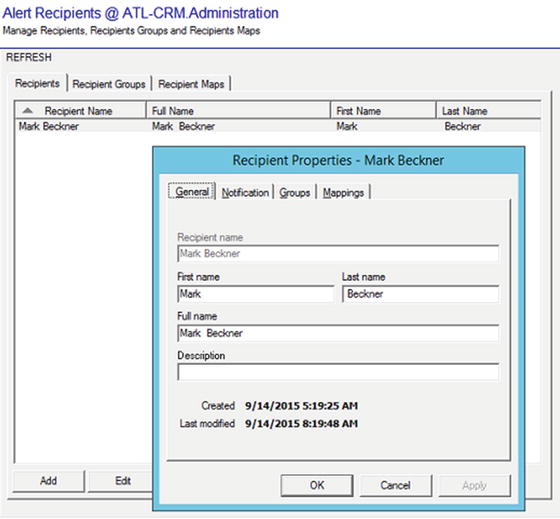
Figure 8-10. Defining an Alert Recipient
Conclusion
There are a number of tools that will allow for troubleshooting and monitoring solutions, but Scribe does not offer a lot of advanced options for debugging. Becoming familiar with the different tools in the Scribe Console is important, but the most important aspect to effective troubleshooting is ensuring that your source data is ordered and easy to query and view, so that record numbers align with what is in the underlying SCRIBEINTERAL tables related to executions. Advanced developers will find that testing within the Scribe Workbench and working directly with the SQL components is the most efficient way to work through and resolve errors.