You have already completed two parts of this book. In the next two parts, you will learn about more complicated topics, such as dealing with conditions and loops. So that you properly understand these topics, in this chapter I will cover some tools that can be of great help to you in your programming.
IntelliSense
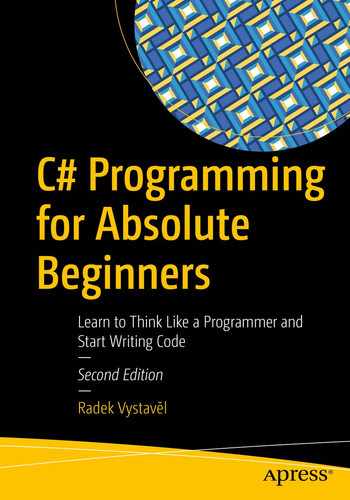
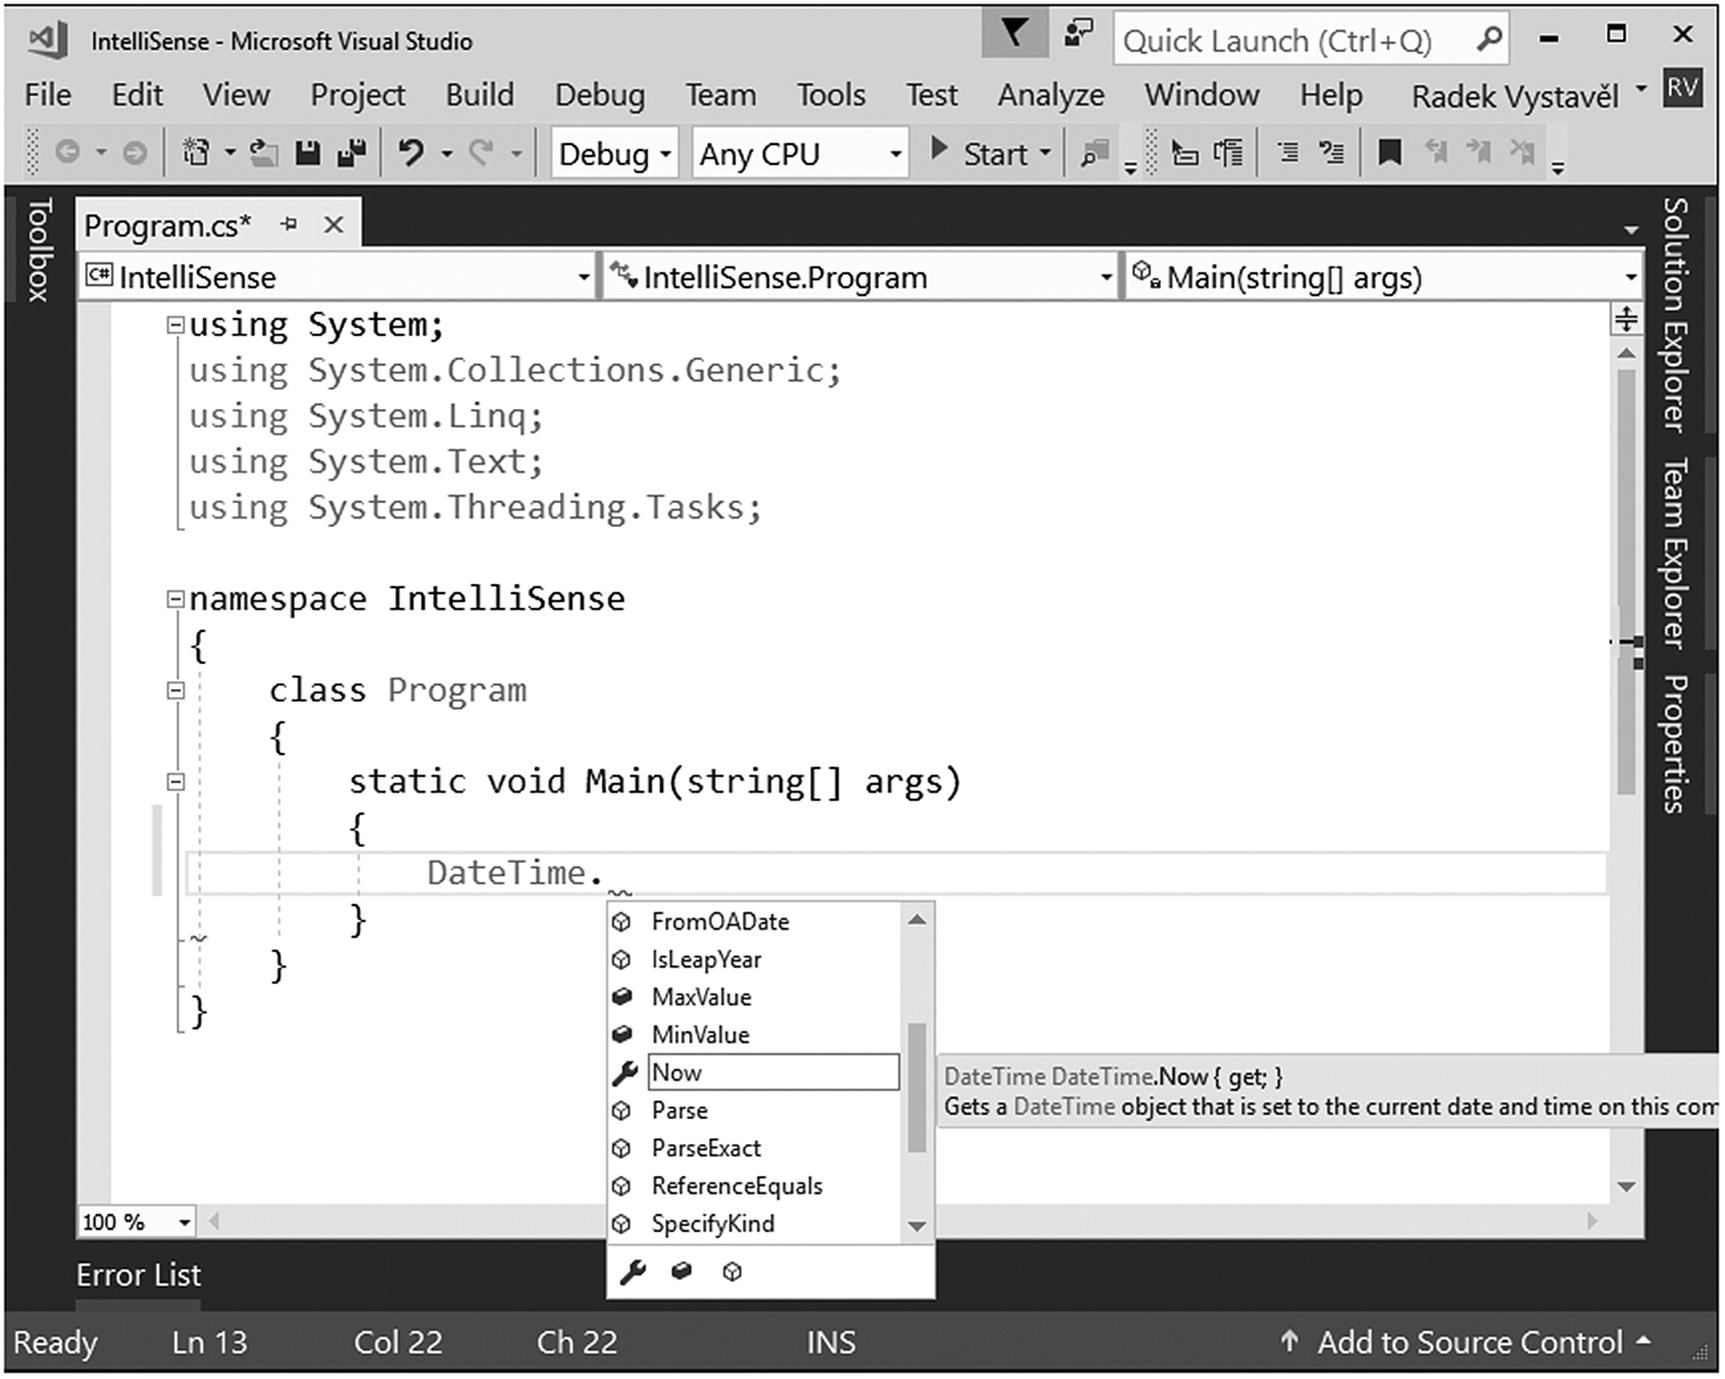
You know the first tool I will cover: Visual Studio IntelliSense. Whenever you start typing anything, Visual Studio immediately offers you options for completing the text. When you choose one of the options, the development environment shows you further details about the option in a tooltip—what the option does, what parameters it requires, and so on.
I am covering IntelliSense in this chapter because it is often underused by beginning programmers. I recommend you get used to completing virtually every word you type using IntelliSense. You will spare yourself of a huge number of typos.
Exploring the Possibilities
Using IntelliSense is also a way to explore all the possibilities that every contemporary computing platform offers.
In former days, you had to study the possibilities in manuals or books. Some of them were capable enough to cover almost all the questions a programmer had. Today, however, there are so many possibilities that even a 1000-page book cannot show them all.
You still need books (definitely this one!) to give you reliable and systematic instruction so you can understand the principles, but you will probably want to explore further possibilities not mentioned there. IntelliSense is a tool that can show you many of them.
Examples
Entering a variable name and a dot
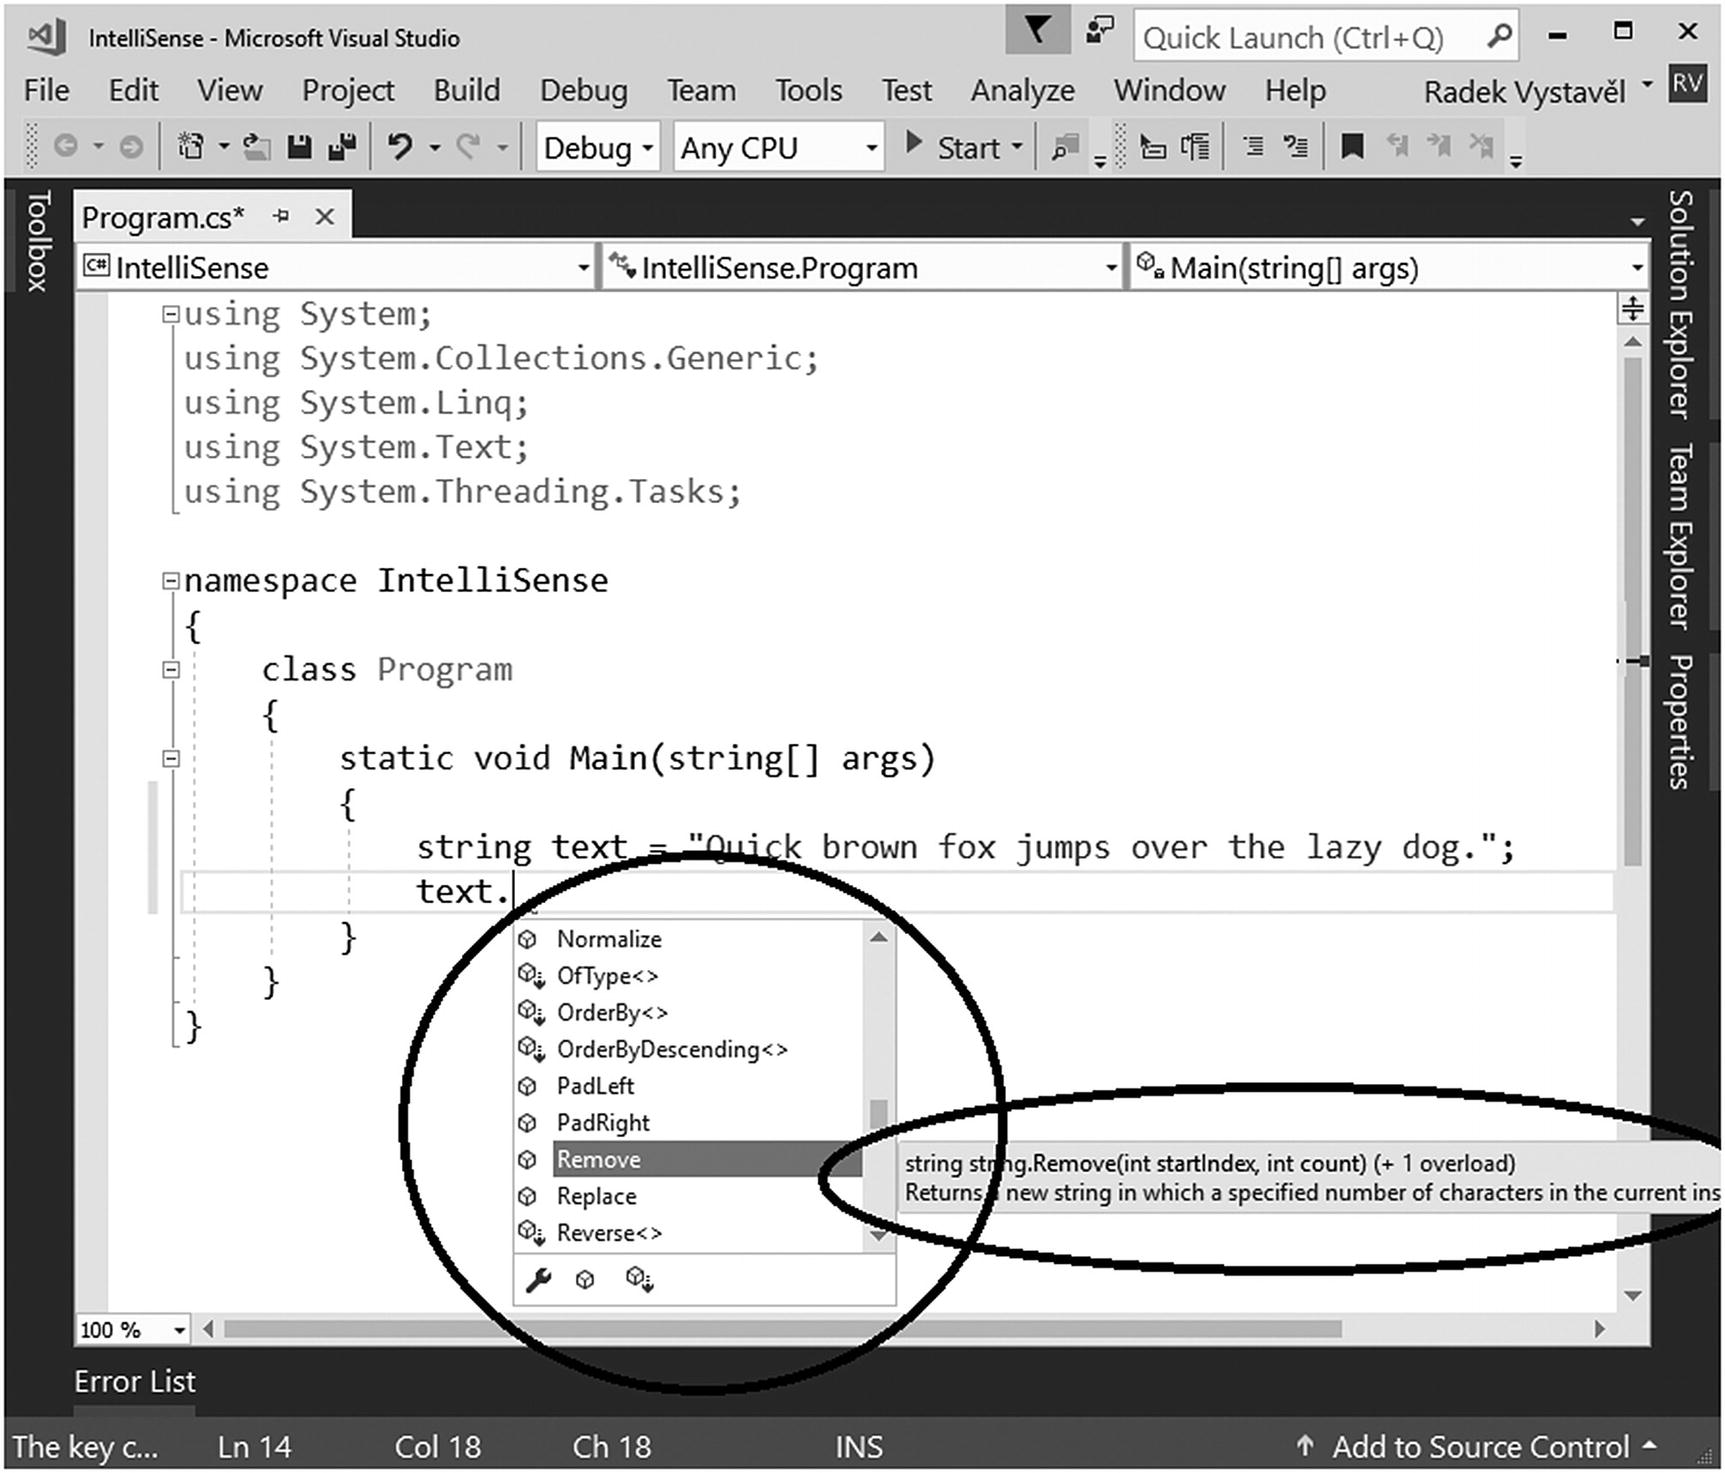
Entering a data type and a dot
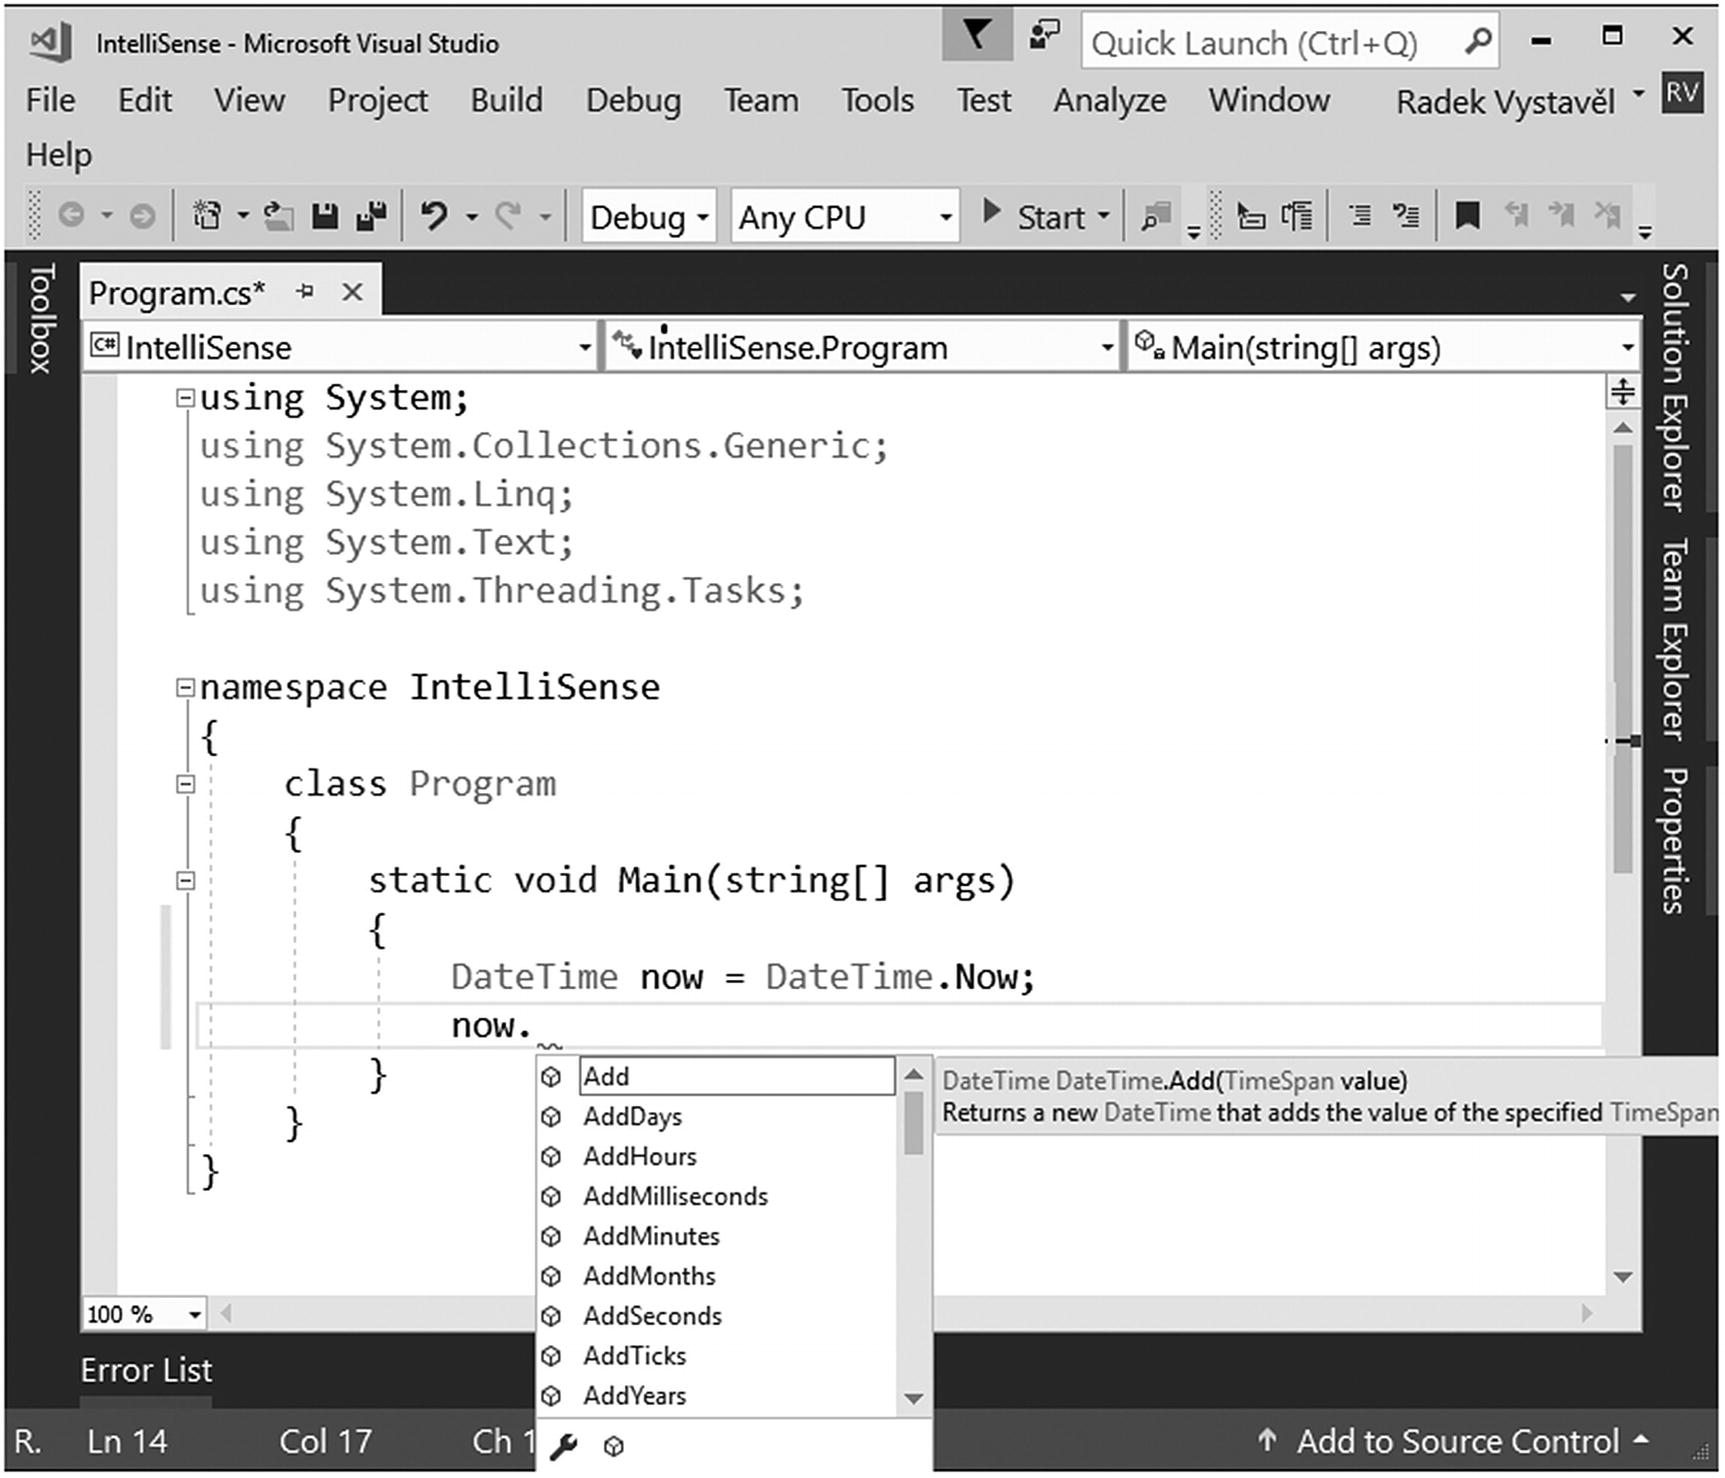
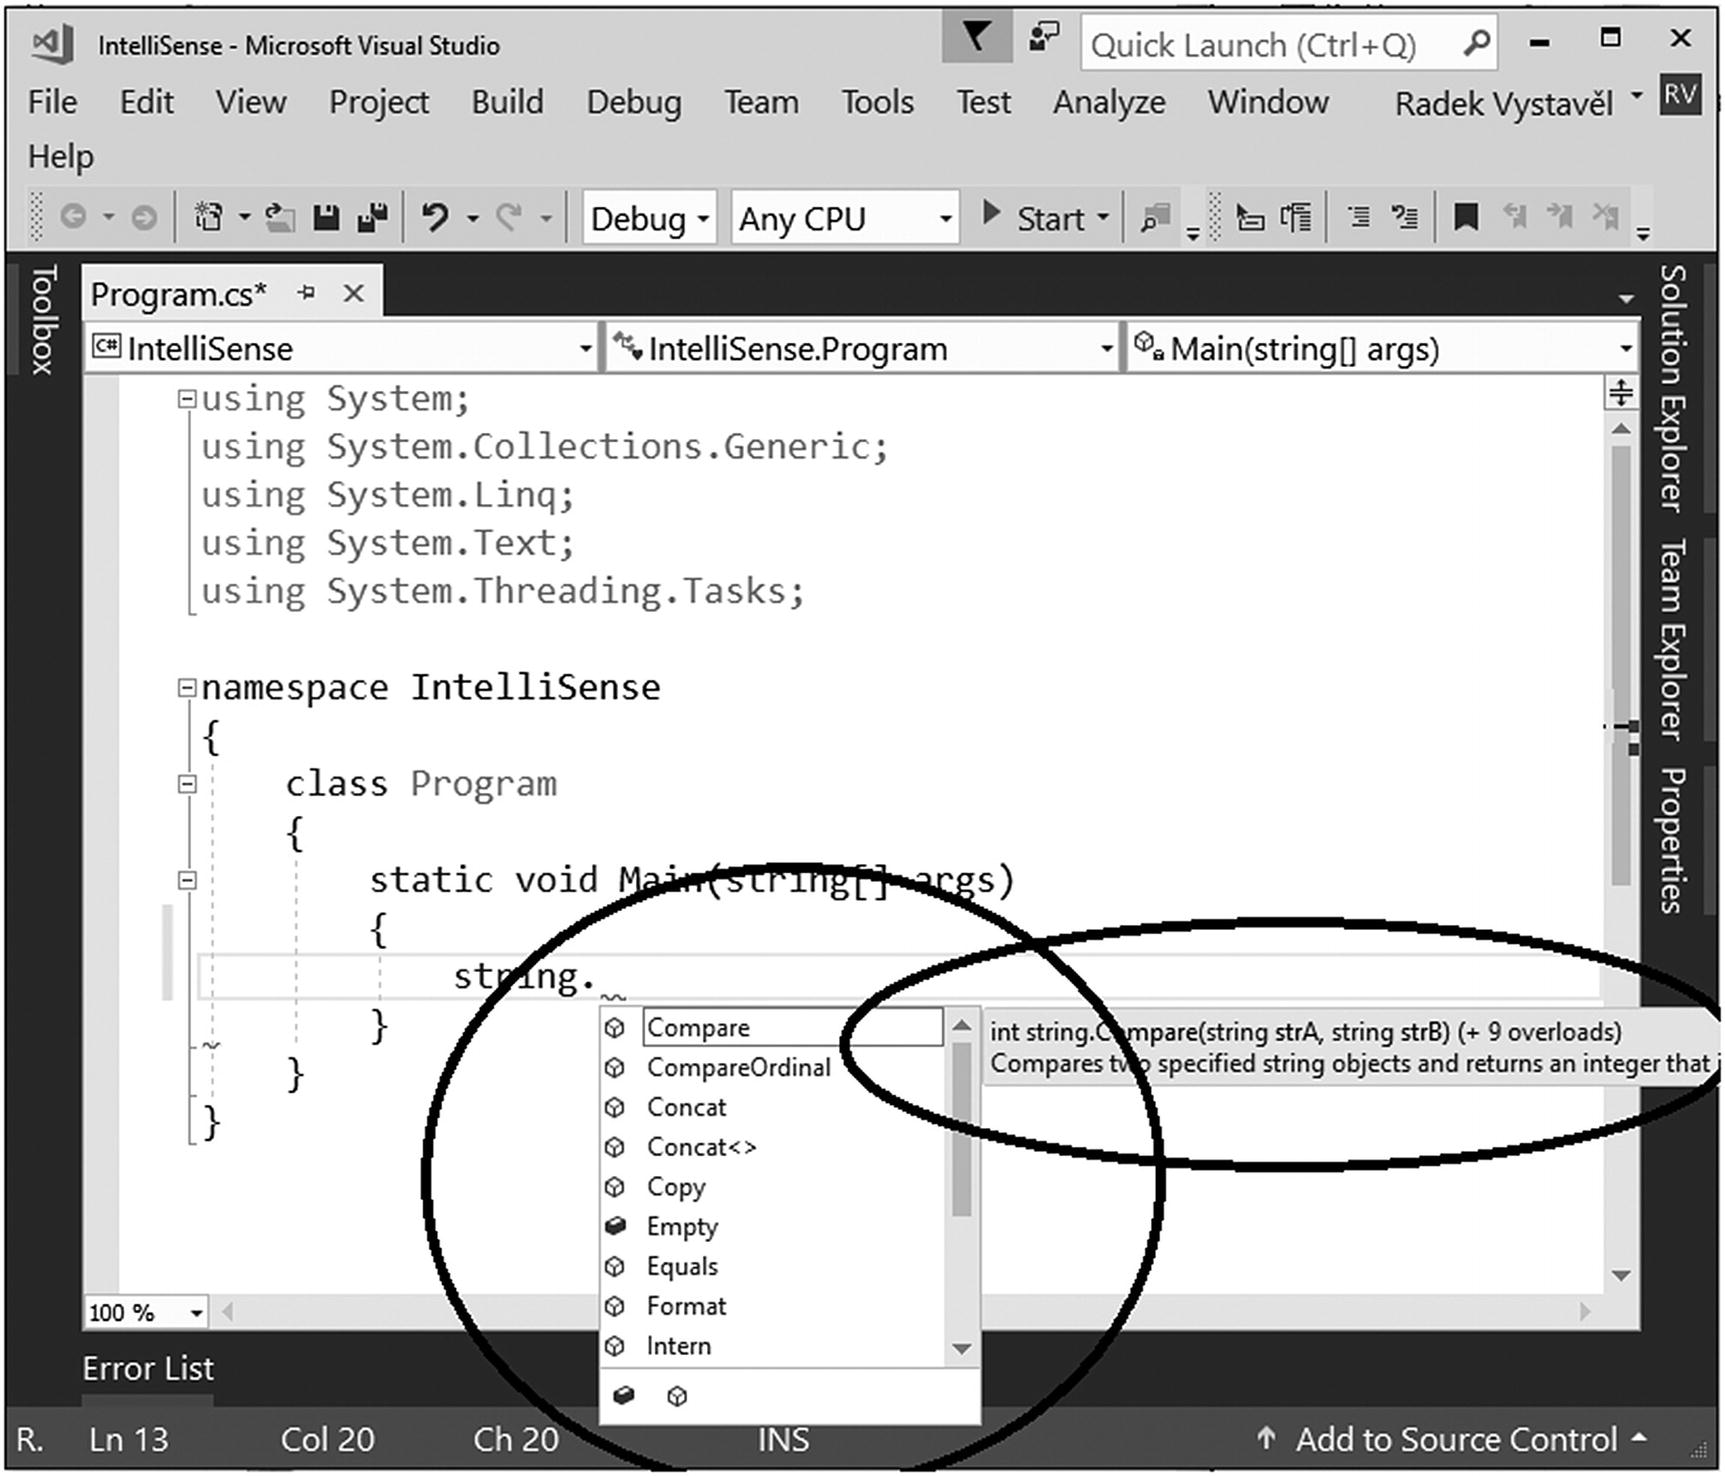
Entering DateTime and a dot
Getting some tips from IntelliSense
Note
The list of possibilities that IntelliSense offers you can be narrowed down using the icons at the bottom of the list. Click an appropriate icon if you want to see just properties, just methods, and so on.
Keyboard Shortcuts
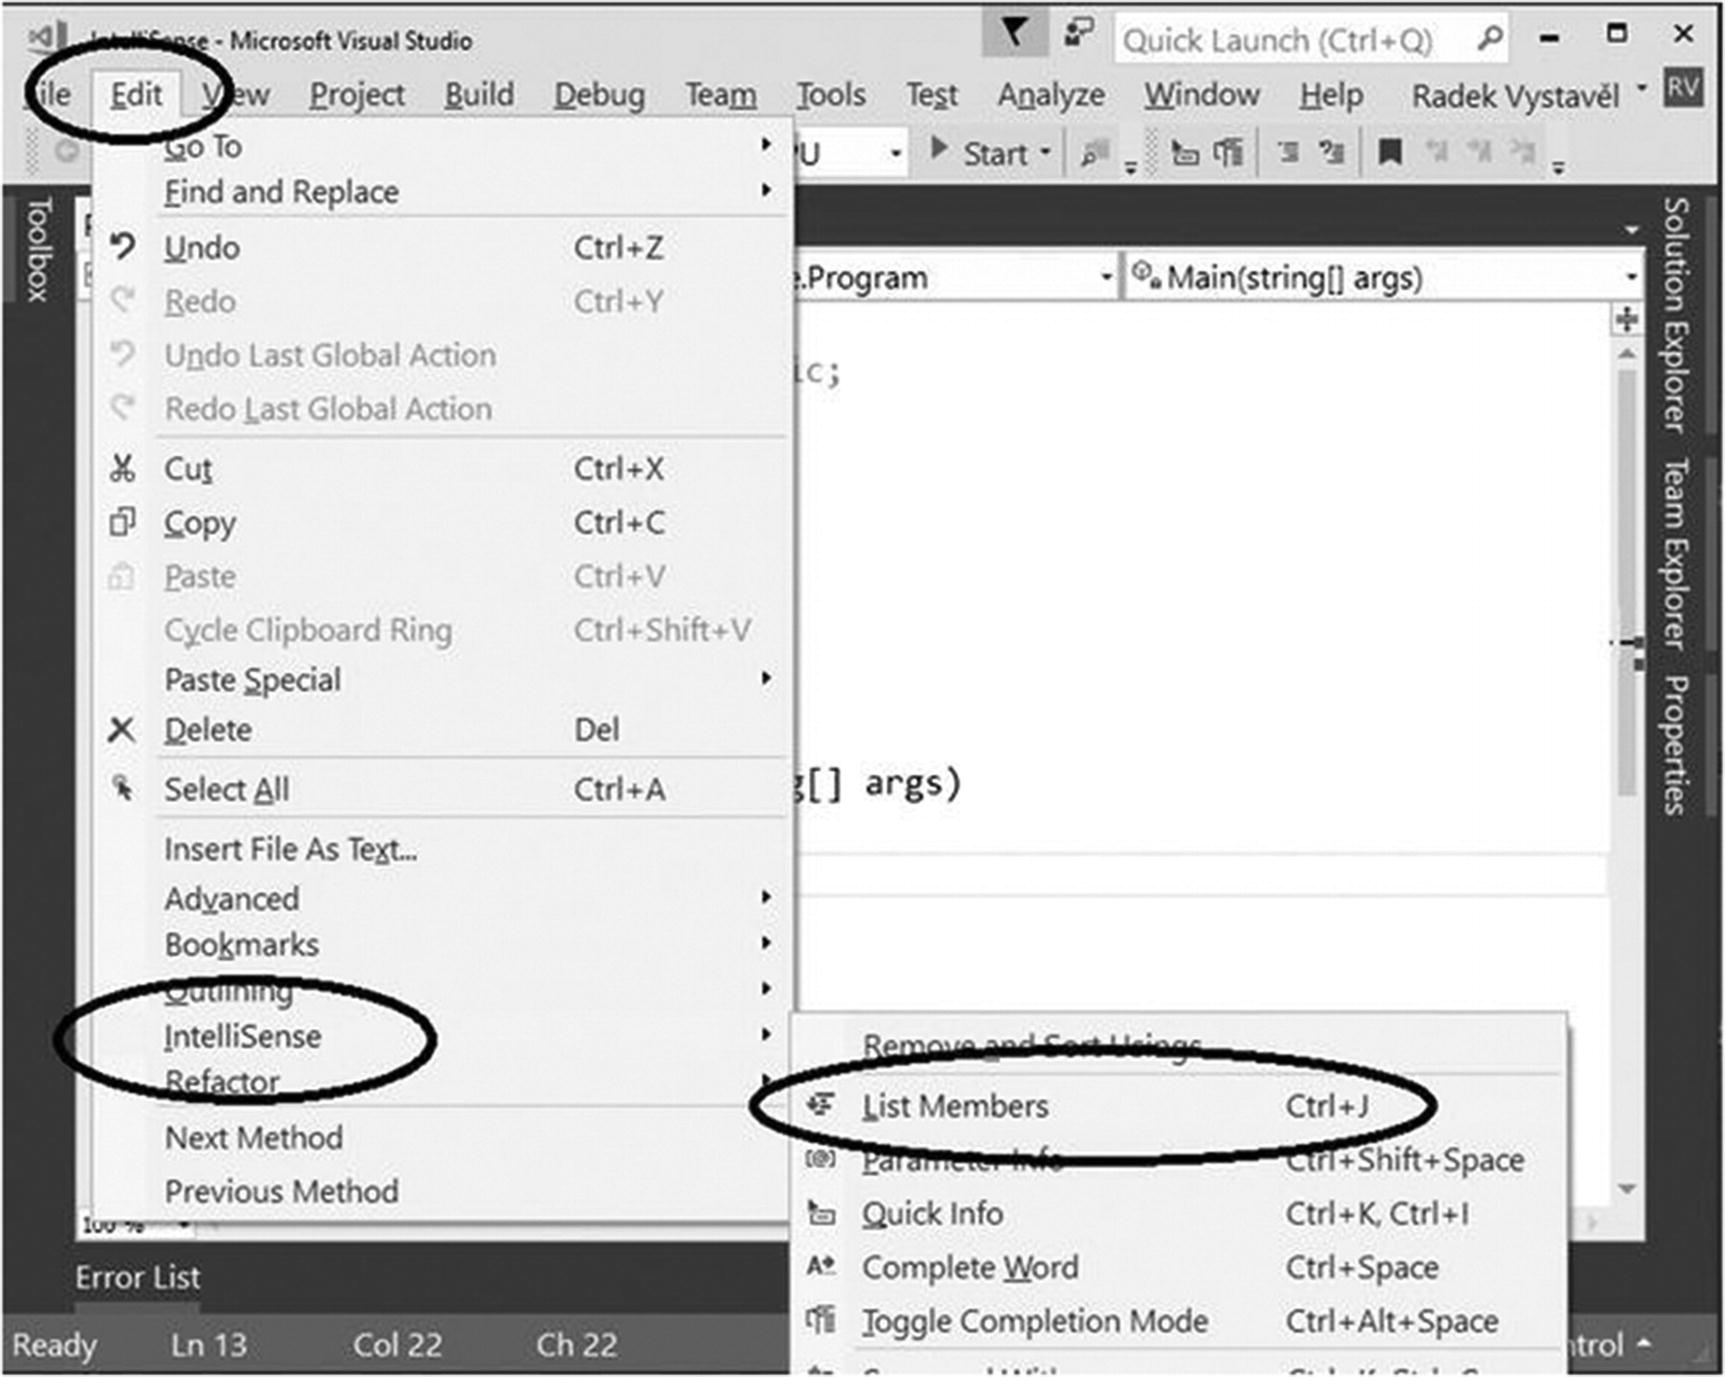
Shortcut for List Members
Documentation
IntelliSense can give you many tips. It can also show you the basic usage of the feature you search for. However, the place where you can find all the detailed information is the online documentation.
docs.microsoft.com
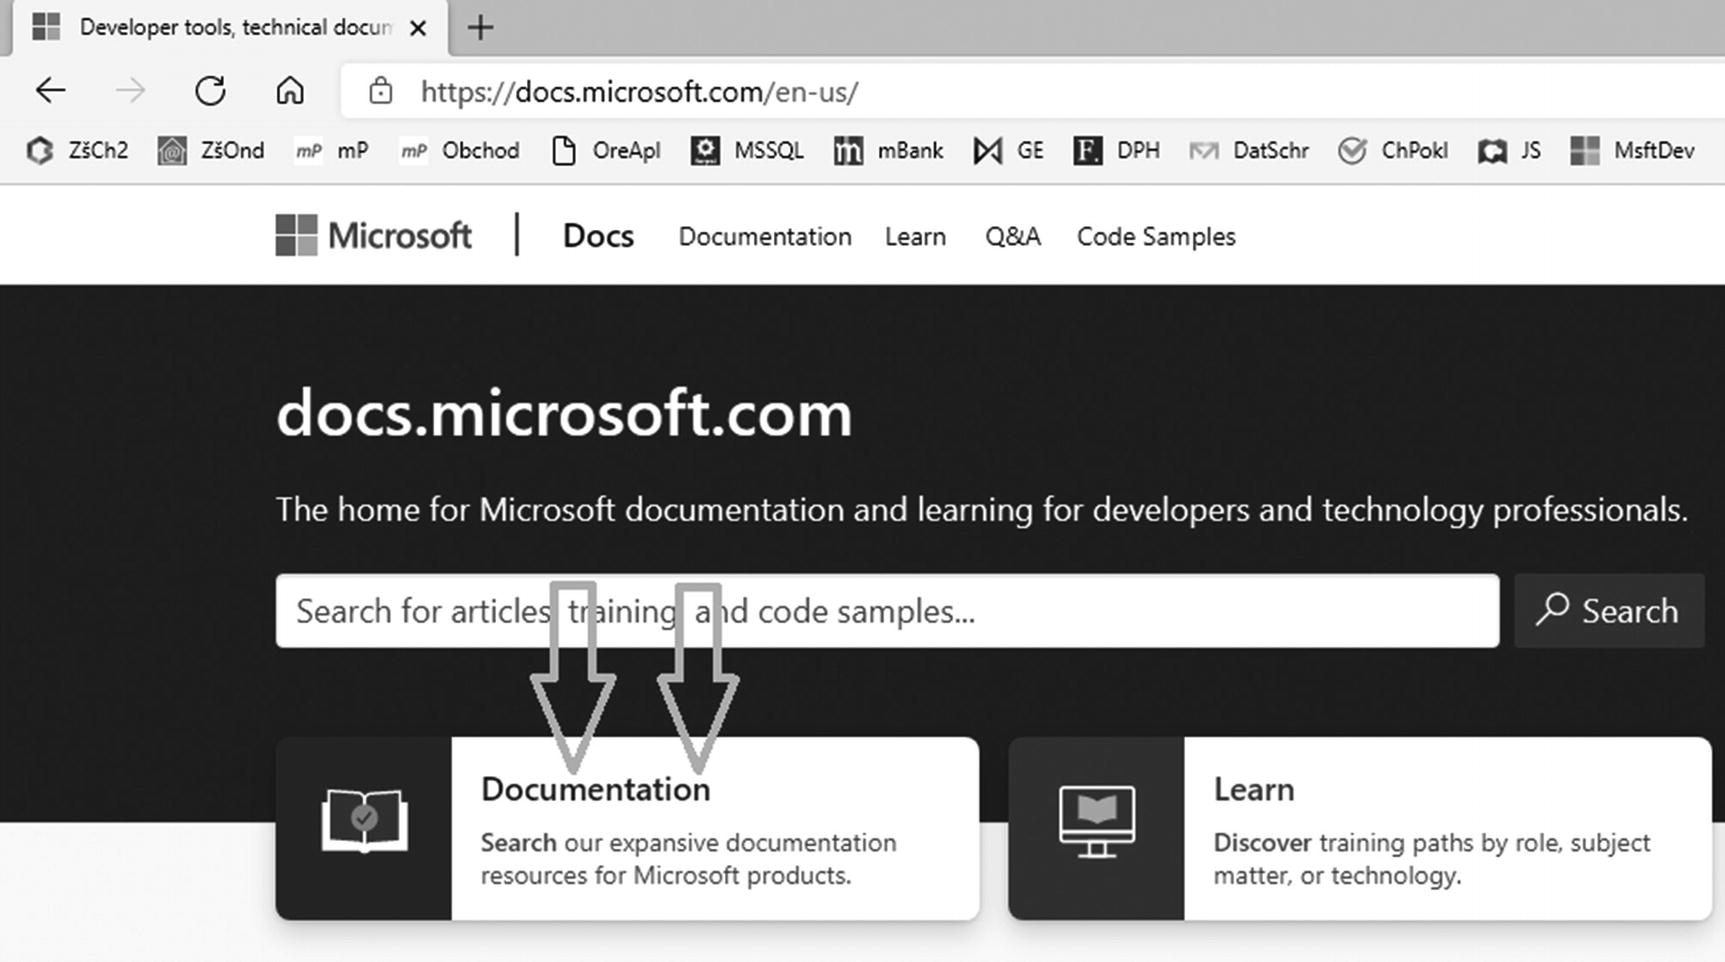
Microsoft documentation
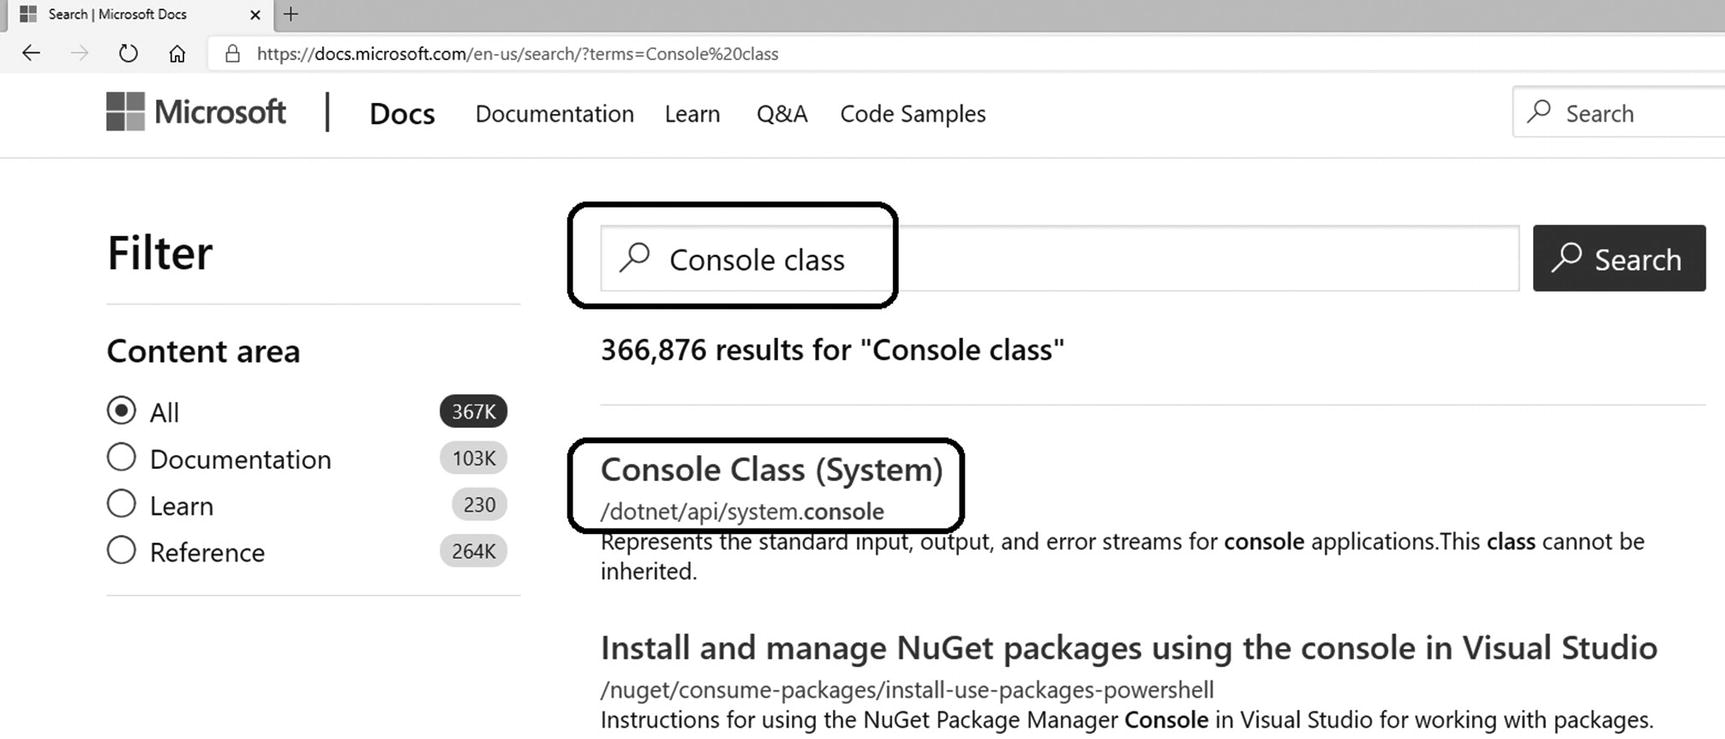
Search
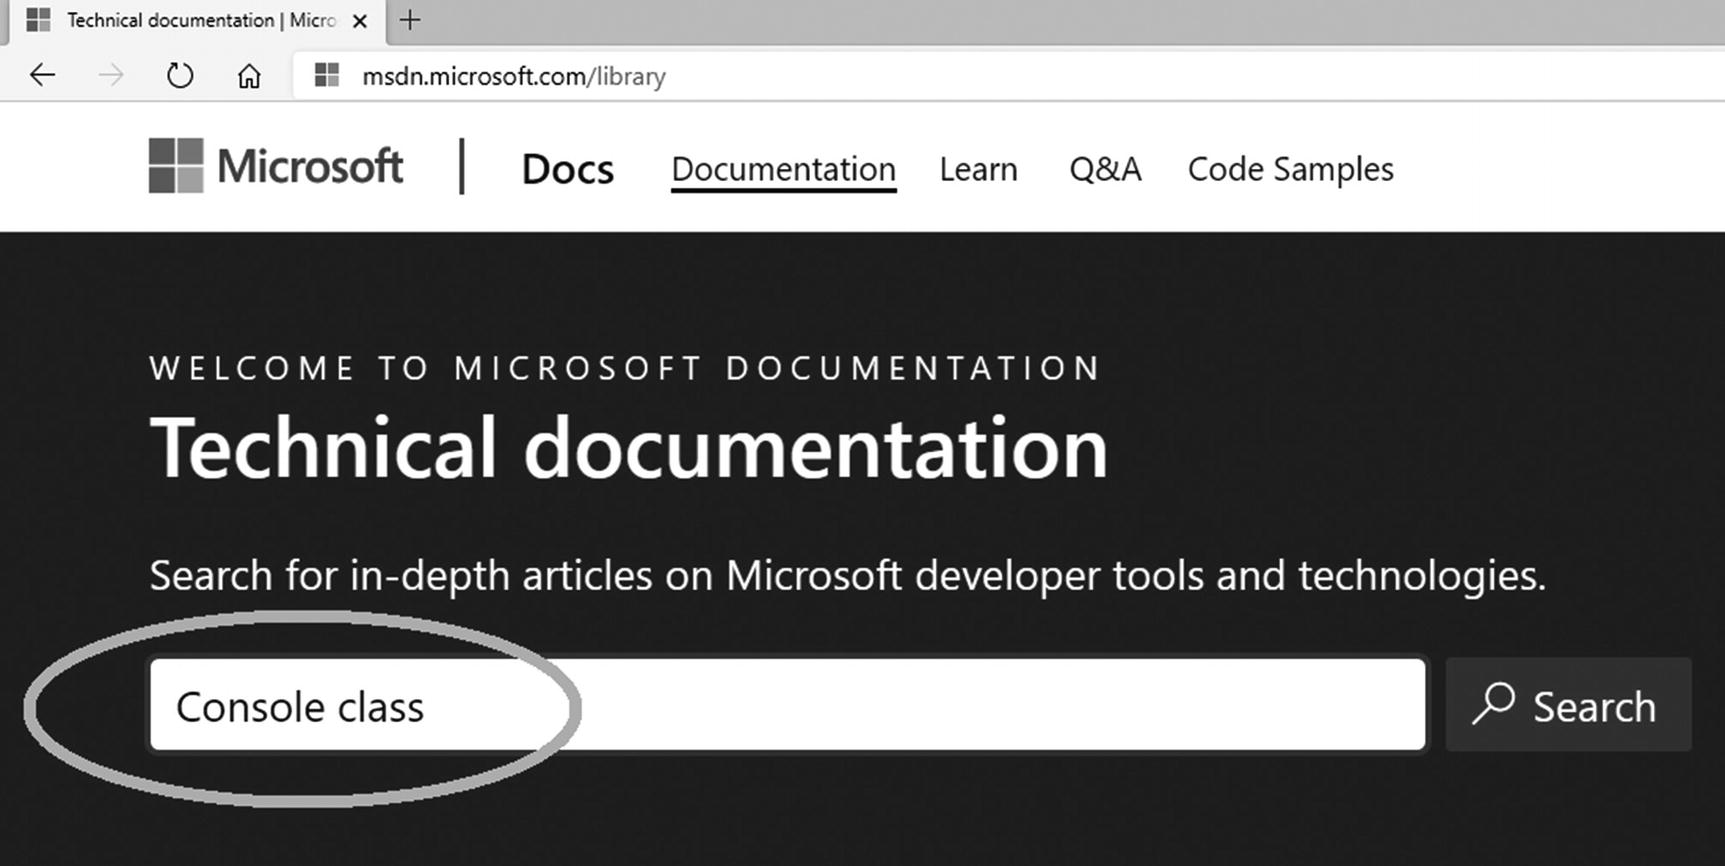
Searching for “Console class”
Viewing documentation for “Console class”
Specific Class Page
After clicking the correct link, you will find all the things about a specific class, such as Console in this example.
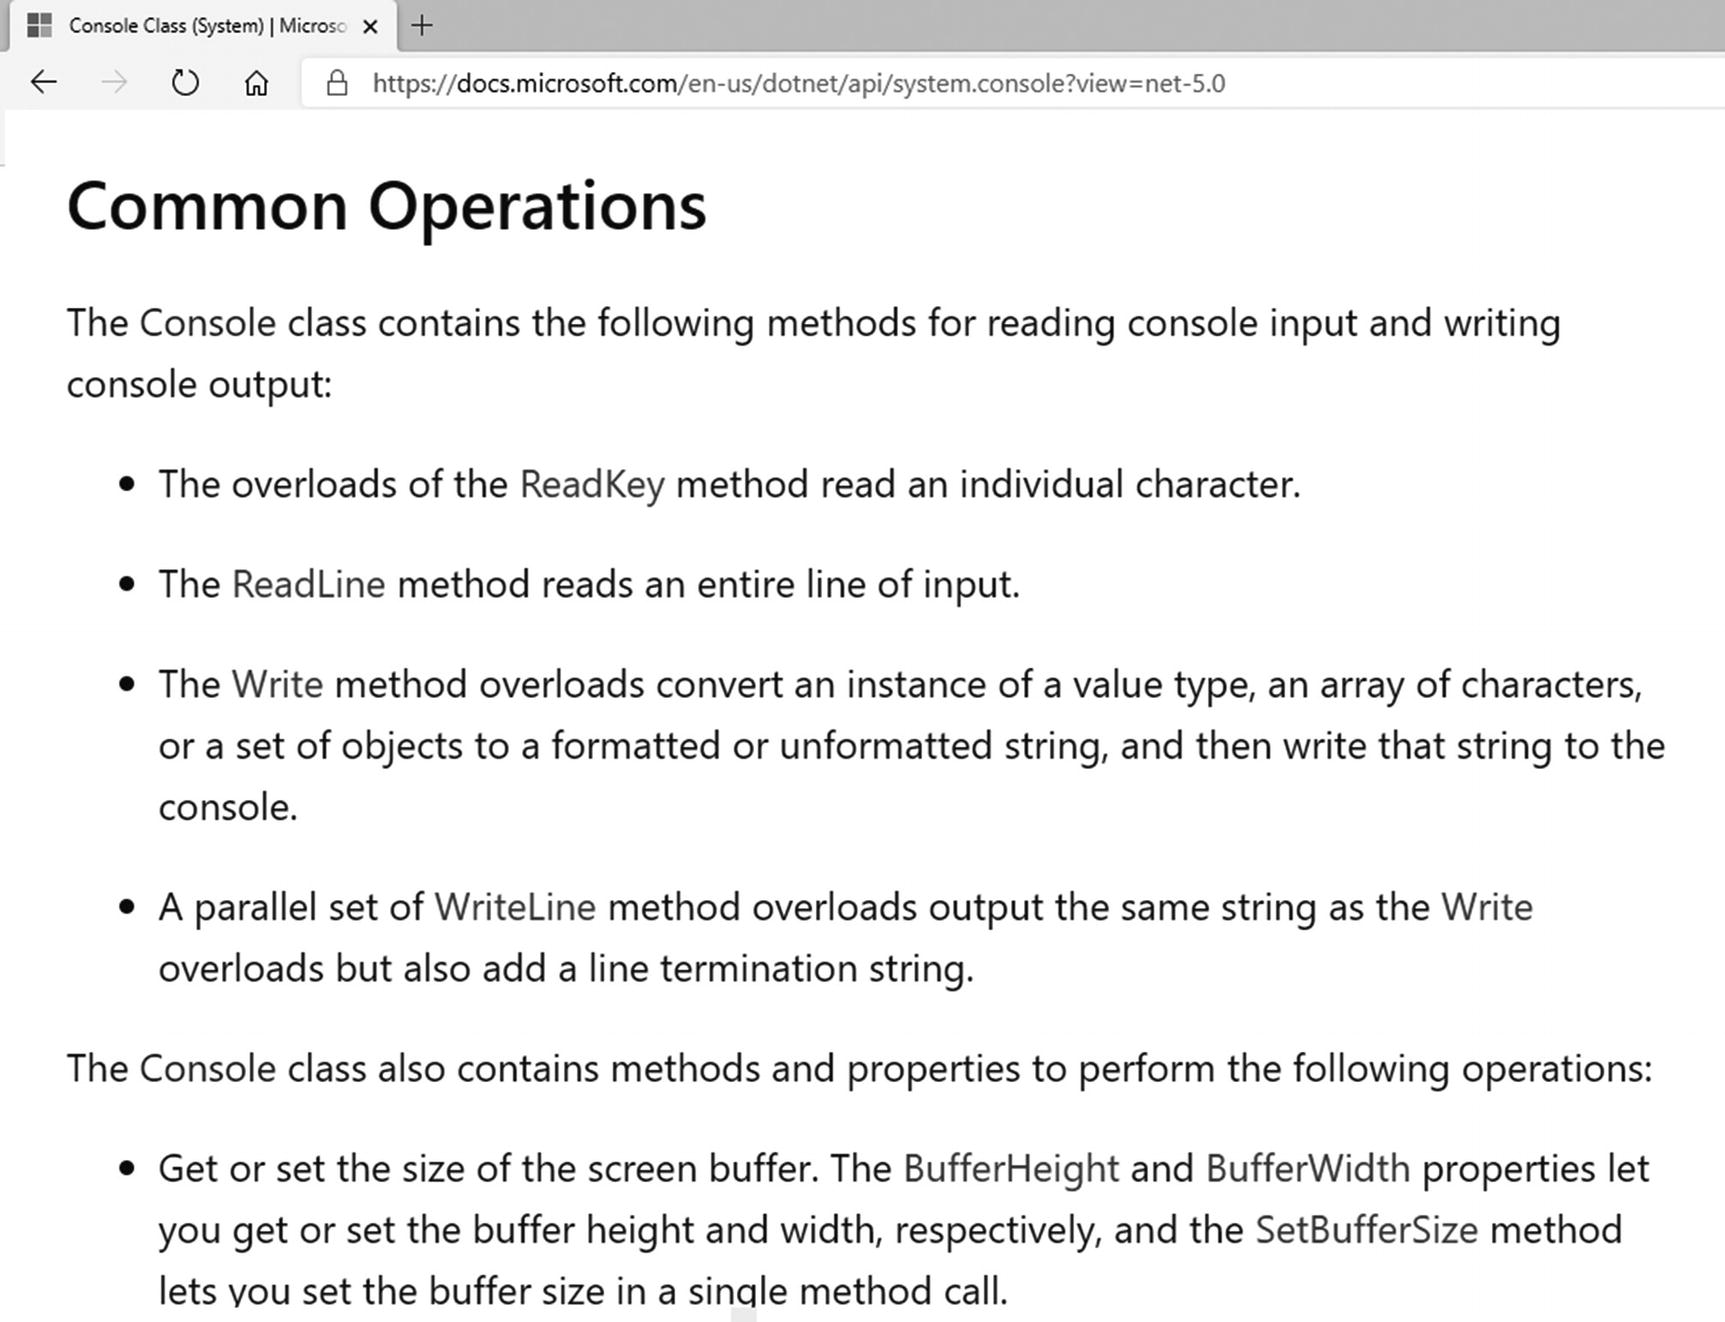
Getting introductory information in the Common Operations section
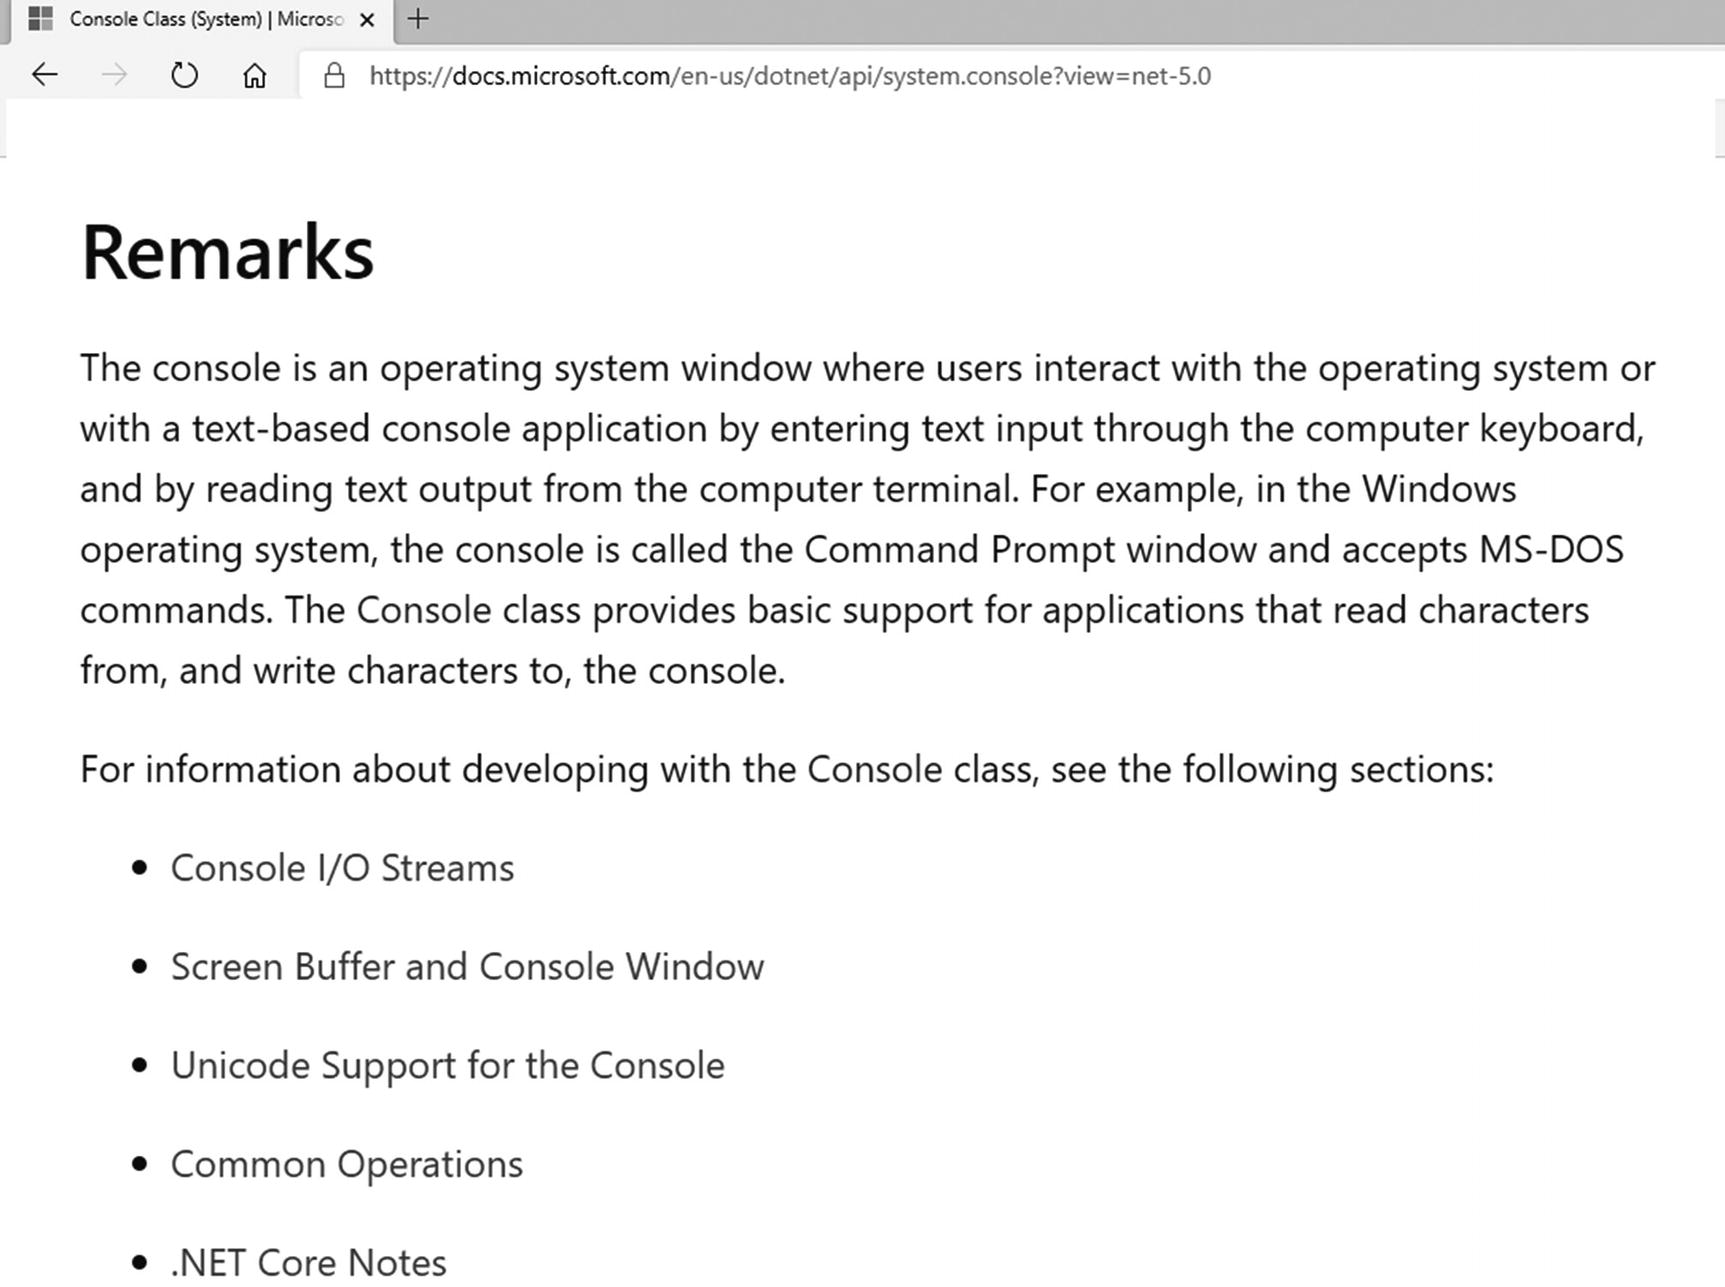
Getting more details in the Remarks section
Common Search
To conclude this section about documentation, note that you can perform your searches outside of the Microsoft documentation site, too. Simply use your favorite web browser to search.
However, contrary to a documentation site search, a common search displays irrelevant results more frequently. To compensate for this, you can refine your query using the programming language name, such as entering Console class C# in your favorite web browser’s search field.
Debugging Tools
Besides IntelliSense and documentation, there are other tools that you are going to find helpful. Specifically, you can use debugging tools that allow you to look inside a computer, so to speak. You can use them to see how the computer executes individual commands, what values are stored in memory, and so on.
These are the tools you are going to study now. Originally, they were developed to facilitate program debugging, in other words, searching for and removing errors. However, they are probably even more useful as illustrative tools to facilitate your understanding of various programming constructions.
Project
It is best to try all the tools in practice, so please open the “Treating incorrect input” project in Visual Studio from Chapter 8. The program adds two numbers and treats possible input errors using try-catch.
Stepping Through the Code
A computer works so fast that it is impossible to follow it with its gigahertz speed. That is why it’s often helpful to step through the code, which forces the computer to execute one statement at a time, upon your command.
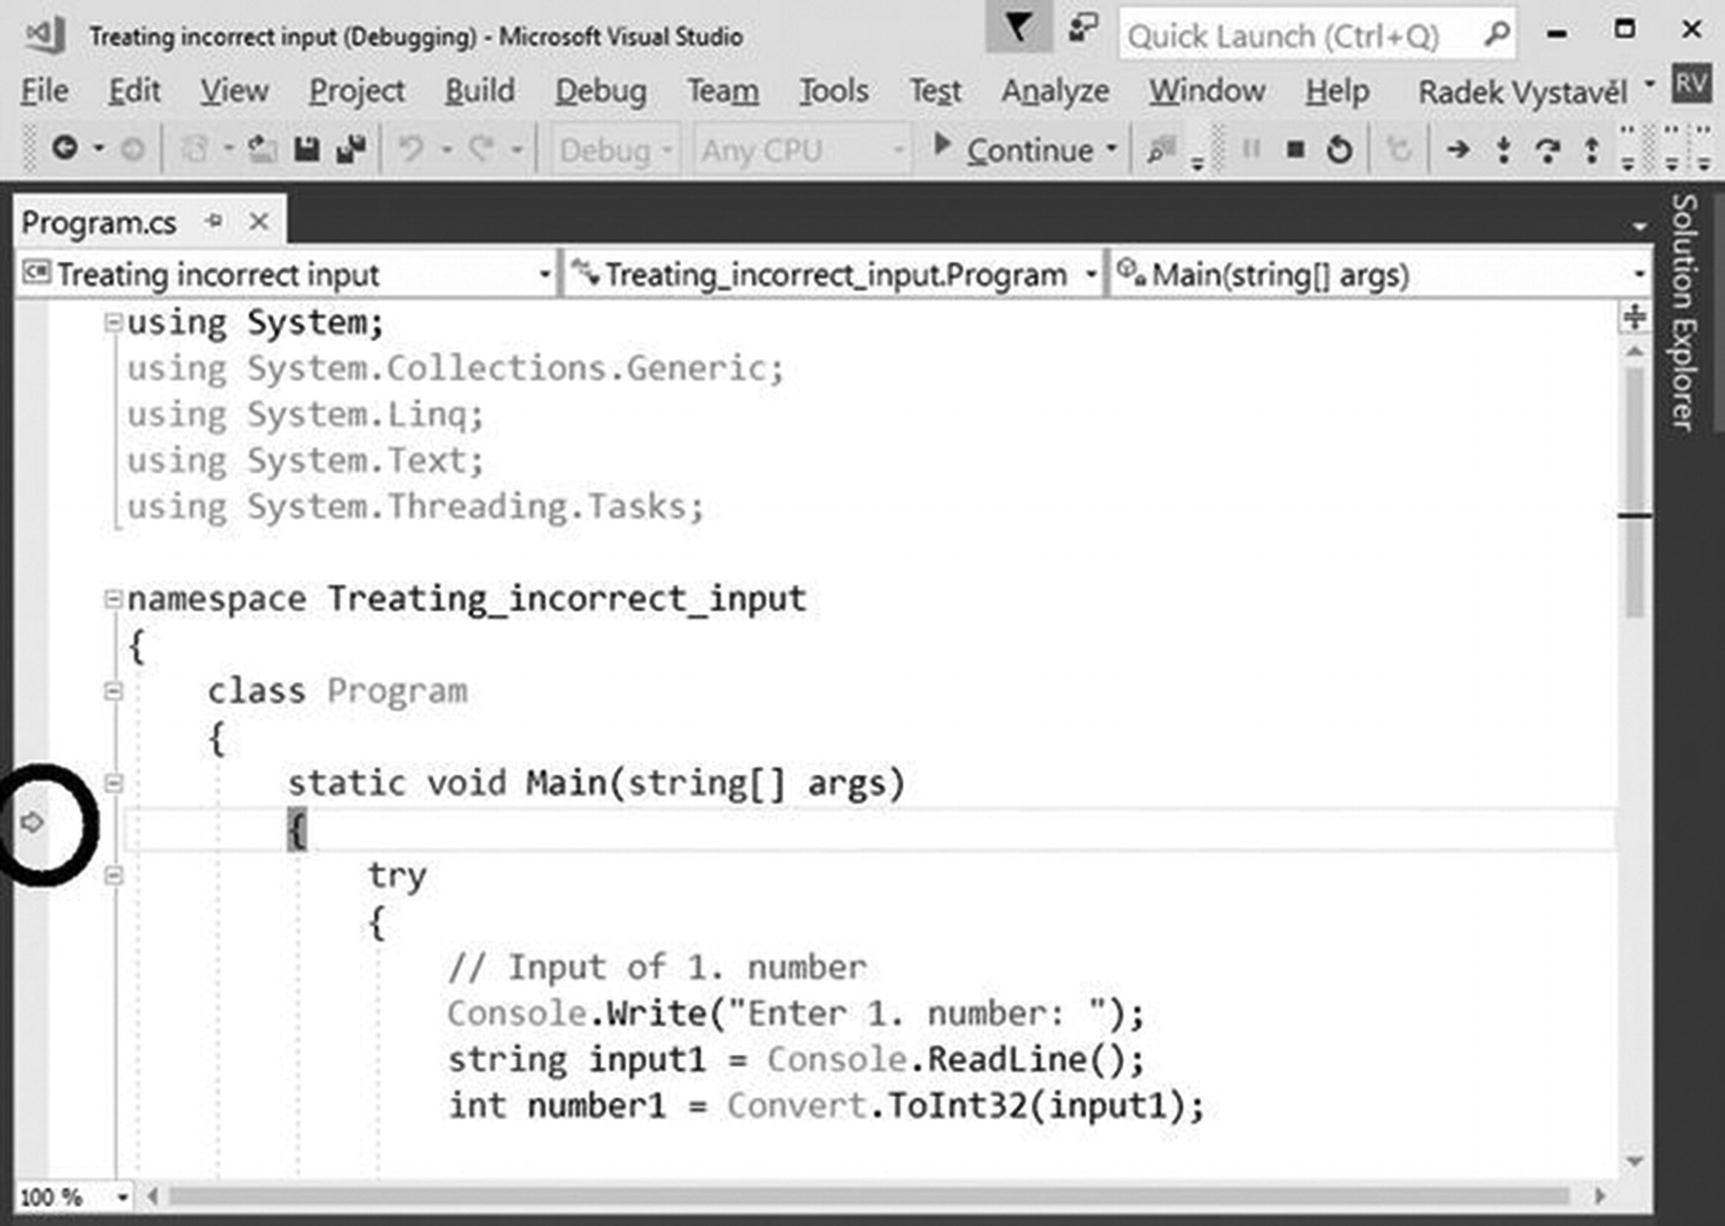
Launching a program using the F10 key
The individual program statements are now being executed one at a time whenever you press F10. All the while, using a yellow arrow and yellow background, the development environment denotes the statement that is to be executed in the next step.
Now just play with the stepping. Try the case when the user enters correct data and also the case of wrong input. The IDE will show you how try-catch or anything else works. This allows you to see how the program runs with your own eyes.
Terminate Stepping
Using the F5 key (or Debug ➤ Continue), you can continue the regular program execution (no stepping).
Using the Shift+F5 key (or Debug ➤ Stop Debugging), you can terminate program execution.
Breakpoints
I have covered what to do if you do not want to step through your code after you have passed the point you are interested in. There is another situation. Say you do not want to do any stepping before you get to the place of interest. In that case, you can use a breakpoint.
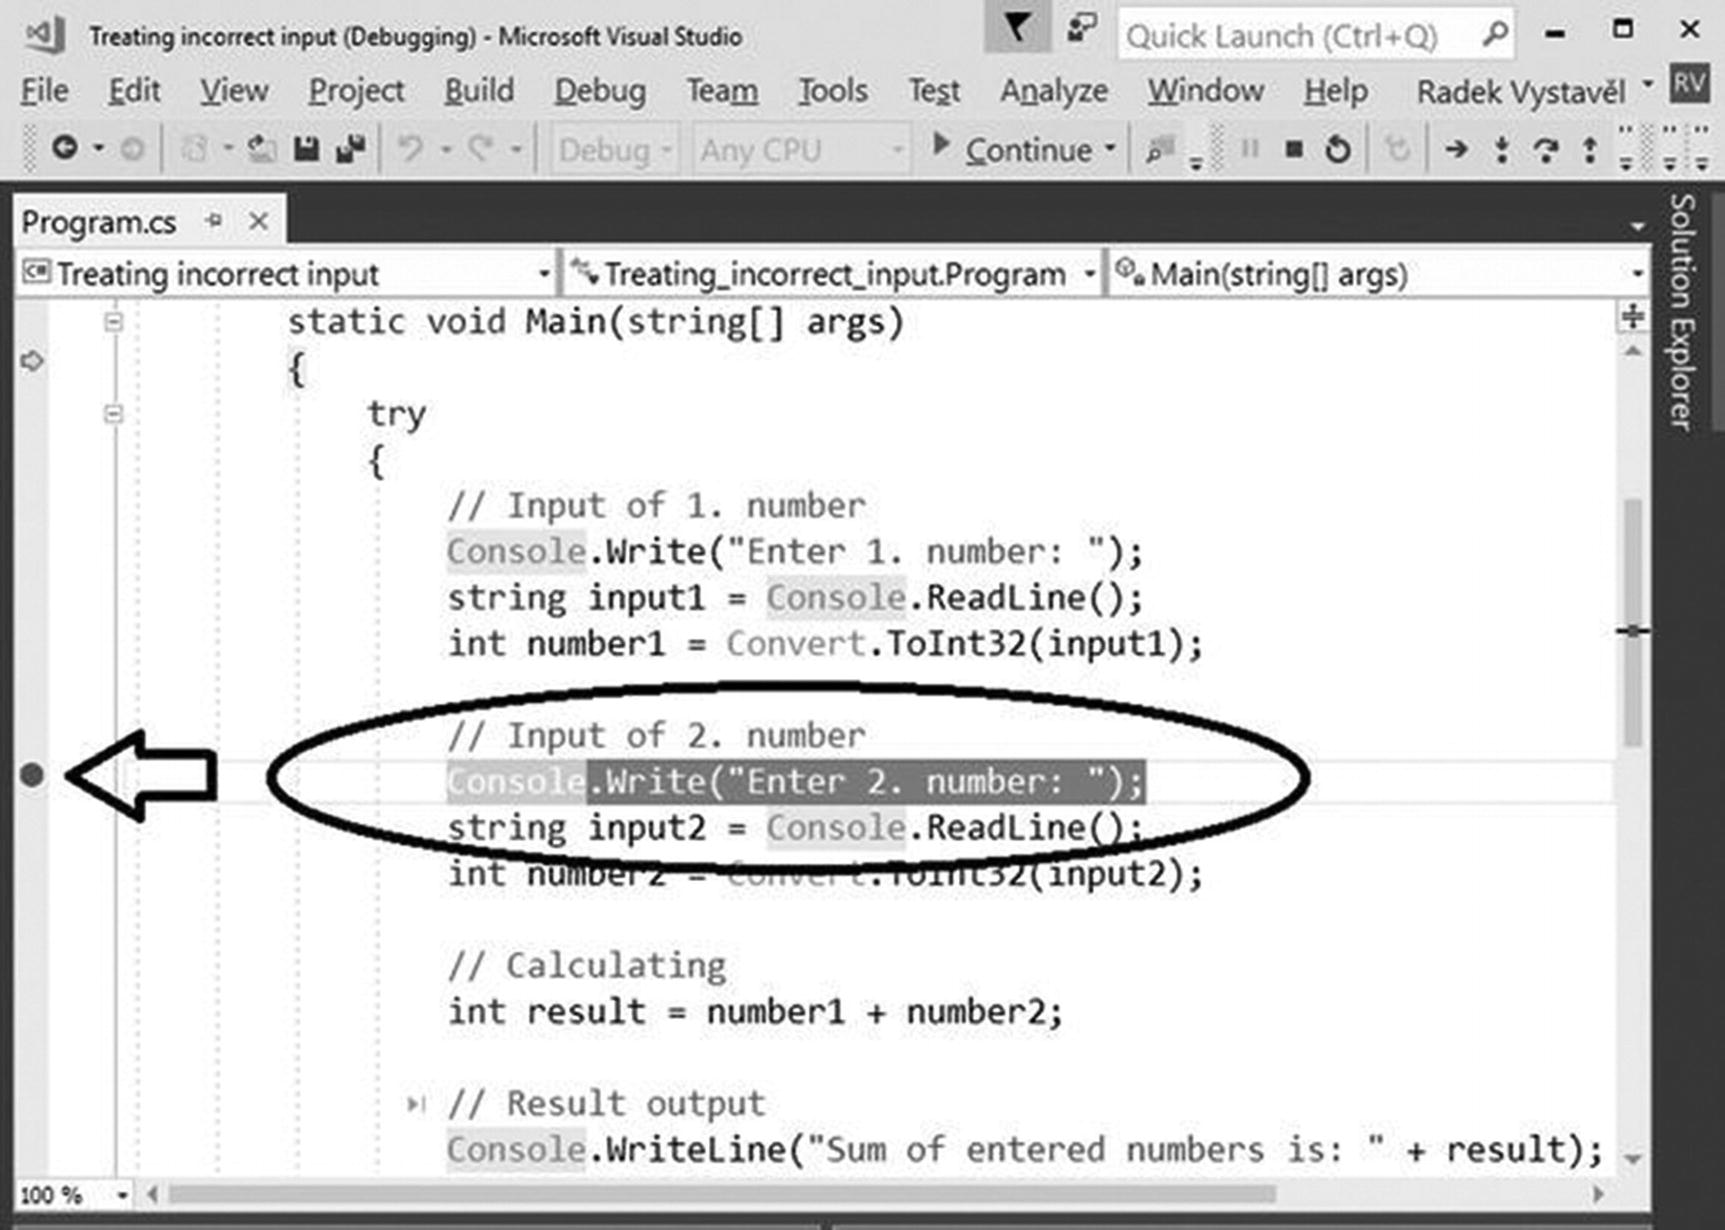
Inserted breakpoint
Using a Breakpoint
If your program is still running from the previous exercise, terminate it by using the Shift+F5 key combination. Now launch the program the regular way, in other words, using the F5 key. It will run normally, and it will stop when it reaches the breakpoint. Visual Studio pops up in front of the program’s window.
After that, you can step through the code or just look at something and use the F5 key to run your program further until its end or until the next breakpoint.
Removing a Breakpoint
To remove a breakpoint that you do not need any longer, press F9 again on a particular line, or right-click and choose Breakpoint ➤ Delete Breakpoint from the context menu.
Memory Inspection
Whenever your program is suspended (from a breakpoint, stepping, and so on), you can inspect the memory that is available to your program and explore the values of individual variables.
To facilitate memory inspection, Visual Studio shows the Autos, Locals, and Watch panes at the bottom of its window. If those panes are not there, you can display them using the Debug ➤ Windows menu.
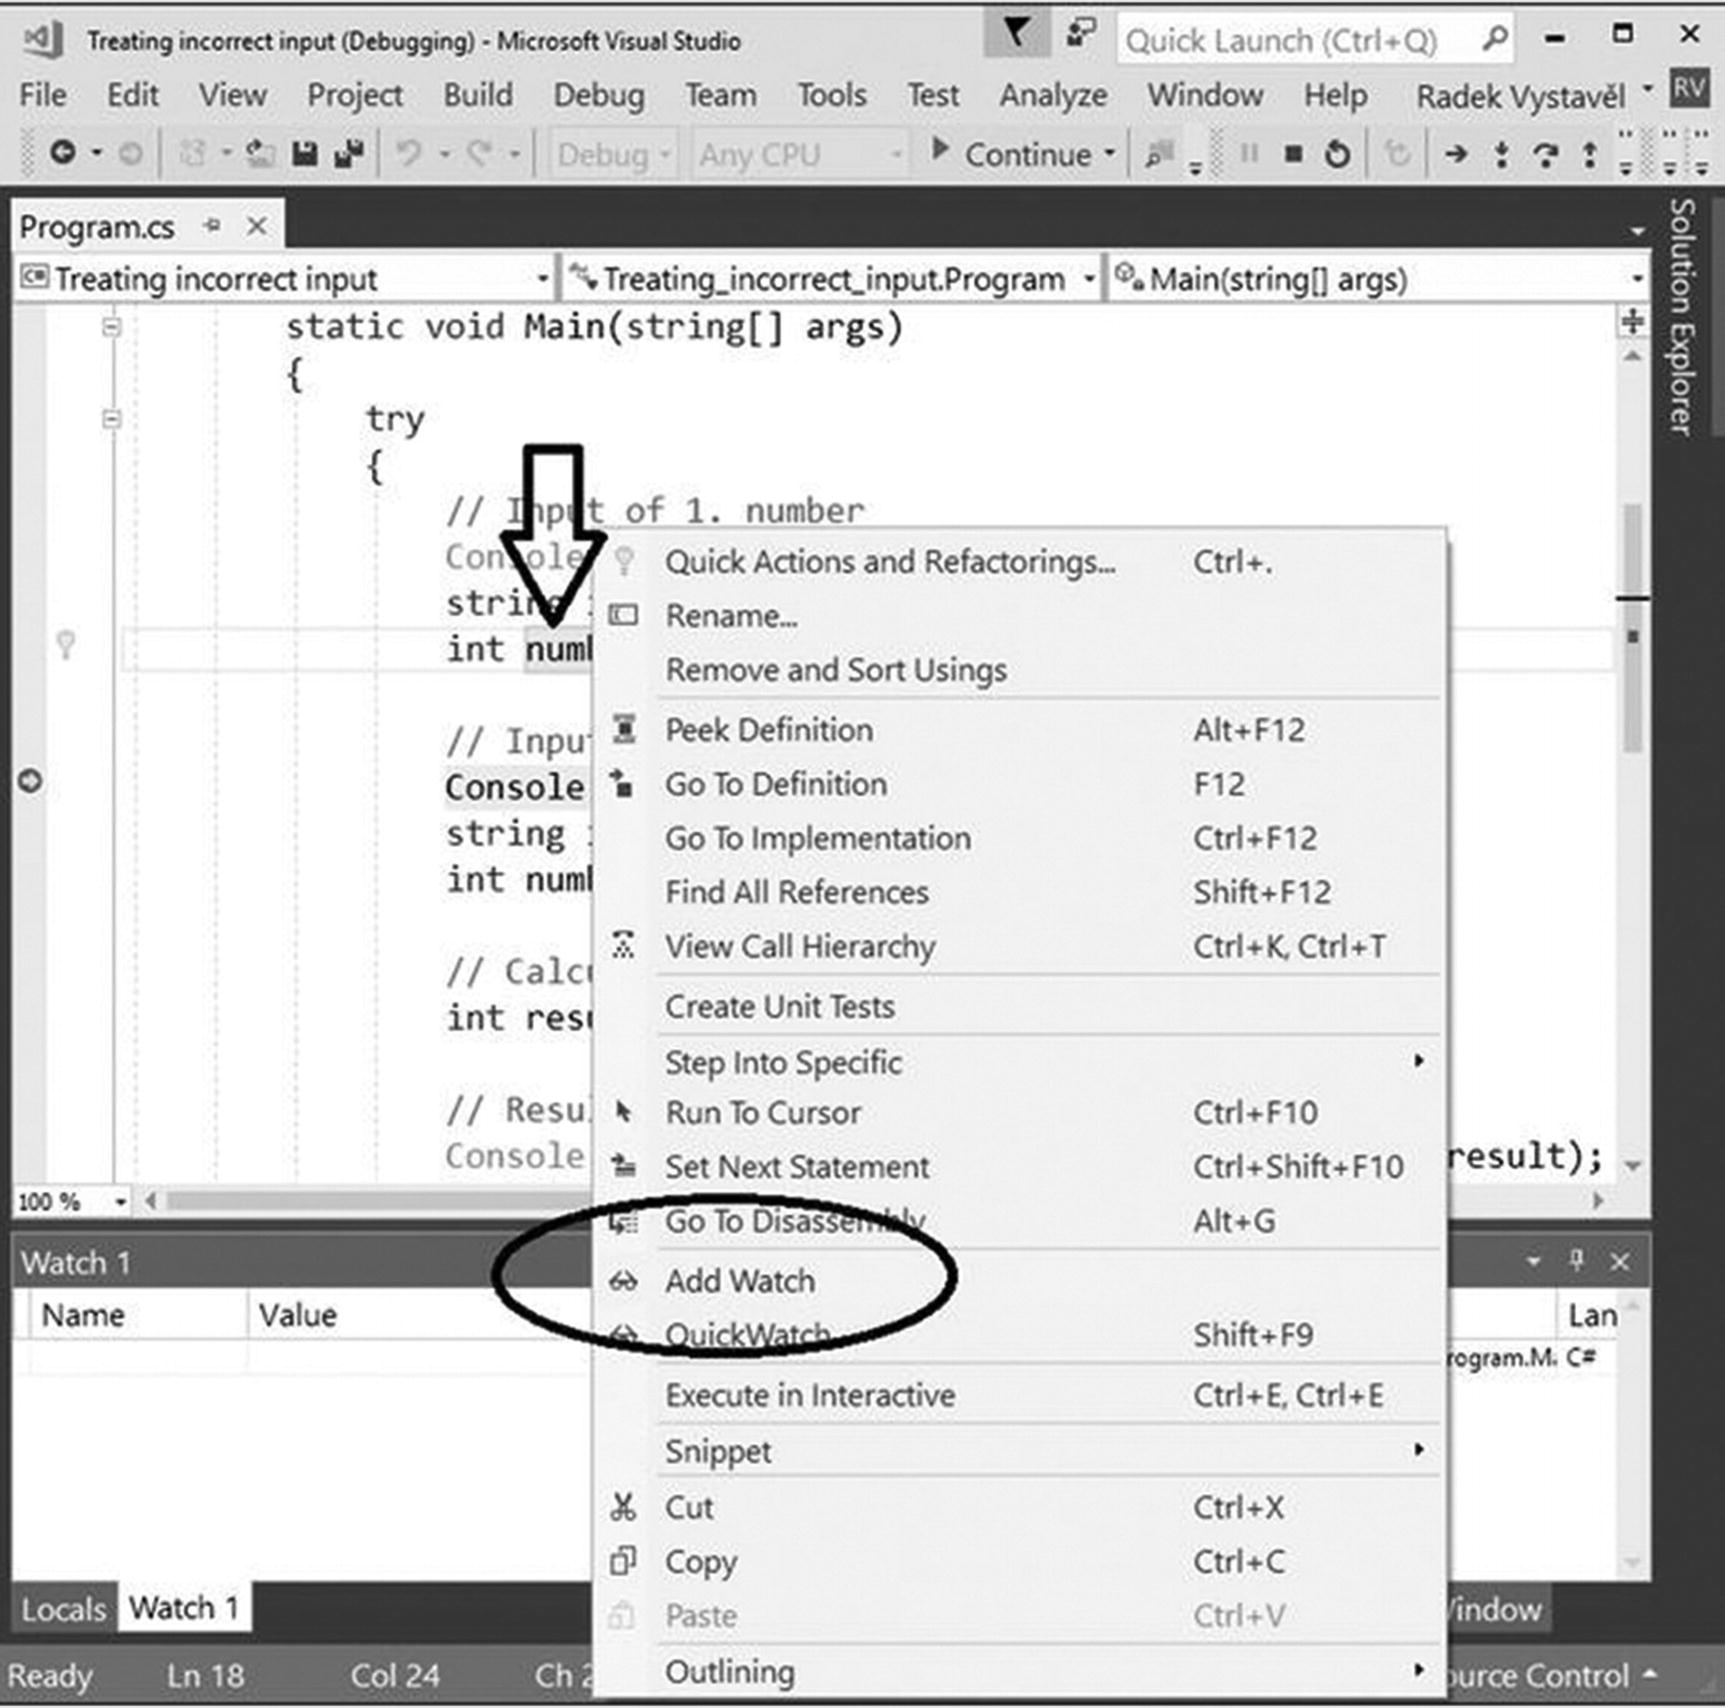
Selecting Add Watch
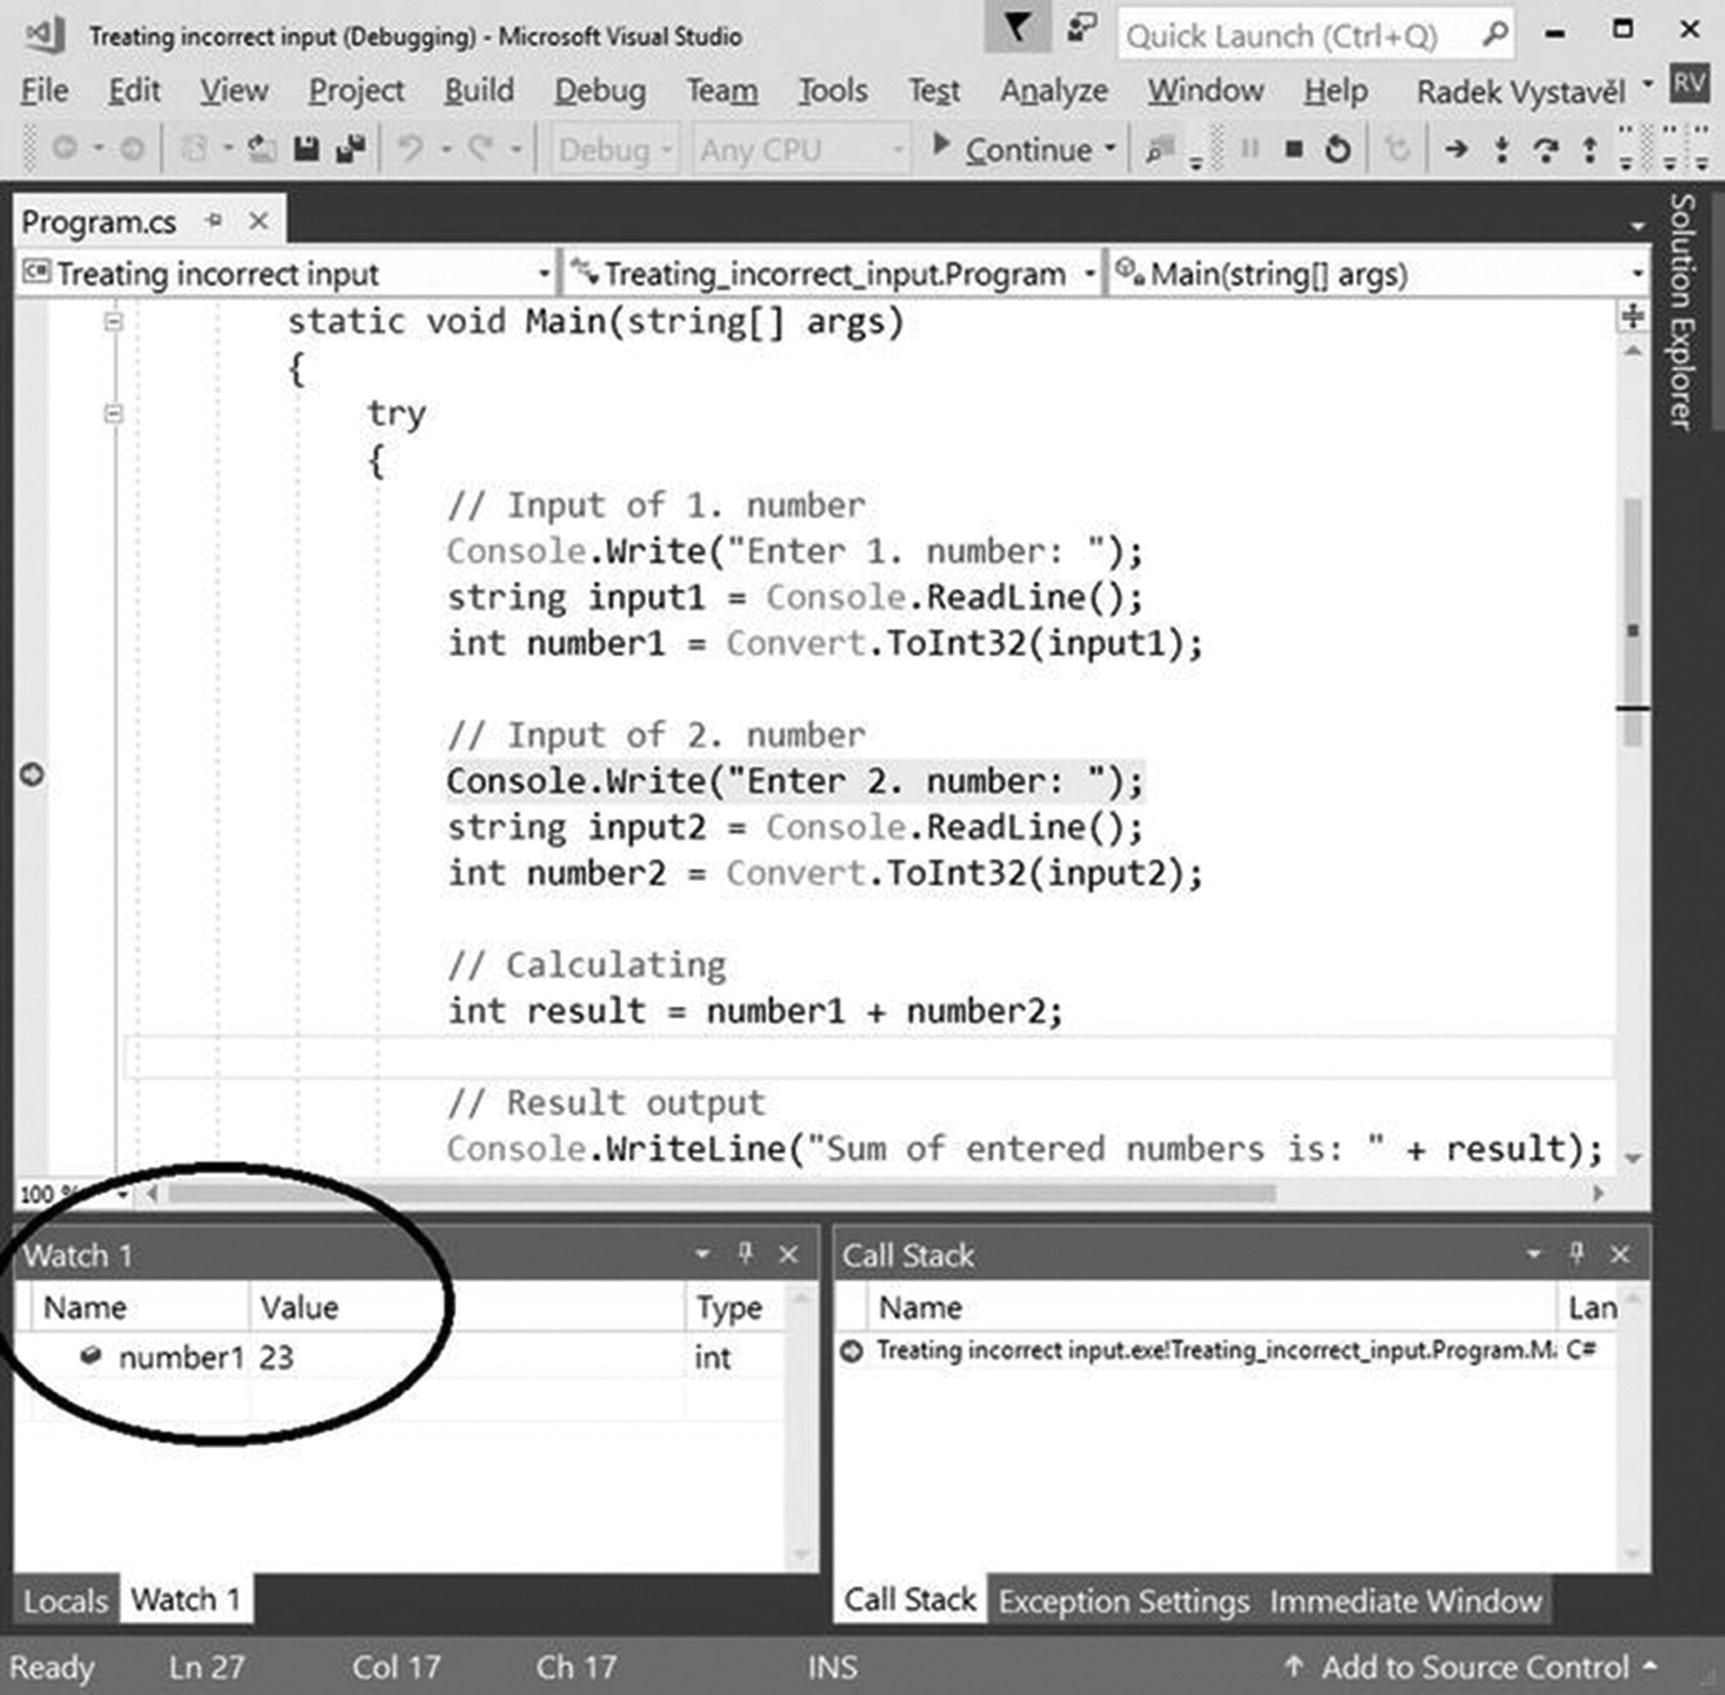
Using the Watch window
C# Interactive
The last tool to help you that I will mention here enables you to study C# statements in interactive mode.
What Is It?
Up to now, you have always had to write a program with several statements and then launch it to see it in action. The interactive mode allows you to enter individual C# statements and run them immediately. You can explore some C# features much faster this way.
How to Launch It?
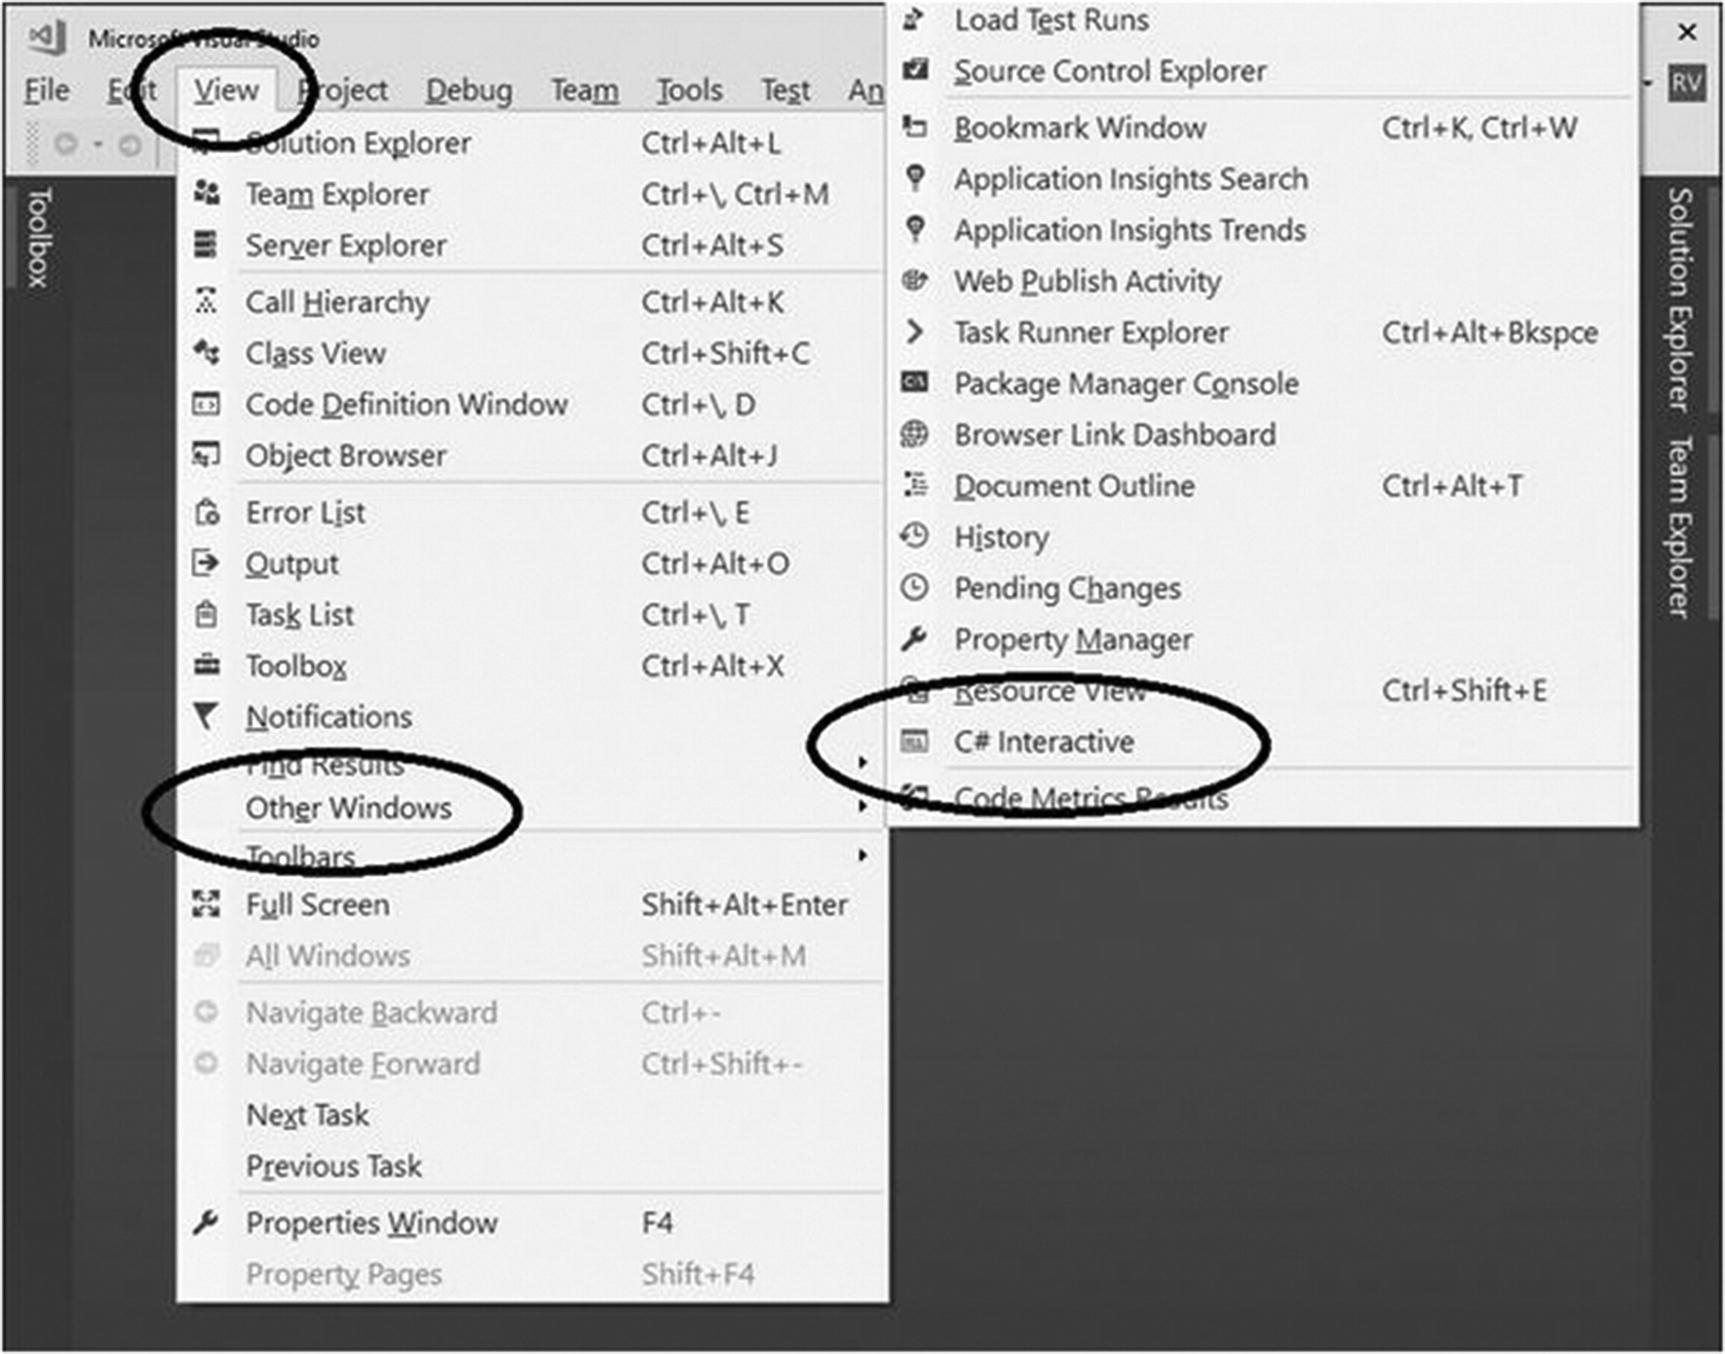
Switching to interactive mode
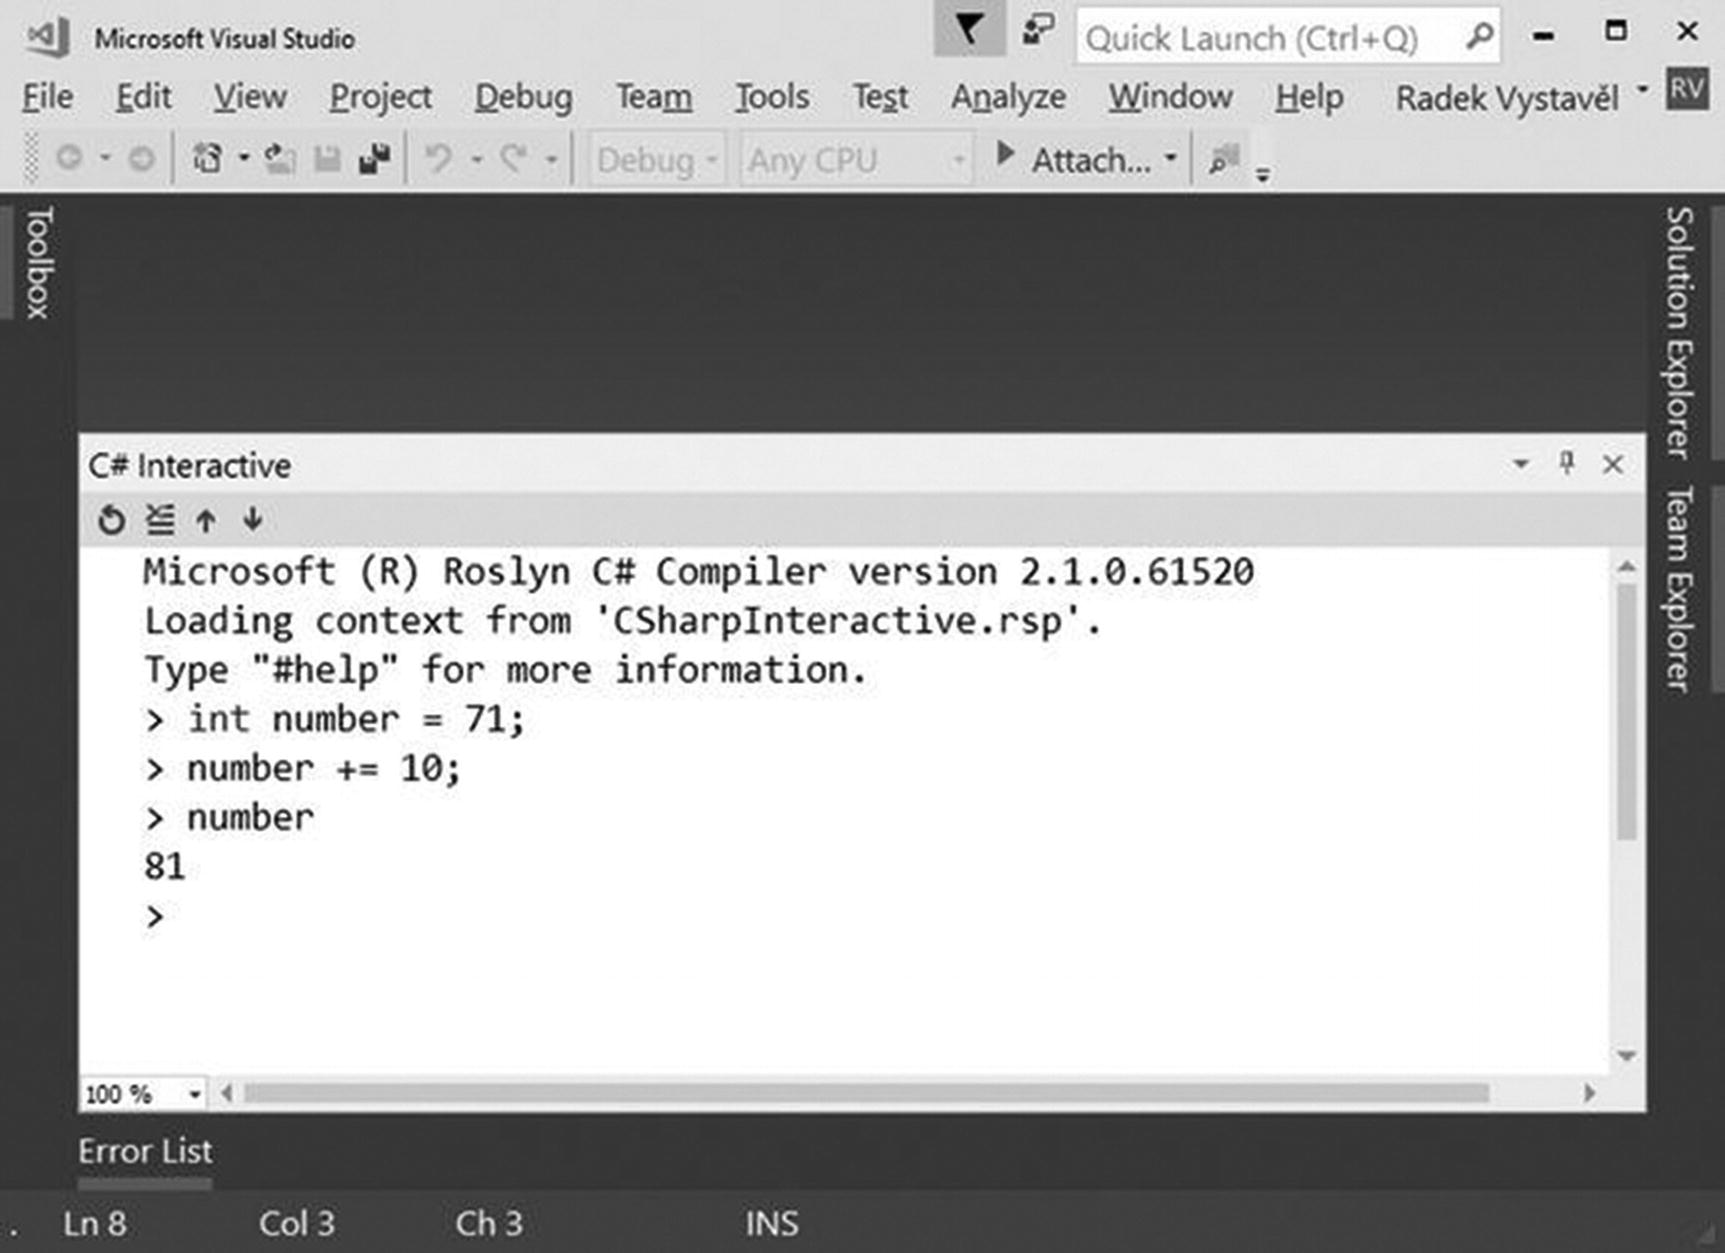
Example interactive session
Notes
If you need to enter a multiline statement, you can terminate lines with Shift+Enter instead of simply Enter.
Using #help displays concise information about how to work with the interactive mode.
Summary
This chapter introduced you to the tooling that you can use in your programming, including IntelliSense, the documentation, debugging tools, and the interactive mode.
IntelliSense shows a list of available possibilities and corresponding tooltips when you type in the Visual Studio editor. You already know how to use it. Here, I introduced IntelliSense as a way of exploring the huge C# universe. For example, if you want to manipulate text and you do not know precisely how a corresponding method is called, you can append a string variable with a dot and browse through the possibilities. You can also append the type’s name with a dot to get still more possibilities.
You learned about the Microsoft documentation website, which contains valuable information for all Microsoft programming technologies, including the C# language and the .NET platform. You usually perform full-text searches on this website.
In the chapter, I uncovered some debugging tools, which allow you to see “inside the computer.” You can watch how individual statements are executed, check the variable values, and so on. Specifically, you learned how to step through your code, set breakpoints, and inspect the memory.
The interactive mode is a way to quickly enter C# statements and see what they do. It is a fine tool to explore new features.