Extended Events are a lightweight monitoring system offered by SQL Server. Because the architecture uses so few system resources, they scale very well and allow you to monitor their instances, with minimal impact on user activity. They are also highly configurable, which gives you in your role as a DBA a wide range of options for capturing details from a very fine grain, such as page splits, to higher-level detail, such as CPU utilization. You can also correlate Extended Events with operating system data to provide a holistic picture when troubleshooting issues. The predecessor to Extended Events was SQL Trace, and its GUI, called Profiler. This is now deprecated for use with the Database Engine, and it is recommended that you only use it for tracing Analysis Service activity.
In this chapter, we will discuss the concepts associated with Extended Events, before discussing how to implement the technology. Finally, we will discuss how to integrate them with operating system counters.
Extended Events Concepts
Extended Events have a rich architecture, which consists of events, targets, actions, types, predicates, and maps. These artifacts are stored within a package, which is, in turn, stored within a module, which can be either a .dll or an executable. We discuss these concepts in the following sections.
Packages
Package0: The default package, used for Extended Events system objects.
Sqlserver: Used for SQL Server–related objects.
Sqlos: Used for SQLOS-related objects.
SecAudit: Used by SQL Audit; however, its objects are not exposed.
Events
Channels
Channel | Description |
|---|---|
Admin | Well-known events with well-known resolutions. For example, deadlocks, server starts, CPU thresholds being exceeded, and the use of deprecated features. |
Operational | Used for troubleshooting issues. For example, bad memory being detected, an AlwaysOn Availability Group replica changing its state, and a long I/O being detected are all events that fall within the Operational channel. |
Analytic | High-volume events that you can use for troubleshooting issues such as performance. For example, a transaction beginning, a lock being acquired, and a file read completing are all events that fall within the Analytic channel. |
Debug | Used by developers to diagnose issues by returning internal data. The events in the Debug channel are subject to change in future versions of SQL Server, so you should avoid them when possible. |
Return List of Categories
Targets
Targets
Target | Synchronous/Asynchronous | Description |
|---|---|---|
Event counter | Synchronous | Counts the number of events that occur during a session |
Event file | Asynchronous | Writes the event output to memory buffers and then flushes them to disk |
Pair matching | Asynchronous | Determines if a paired event occurs without its matching event, for example, if a statement started but never completed |
ETW* | Synchronous | Used to correlate Extended Events with operating system data |
Histogram | Asynchronous | Counts the number of events that occur during a session, based on an action or event column |
Ring buffer | Asynchronous | Stores data in a memory buffer, using first in first out (FIFO) methodology |
Actions
Actions are commands that allow additional information to be captured when an event fires. An action is fired synchronously when an event occurs and the event is unaware of the action. There are 67 actions available in SQL Server 2022, which allow you to capture a rich array of information, including the statement that caused the event to fire, the login that ran this statement, the transaction ID, the CPU ID, and the call stack.
Predicates
Predicates are filter conditions that you can apply before the system sends events to the target. It is possible to create simple predicates, such as filtering statements completing based on a database ID, but you can also create more complex predicates, such as only capturing a long I/O that has a duration greater than five seconds, or only capturing the role change of an AlwaysOn Availability Group replica if it happens more than twice.
Predicates also fully support short-circuiting. This means that if you use multiple conditions within a predicate, then the order of predicates is important, because if the evaluation of the first predicate fails, the second predicate will not be evaluated. Because predicates are evaluated synchronously, this can have an impact on performance. Therefore, it is prudent to design you predicates in such a way that predicates that are least likely to evaluate to true come before predicates that are very likely to evaluate to true. For example, imagine that you are planning to filter on a specific database (with a database ID of 6) that is the target of a high percentage of the activity on the instance, but you also plan to filter on a specific user ID (MyUser), which is responsible for a lower percentage of the activity. In this scenario, you would use the WHERE (([sqlserver].[username]=N'MyUser') AND ([sqlserver].[database_id]=(6))) predicate to first filter out activity that does not relate to MyUser and then filter out activity that does not relate to database ID 6.
Types and Maps
Action
Event
Pred_compare (retrieve data from events)
Pred_source (compare data types)
Target
Type
Retrieving Predicate Comparators and Sources
Sys.dm_xe_map_values
Sessions
A session is essentially a trace. It can contain events from multiple packages, actions, targets, and predicates. When you start or stop a session, you are turning the trace on or off. When a session starts, events are written to memory buffers and have predicates applied before they are sent to the target. Therefore, when creating a session, you need to configure properties, such as how much memory the session can use for buffering, what events can be dropped if the session experiences memory pressure, and the maximum latency before the events are sent to the target.
Creating an Event Session
Creating the Chapter20 Database
Using the New Session Dialog Box
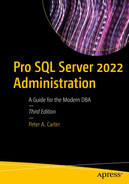
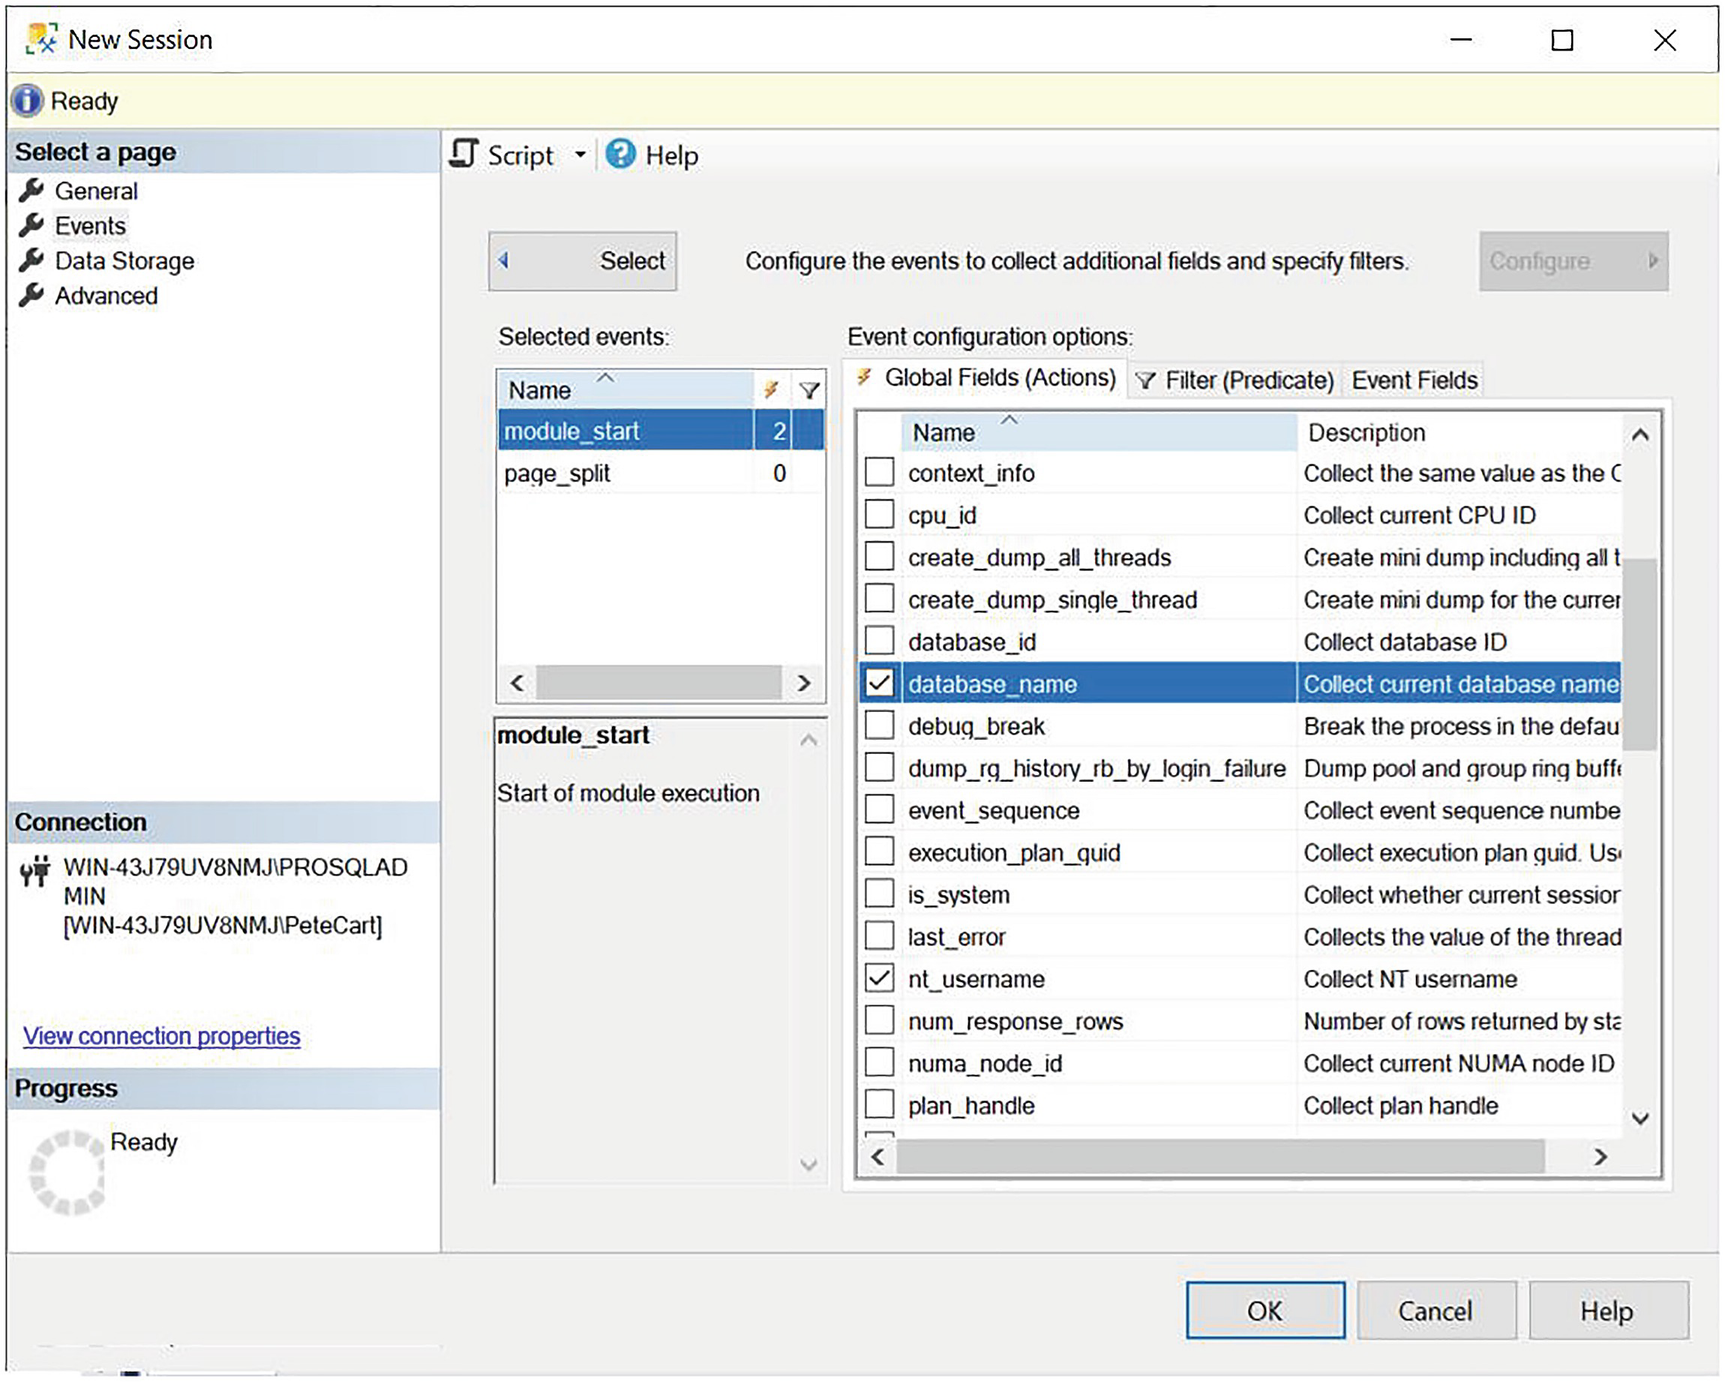
You can access the New Session dialog box from SQL Server Management Studio by first drilling through Management ➤ Extended Events in Object Explorer and then by selecting New Session from the Sessions context menu. We use the New Session dialog box to create a session that monitors page splits and correlates them with the stored procedures that caused them to occur. To allow this, we need to enable causality tracking, which gives each event an additional GUID value, called an ActivityID, and a sequence number; together, these allow the events to be correlated.

The General page
Because we are going to monitor page splits, we name the session PageSplits and specify that the session should start automatically, both after creation and also when the instance starts. We also turn on causality tracking.

The Events page
The Global Fields (Actions) tab
If you need to configure the same actions for multiple events, you can multiselect the events.
The Filter (Predicate) tab

The Event Fields tab
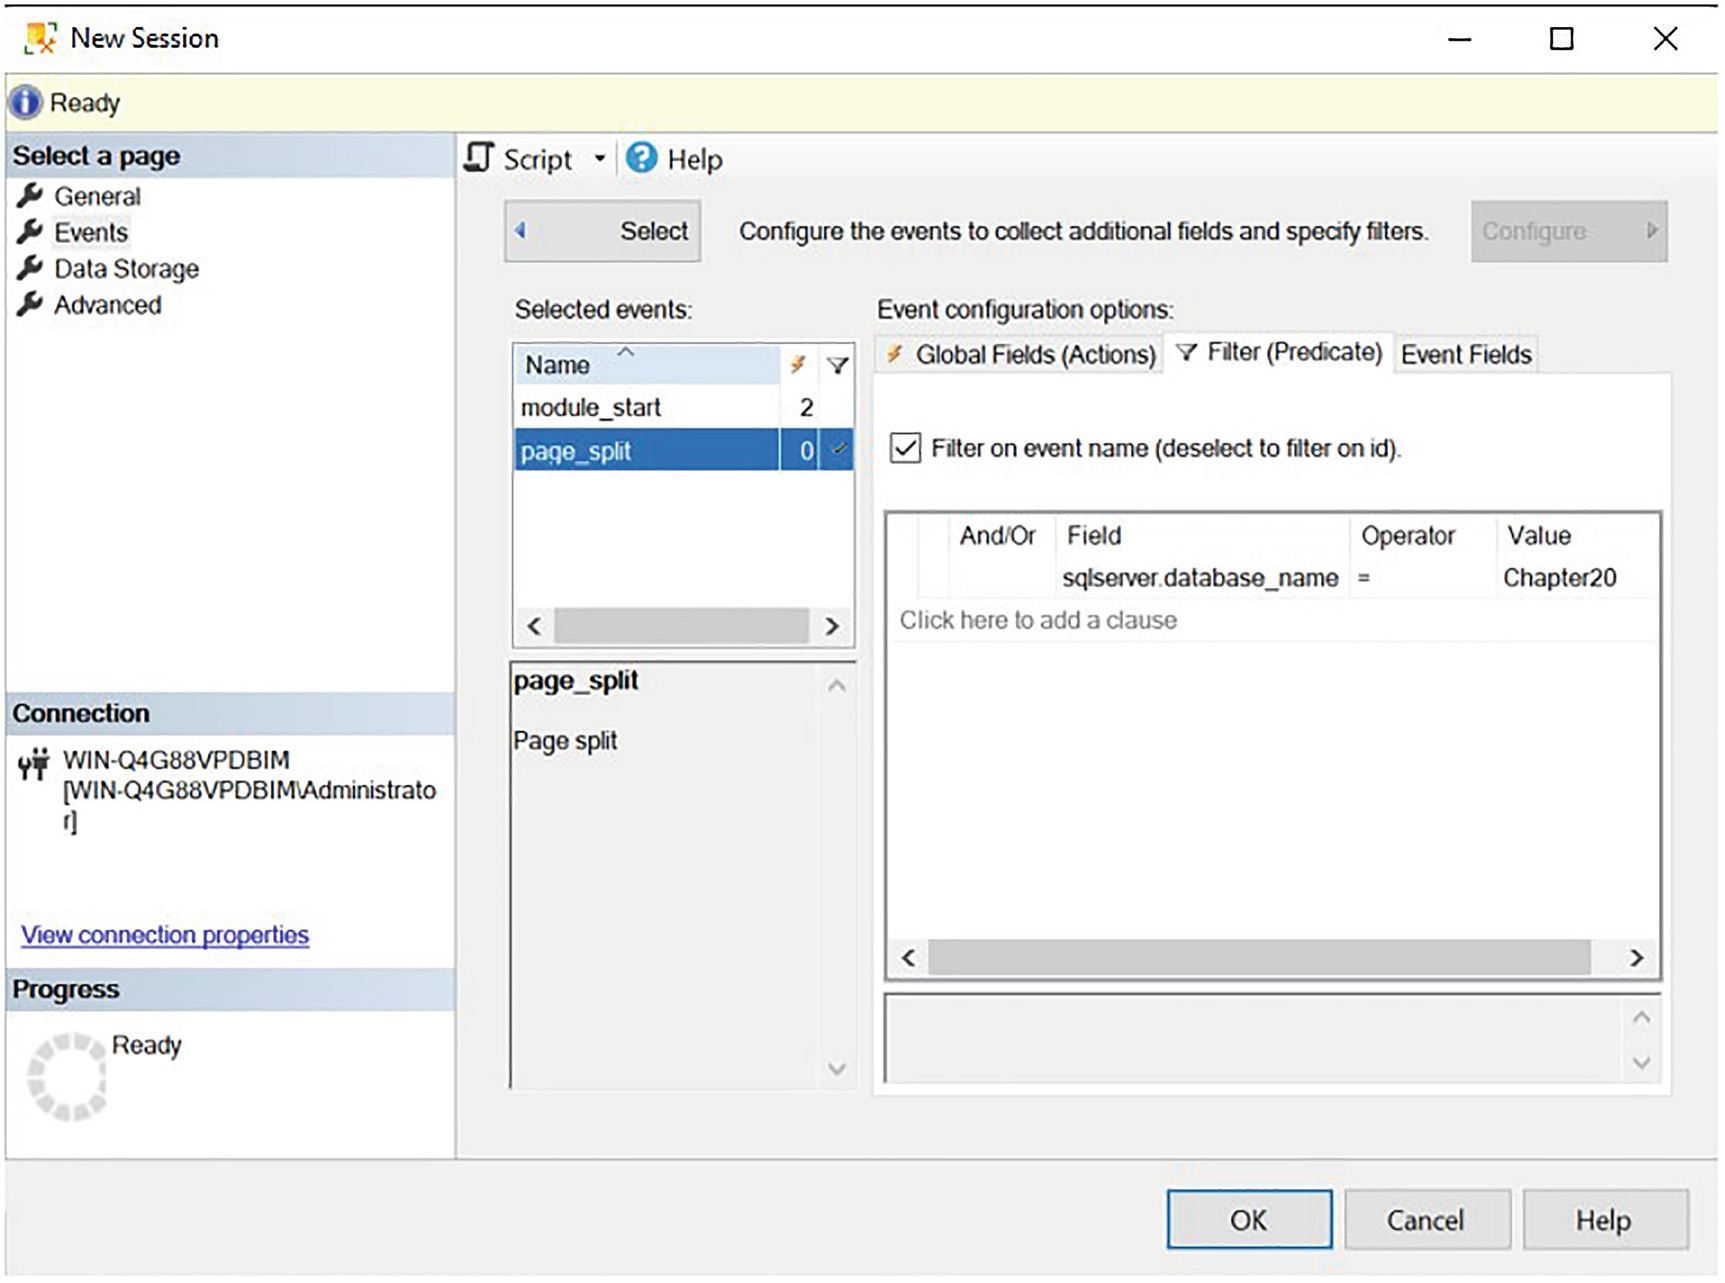
The Data Storage page
On the Advanced page, we can specify the desired behavior in the event of memory pressure: whether single-event loss is acceptable, whether multiple-event loss is acceptable, or whether there should be no event loss at all. We can also set the minimum and maximum size for events and how memory partitioning should be applied. This is discussed in more detail in the following section. Additionally, we can configure dispatch latency. This indicates the maximum amount of time that an event remains in the buffers before it is flushed to disk.
Using T-SQL
Create Event Session Arguments
Argument | Description |
|---|---|
event_session_name | The name of the event session that you are creating. |
ADD EVENT | SET | Specified for every event that is added to the session, followed by the name of the event, in the format package.event. You can use the SET statement to set event-specific customizations, such as including nonmandatory event fields. |
ACTION | Specified after each ADD EVENT argument if global fields should be captured for that event. |
WHERE | Specified after each ADD EVENT argument if the event should be filtered. |
ADD TARGET | SET | Specified for each target that will be added to the session. You can use the SET statement to populate target-specific parameters, such as the filename parameter for the event_file target. |
Create Event Session WITH Options
Option | Description |
|---|---|
MAX_MEMORY | The maximum amount of memory that the event session can use for buffering events before dispatching them to the target(s). |
EVENT_RETENTION_MODE | Specifies the behavior if the buffers become full. Acceptable values are ALLOW_SINGLE_EVENT_LOSS, which indicates that a single event can be can be dropped if all buffers are full; ALLOW_MULTIPLE_EVENT_LOSS, which indicates that an entire buffer can be dropped if all buffers are full; and NO_EVENT_LOSS, which indicates that tasks that cause events to fire are to wait until there is space in the buffer. |
MAX_DISPATCH_LATENCY | The maximum amount of time that events can reside in the session’s buffers before being flushed to the target(s), specified in seconds. |
MAX_EVENT_SIZE | The maximum possible size for event data from any single event. It can be specified in kilobytes or megabytes and should only be configured to allow events that are larger than the MAX_MEMORY setting. |
MEMORY_PARTITION_MODE | Specifies where vent buffers are created. Acceptable values are NONE, which indicates that the buffers will be created within the instance; PER_NODE, which indicates that the buffers will be created for each NUMA node; and PER_CPU, which means that buffers will be created for each CPU. |
TRACK_CAUSALITY | Specifies that an additional GUID and sequence number will be stored with each event so that events can be correlated. |
STARTUP_STATE | Specifies if the session automatically starts when the instance starts. ON indicates it does, OFF indicates it does not. |
Using the NO_EVENT_LOSS option for EVENT_RETENTION_MODE can cause performance issues on your instance, because tasks may have to wait to complete until there is space in the event session’s buffers to hold the event data.
The script in Listing 20-5 demonstrates how you can use T-SQL to create a session called LogFileIO. This session is similar to the Database Log File IO Tracking template, provided through the GUI. The difference is that we are additionally capturing the sqlos.wait_completed event and the sqlserver.DatabaseName global field, and filtering on this, so that only details of the Chapter20 transaction log are tracked.
Creating an Event Session
This session will start automatically, due to the STARTUP_STATE begin configured as ON.
Viewing the Collected Data
SQL Server provides a data viewer that you can use for basic analysis of event data from a file or live data from the buffers. For more complex analysis, however, you can access and manipulate the event data via T-SQL. The following sections discuss each of these methods of analysis.
Analyzing Data with Data Viewer
You can use the data viewer to watch live data as it hits the buffers by drilling through Management ➤ Extended Events ➤ Sessions in Object Explorer and selecting Watch Live Data from the Session context menu. Alternatively, you can use it to view data in the target by drilling through the session and selecting View Target Data from the Target context menu.
The data viewer does not support the ring buffer or ETW target types.
Inserting into Customers

Data view on event_file target

Data viewer toolbar
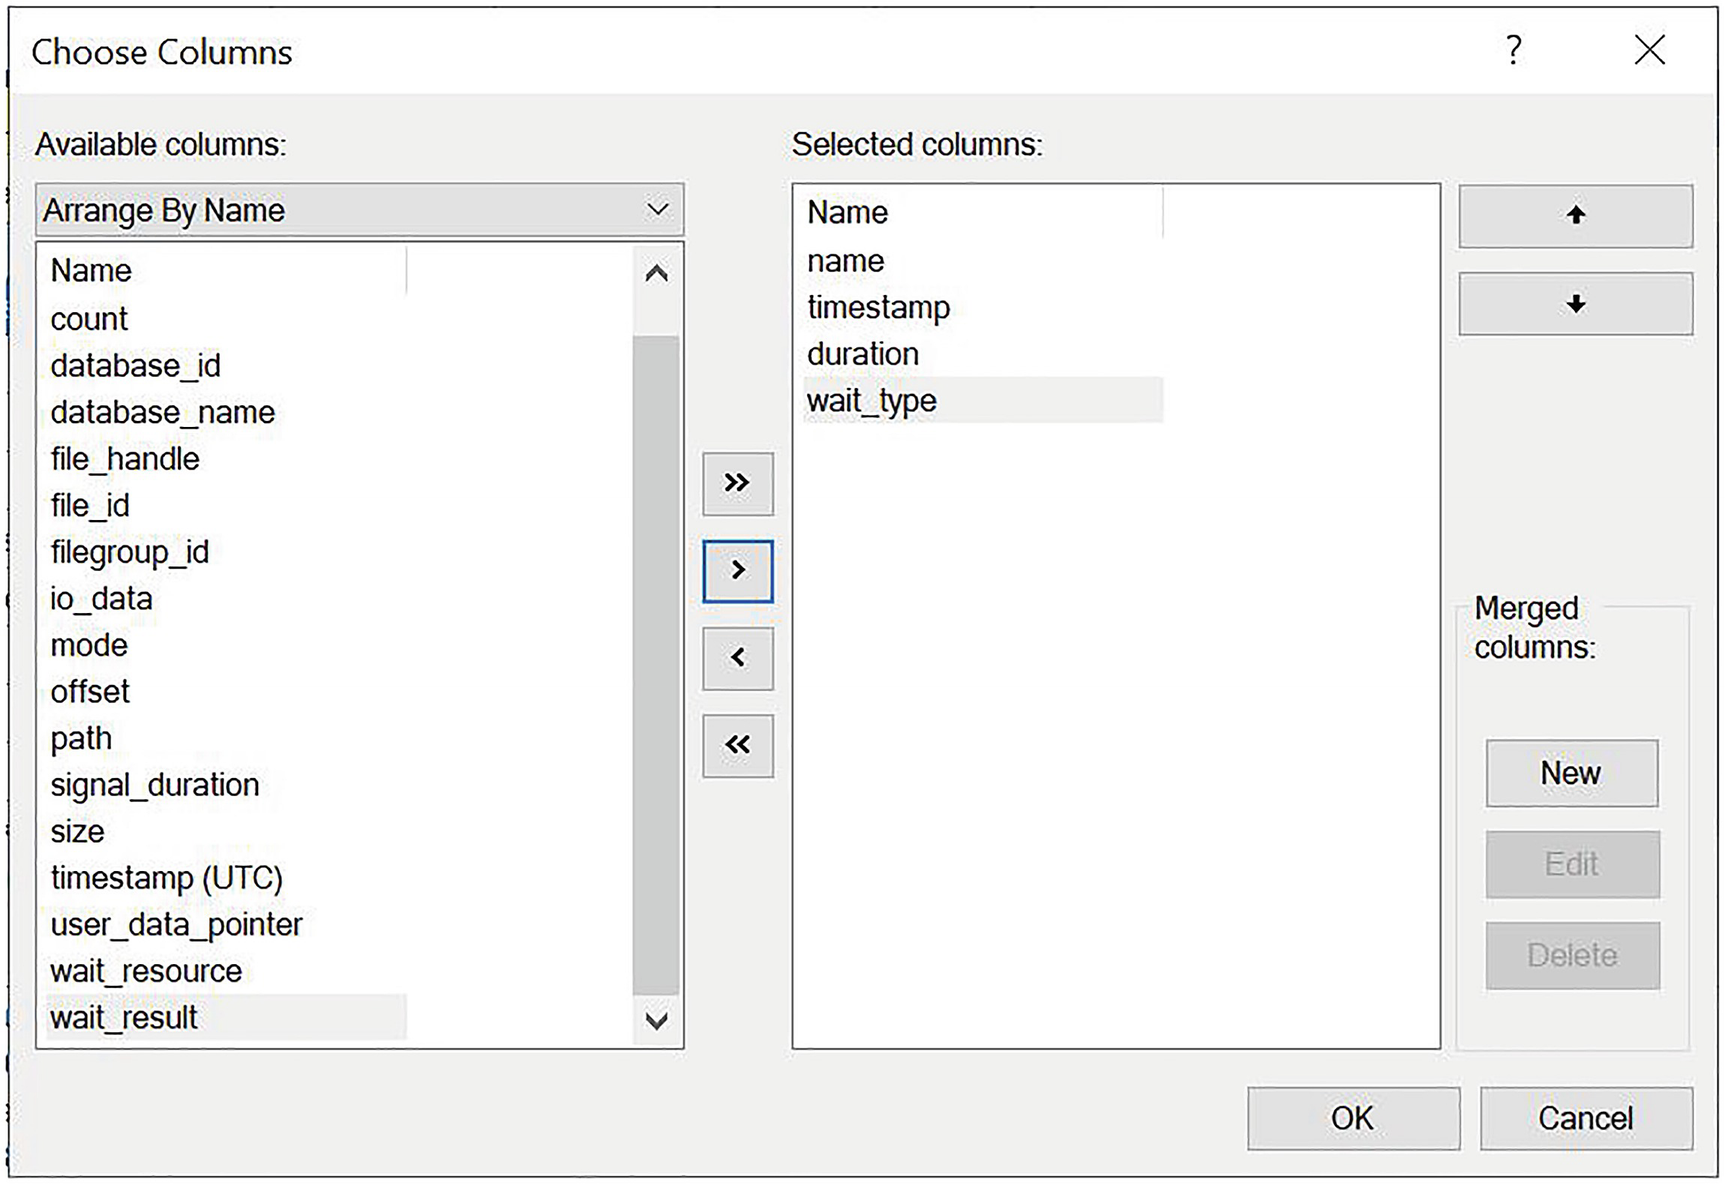
The Choose Columns dialog box
We can now right-click the wait_type column, and select the Group By This Column option. This will cause all of the events to be rolled up, to the level of Wait Type.
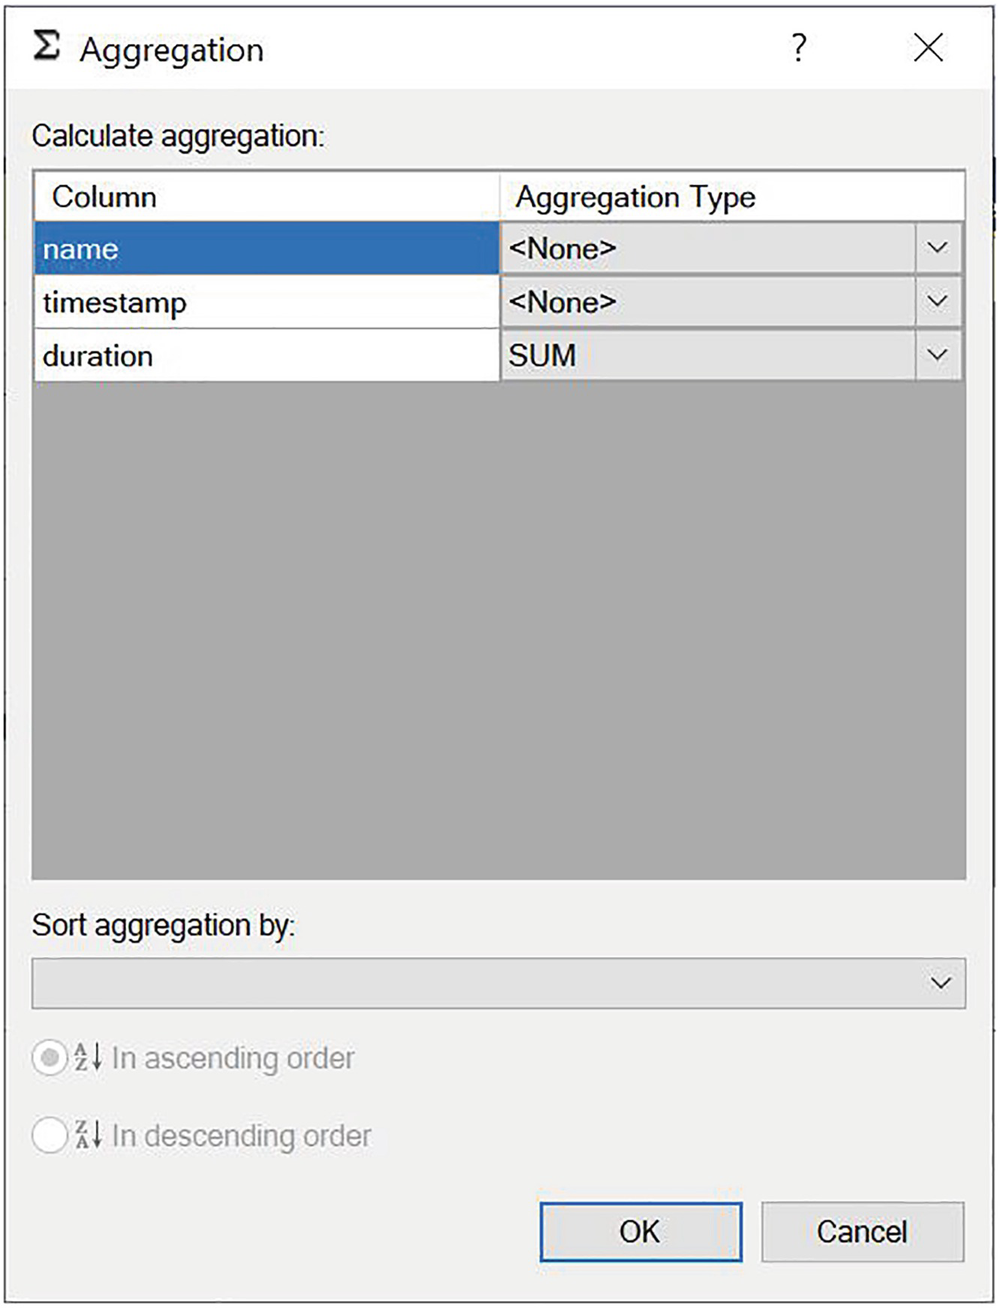
The Aggregation dialog box

The data viewer grid
Analyzing Data with T-SQL
sys.fn_xe_file_target_read_file Parameters
Parameter | Description |
|---|---|
path | The file path and file name of the .XEL file. This can contain the * wildcard so that rollover files can be included. |
mdpath | The file path and name of the metadata file. This is not required for SQL Server 2012 and above but is for backward compatibility only, so you should always pass NULL. |
initial_file_name | The first file in the path to read. If this parameter is not NULL, then you must also specify initial_offset. |
initial_offset | Specifies the last offset that was read so that all events prior are skipped. If specified, then you must also specify initial_file_name. |
sys.fn_xe_file_target_read_file Results
Column | Description |
|---|---|
module_guid | The GUID of the module that contains the package |
package_guid | The GUID of the package that contains the event |
object_name | The name of the event |
event_data | The event data, in XML format |
file_name | The name of the XEL file that contains the event |
file_offset | The offset of the block within the file that contains the event |
Because the event data is returned in XML format, we need to use XQuery to shred the nodes into relational data. A full description of XQuery is beyond the scope of this book, but Microsoft provides an XQuery language reference on msdn.microsoft.com.
The script in Listing 20-7 runs the UpdateCustomersWithPageSplits and UpdateCustomersWithoutPageSplits procedures in the Chapter20 database before extracting the event data using the sys.fn_xe_file_target_read_file. We then use the XQuery Value method to extract relational values from the XML results. Finally, because we have turned on causality tracking, we group the data by the correlation GUID to see how many page splits each stored procedure caused. UpdateWithoutPageSplits provides a contrast.
Remember to update filepaths to match your own configuration before running the query.
Analyzing Event Data with T-SQL
Using XQuery allows you to query on every event field and action that is captured within your trace, so you can create very complex queries, providing rich and powerful analysis of the activity within your instance.
Correlating Extended Events with Operating System Data
Extended Events offer the capability to integrate with operating system–level data. This gives useful insights, such as the queries that were running when CPU spiked, etc. The following sections discuss how to correlate SQL Server events with Perfmon data and other operating system–level events.
Correlating Events with Perfmon Data
Before Extended Events were introduced, DBAs used a tool called SQL Trace and its GUI, Profiler, to capture traces from SQL Server; it was possible to correlate this data with data from Perfmon. With Extended Events, you do not often need to make this correlation, because Extended Events include Perfmon counters for processor, logical disk, and system performance objects, such as context switches and file writes. Therefore, you can correlate SQL Server events with operating system counters by adding these objects to the session and by following the T-SQL analysis techniques discussed in the previous section.
Perfmon counters are in the Analytic channel but have no category.
Creating an Event Session with Perfmon Counters
The SQL Server service account must be in the Performance Log Users group, or an error is thrown.
Integrating Event Sessions with Operating System–Level Events
To follow the demonstrations in this section, you need to install Windows Performance Toolkit, which you can download from msdn.microsoft.com as part of the Windows Deployment and Assessment Toolkit.
There are instances in which you may need to integrate event session data with operating system data other than Perfmon counters that SQL Server provides. For example, imagine a scenario in which you have an application that exports SQL Server data to flat files in the operating system so that a middleware product, such as BizTalk, can pick them up. You are having trouble generating some files and you need to view the process flow—from SQL statement being run through to the WMI events being triggered in the operating system. For this, you need to merge event session data with a trace of WMI events. You can achieve this through the ETW (Event Tracking for Windows) architecture.

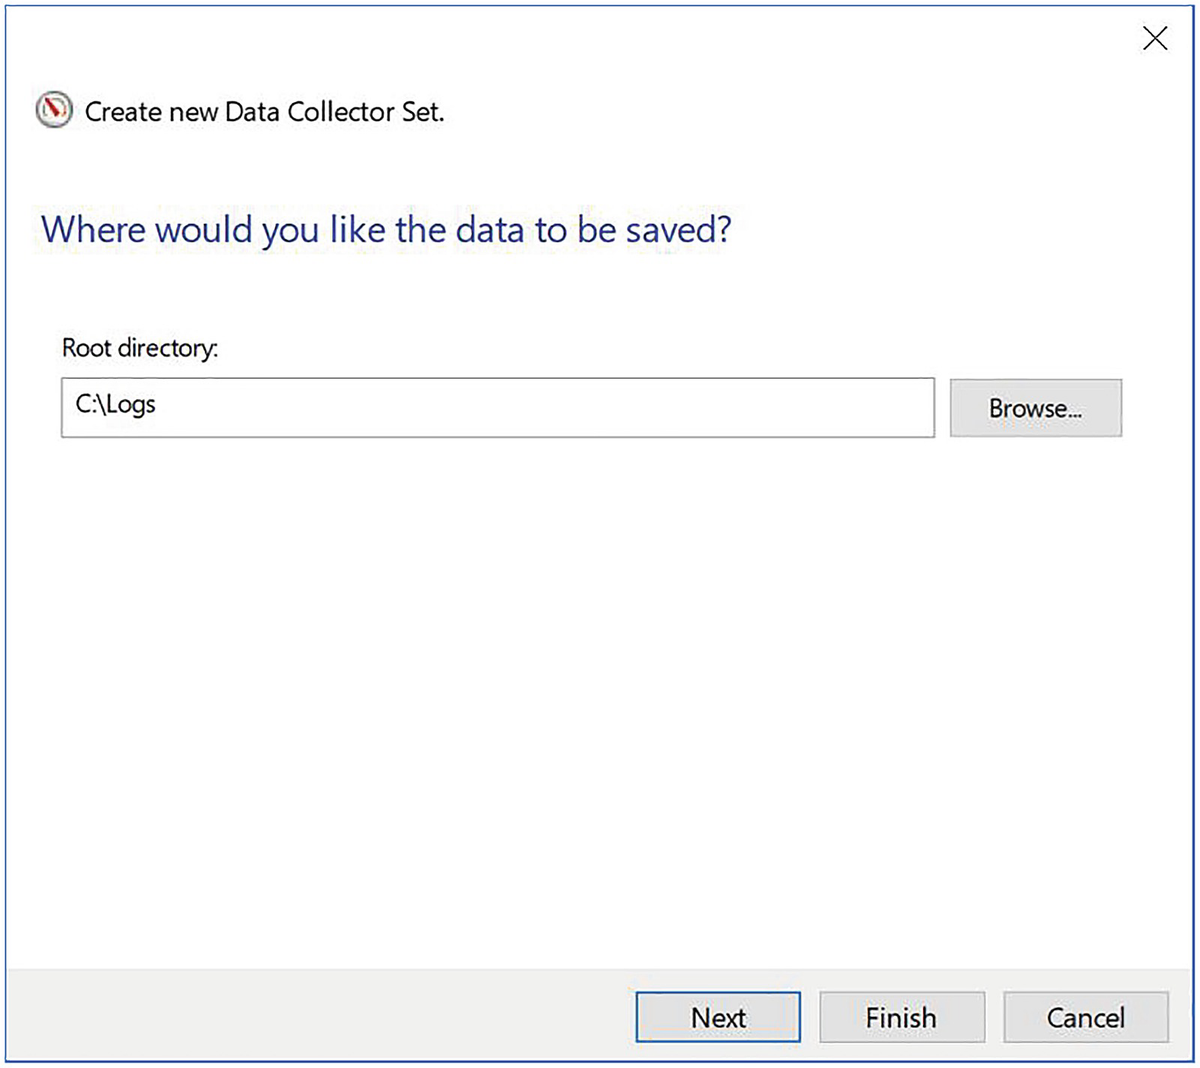
The Create New Data Collector Set wizard
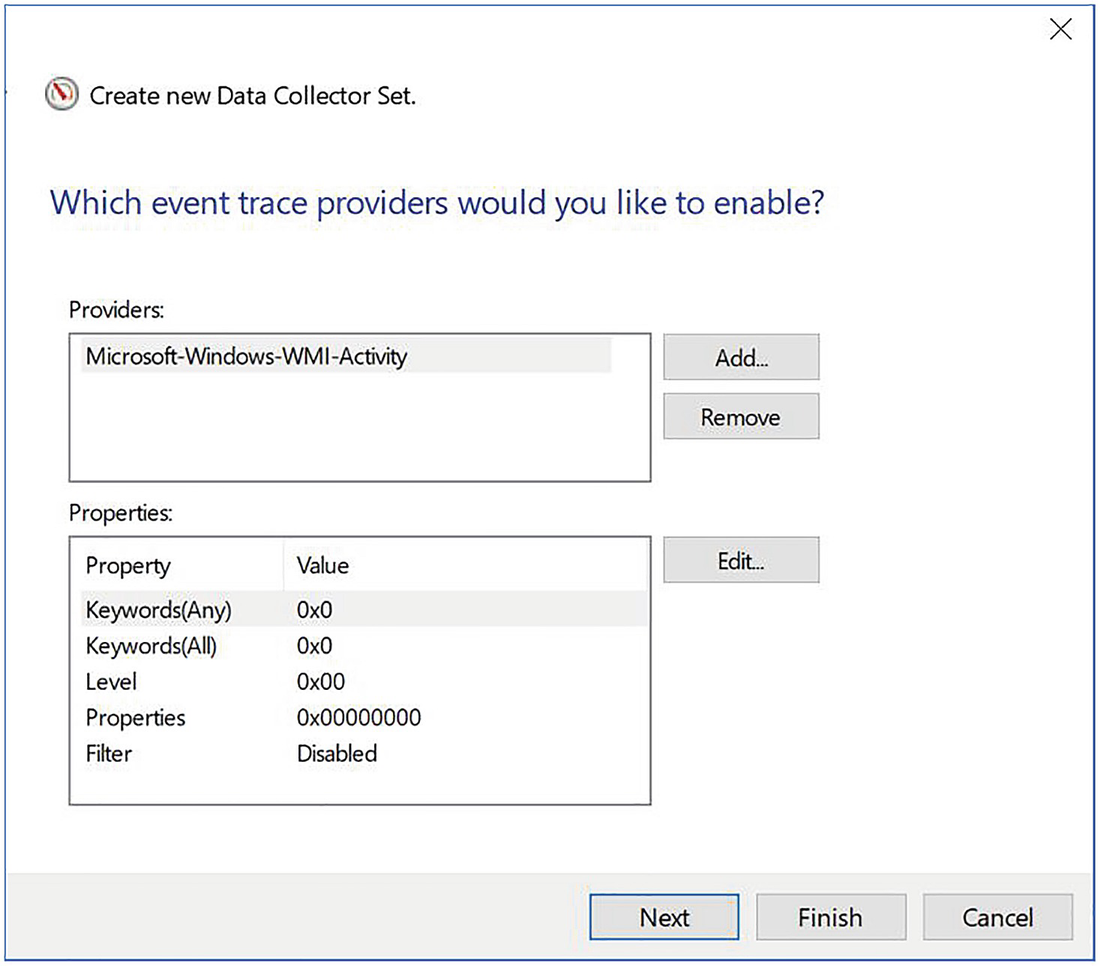
Add the WMI provider
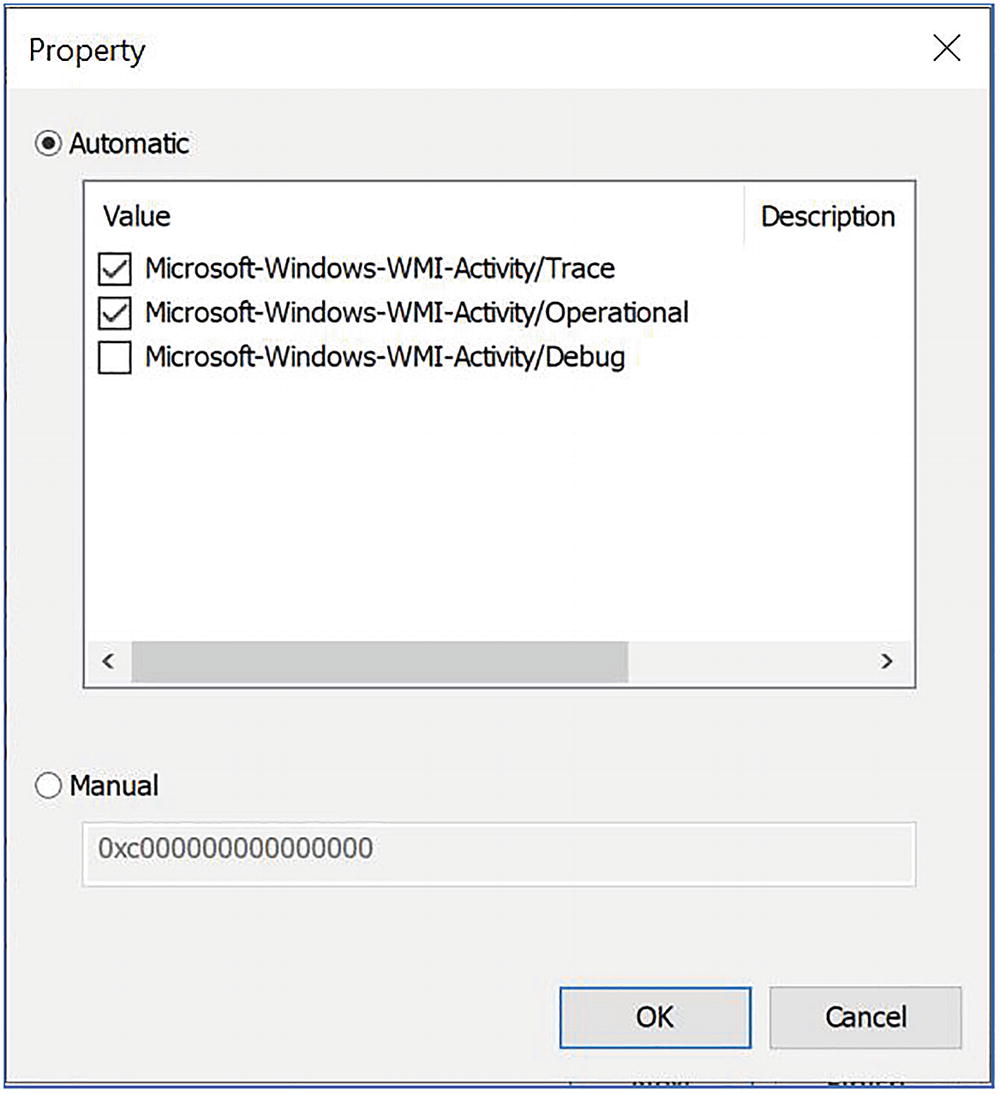
Properties dialog box
Configure the trace file location
On the final page of the wizard, we leave the default options of running the trace under the default account and then save and close the trace.

Start the Data Collector Set
Generating Activity
Stopping the Event Session
You can stop the WMISession and XE_DEFAULT_ETW_SESSION by selecting Stop from their respective context menus in Performance Monitor.
Merging Trace Files

Windows Performance Analyzer
Summary
Extended Events introduce new concepts that you must understand in order to fully harness their power. Events are points of interest that are captured in a trace, whereas actions provide extended information, in addition to the event columns. Predicates allow you to filter events in order to provide a more targeted trace, and targets define how the data is stored. A session is the trace object itself, and it can be configured to include multiple events, actions, predicates, and targets.
You can create an event session through the New Session Wizard, an easy and quick method that exposes Templates; via the New Session dialog box; or of course, via T-SQL. When creating a session via T-SQL, you use the CREATE EVENT SESSION DDL statement to configure all aspects of the trace.
Each Extended Event artifact is contained within one of four packages: Package0, Sqlserver, Sqlos, and SecAudit. The contents of SecAudit are not exposed, however, since these are used internally to support SQL Audit functionality, which is discussed in Chapter 11.
You can view data using the data viewer. The data viewer allows you to watch live data in the session’s buffers, and it also supports viewing target data from the Event File, Event Count, and Histogram Target types. The data viewer provides basic data analysis capability, including grouping and aggregating data.
For more complex data analysis, you can open targets in T-SQL. To open an Event File target, use the sys. fn_xe_file_target_read_file results system stored procedure. You then have the power of T-SQL at your disposal for complex analysis requirements.
You can correlate events by turning on causality tracking within the session. This adds a GUID and a sequence number to each event so that you can identify relationships. You can also easily correlate SQL events with Perfmon data, because Extended Events expose processor, logical disk, and system performance counters. To correlate events with other operating system–level events, event sessions can use the ETW target, which you can then merge with other data collector sets to map Extended Events to events from other providers in the ETW architecture.