
Chapter 10
The Front Spread
The front spread shares many characteristics with butterflies and bull call spreads, except that they are set up as naked trades or with off-center strikes. Here at Option Pit, we love these trades for several reasons:
- They enable put or call selling at extremes without being completely naked
- They have a directional bias but are not extremely directional
- They collect premium
- They are short volatility
- They improve with time
There are a few things that make front spreads different from and, in my opinion, superior to butterflies and short call and put spreads. More often than not, when I look at trades at Option Pit, I end up with a broken wing butterfly or front spread. The trade is going to do well based on specific volatility conditions and, to a lesser extent, on skew conditions. The trade also tends to rely on moderate directional bias.
What Is a Front Spread?
When I was a floor trader, I preferred trading any option that was short gamma and long theta (a trade that expected little or no movement and collected on time decay). To the institutional and retail public, a front spread is a very specific trade that we call a 1 by 2. This means you are long ‘1’ option (purchased for a debit). At the same time, you set up a credit in the ‘2’ part of the 1 by 2. For example, you’re long one option that is close to the money for 2 dollars; and you are short 2 options further away from the money, at 1.25. The net is 2 long less (2 x 1.25) 2.50 short, for a net credit on the 1 by 2 of 0.50. – $2 – ($1.25 x 2) = 0.50 credit. The *2 refers to the short positions.
This trade gains exposure in the direction you expect the underlying to move, and you get paid to set up the trade. However, you are at risk in this trade if the underlying moves too hard or too fast. If your trade moves beyond the range you set, your position could lose big. The risk graph is shown in Figure 10.1.
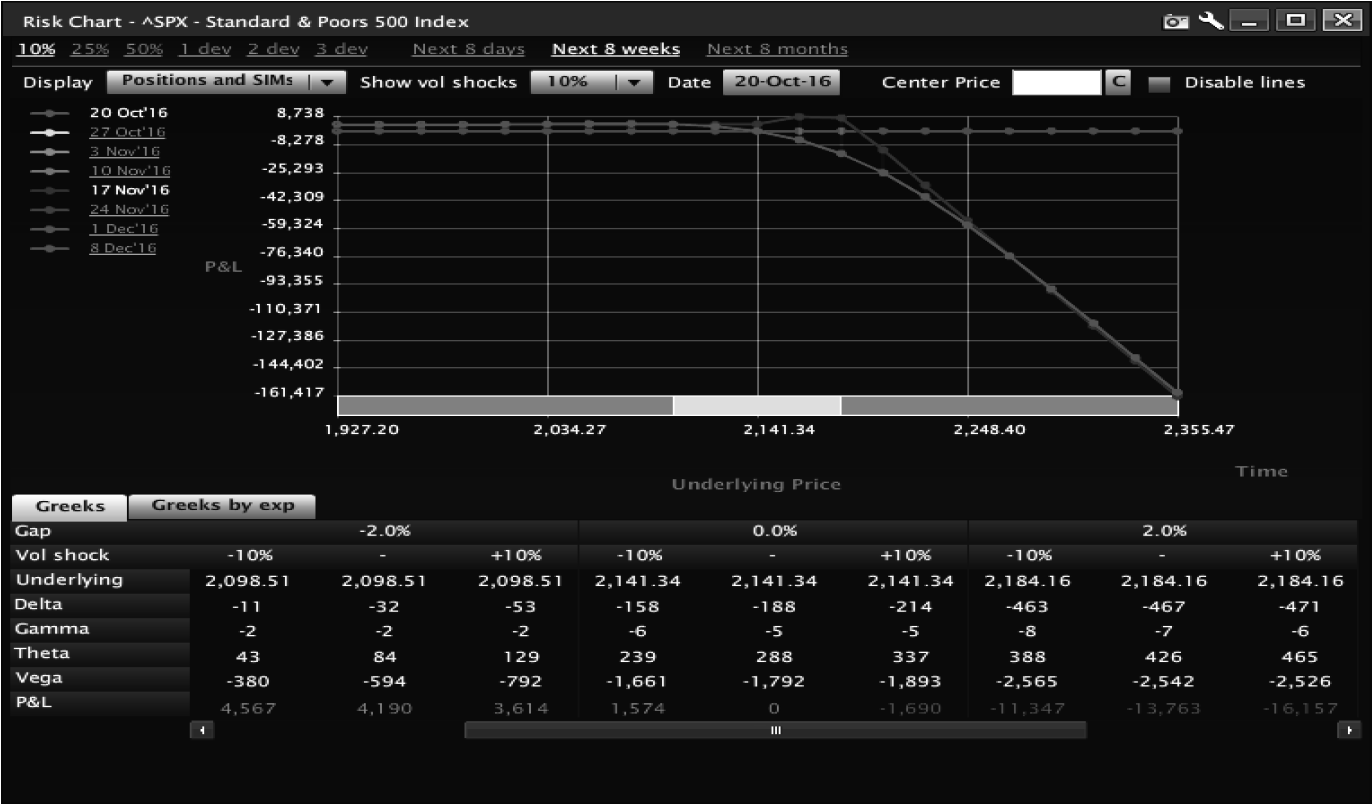
The position expects the underlying to move higher. If expiration is above 2140, the position makes more than it would if the underlying is lower. It doesn’t expect movement to be too quick. As more time passes, the more you hope the underlying will move higher. A move early is a loser but, with time, a run higher does well. At no point in time do you want a strong move in the direction of the trade. Why? At the onset, the trade’s delta is opposite of what you want as time passes; the trade is short delta and expecting the underlying to drop. As time passes, you expect the underlying to rally and delta to become positive. This is caused by the two short options losing value from theta and becoming closer to worthless near expiration. This is an effective trade if managed properly.
Creating a Front Spread
The key to an effective front spread is forming an opinion on direction. The beauty of this trade is that it can be set up against the direction or with the direction. It is the classic ‘fade’ set up or the classic ‘slow down’ trade. Decide the trade by relying on one thing: volatility.
Let’s look at an example of both.
IV
The USO chart shown in Figure 10.2 had IV points and exploded, but the underlying was finding a floor.

The lower graph saw a peak at the same time the top graph was in the trough. IV exploded as the underlying dropped (between July and August). At those points, when IV was at its peak and the underlying was dropping, a bear 1 by 2 put spread would allow you to take advantage of the pop in volatility and let you ‘call a bottom’ because the spread created room for it.
With USO trading $9.33 and IV at 44% the strikes are shown in Figure 10.3.

To pick a bottom, you could set up a 1 by 2 by buying a 9 put for 0.75 and selling two of the 8.5 puts at 0.53 each. With the 0.31 credit taken in (1 put for 0.75 on the 9 strike, versus 2 puts sold at 0.53 on the 8.5 strike), USO could drop to $7.69 before you would be down on the trade.
What makes the trade work? The high IV and the extreme price. Traders are often paralyzed by the concept of selling puts on a major market move; a trade like this allows traders to take advantage of that movement. The risk is realized if the timing is wrong.
On the other side, if a stock rallies higher, a front spread can be a great way to fade a strong move up. It is dangerous to sell short calls on a stock that is off to the races, but when a stock rallies and IV does the same, that can signal that the stock price is going to slow down (look at AAPL price and IV in Figure 10.4).
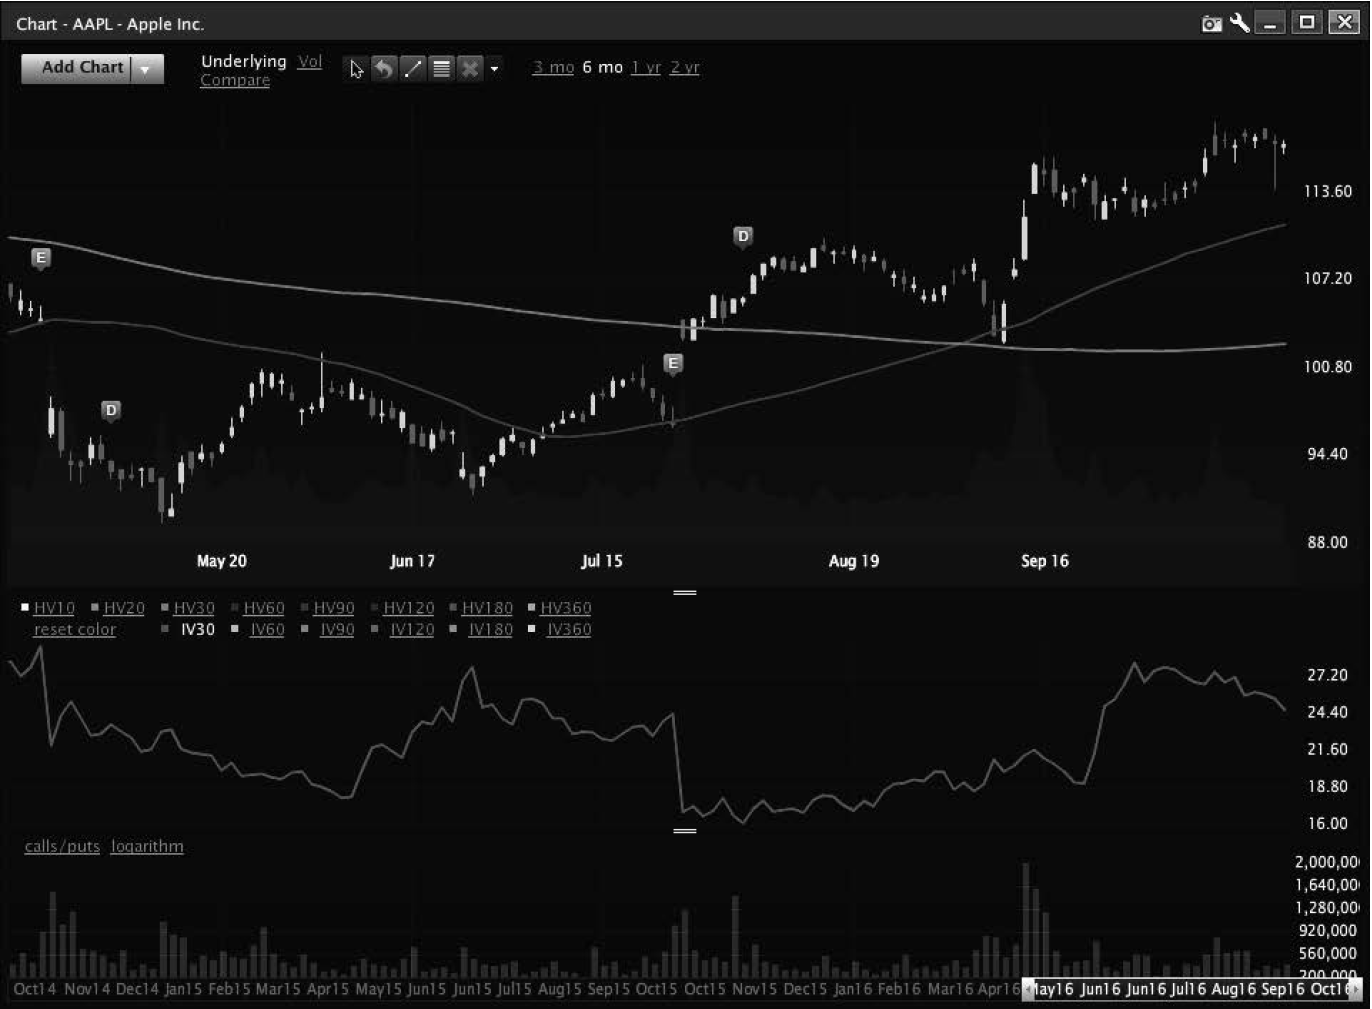
As AAPL broke out in mid-September, IV exploded. As the stock topped out, so did volatility. That is a setup for an amazing front spread. With the stock trading at $113, the structure in October options is shown in Figure 10.5.

You could have bought the 115 calls and sold the 117 calls, paying almost nothing. You would be buying the 115 calls for 0.95 and selling two 117 calls at 0.46 (a net debit of 0.03). In paying 0.03 for the spread, AAPL could run to $118.97 and still make money. If you bought the 115 calls and the underlying rallied, you would have made $10 for every $2 lost on the 117 contract. At expiration, if the 115s were worth 3.97 (with the underlying at $118.97) the 117s would be worth 1.97 each. The trade was up huge dollars, even as the underlying rallied. This is due to the combination of time decay and IV drop.
There are many other reasons to execute a front spread trade. They are excellent spreads for income trading, but executing on the back of a move in volatility makes these spreads more palatable.
Skew
The next key to a front spread is the potential behind a change in skew. The steeper the curvature in the direction of the trade, the more likely that trade is to be successful. Why? Because with a steep skew the trade will be likely to collect a greater credit for the same width of spread. In the example of an AAPL front spread in Figure 10.5, the October 117 calls had 0.03 of vega. What if you had bought the 115 calls for 18.38 volatility and sold 19 volatility instead?
Taking 0.67 (change in vol)*0.03 (vega) = 0.02 of extra premium in each 117 call.
The 117 calls would have a market of 0.46–0.48 or even 0.47–0.48, depending on how tight the market was. That would allow a front spread to collect 4 cents more in the trade at onset relative to what you would expect based on theoretical pricing. Four cents pays the commission in and out of the trade, and gives you an extra few pennies of yield to collect. It makes the trade easier.
You may be able to widen the spread out. While, in the AAPL case, that 1 point in volatility might only increase the credit by 0.04, in SPX as close as a week out, each strike can have vega near 0.50–1.00 per contract, depending on time and placement.
That extra premium allows you to move the front spread an additional $5.00 and receive a similar, if not better, credit. The curvature in the trade makes a huge difference in how you set up the strikes.
While volatility is the key to a good front spread trade, if skew is in the spread’s favor, it makes a front spread especially likely to succeed. When skew gets extra steep, that can be a sign that the move is likely to be nearing an end. The CBOE SKEW index tends to have a positive correlation with the market. When skew gets super steep, it’s bullish, and when flat, bearish. With a front spread looking for a turnaround, skew can be the difference between an easy winner and a hard-fought victory.
HV
The final piece to a good front spread is a slowing down of movement. Much like every other short premium trade, a profitable front spread expects movement to slow down (even more so, in many cases, than a condor or butterfly). A slowdown of momentum can be seen when HV drops while volume also drops. Let’s look at AAPL again.
Volume (the lighter portion of the price graph in Figure 10.6) peaked with HV (a lagging indicator). One day of falling volume was a dip; 2–3 days of falling volume led to sinking HV.

That sinking HV meant that the ‘nasty move’ was over and a continuing move meant it would slow down. More often than not, this means the smart money is selling their wins to the retail side. If you can set up a front spread near peaks when HV is starting to sink, combined with great IV and skew, the front spread will work.
The Broken Wing Butterfly
What is the difference between a broken wing butterfly and a front spread? Almost nothing. The broken wing buys an extra option away from the two short strikes. This is done for two reasons.
- Limit margin
- Limit risk
The trade looks just like a front spread. In AAPL, you could have set up a front spread expiring in three weeks that was long ATM, short about 3% OTM, and long 10% OTM, to reduce the margin on the trade and ensure that you did not ‘blow out’ if AAPL reversed (see Figure 10.7).

Aside from the reduced credit and limited upside, the two trades were practically identical.
Trade Management
There are two ways to manage these trades: aggressively or passively.
Aggressive Management
A trader typically manages delta of the position on a daily basis. When I was a floor trader, I traded to keep the delta of the position no more than twice my gamma; this allowed the position to move without needing to adjust (especially since adjustments reduce the profitability of a trade). Others kept it 1-to-1 on a daily basis, still others were much closer managers and let delta slip to 2 to 3 times gamma of the position. In managing delta, I used the stock or future, hedging with the underlying.
This method is appropriate if you use margin to trade these positions or trade the pure 1 by 2 positions because it will keep the trade from getting out of hand; no one wants a loss. Managing delta of a 1 by 2 ensures it doesn’t explode into an account blowing loser. I suggest going conservative and keeping delta at no more than 1-to-1 against a portfolio position. In Appendix A, managing delta over the course of a few days is explored.
Passive Management
This is more appropriate for the retail trader or those trading broken wing butterflies. In passive management, let the trade sit until the underlying gets to the long strike. Once this occurs, slowly buy close calls or puts from the short strike to reduce delta. In adjusting this way, you will see two things happen to the position. The trade will become net long contracts and the short gamma of the position will drop. As the gamma drops, the pain will be reduced; and if the underlying pops, your long contracts will kick in, allowing you to break even on continued momentum which, given the odds on a 1 by 2, sets up long-term success when these are executed repeatedly. We love these spreads because the odds work well for the consistent trader.
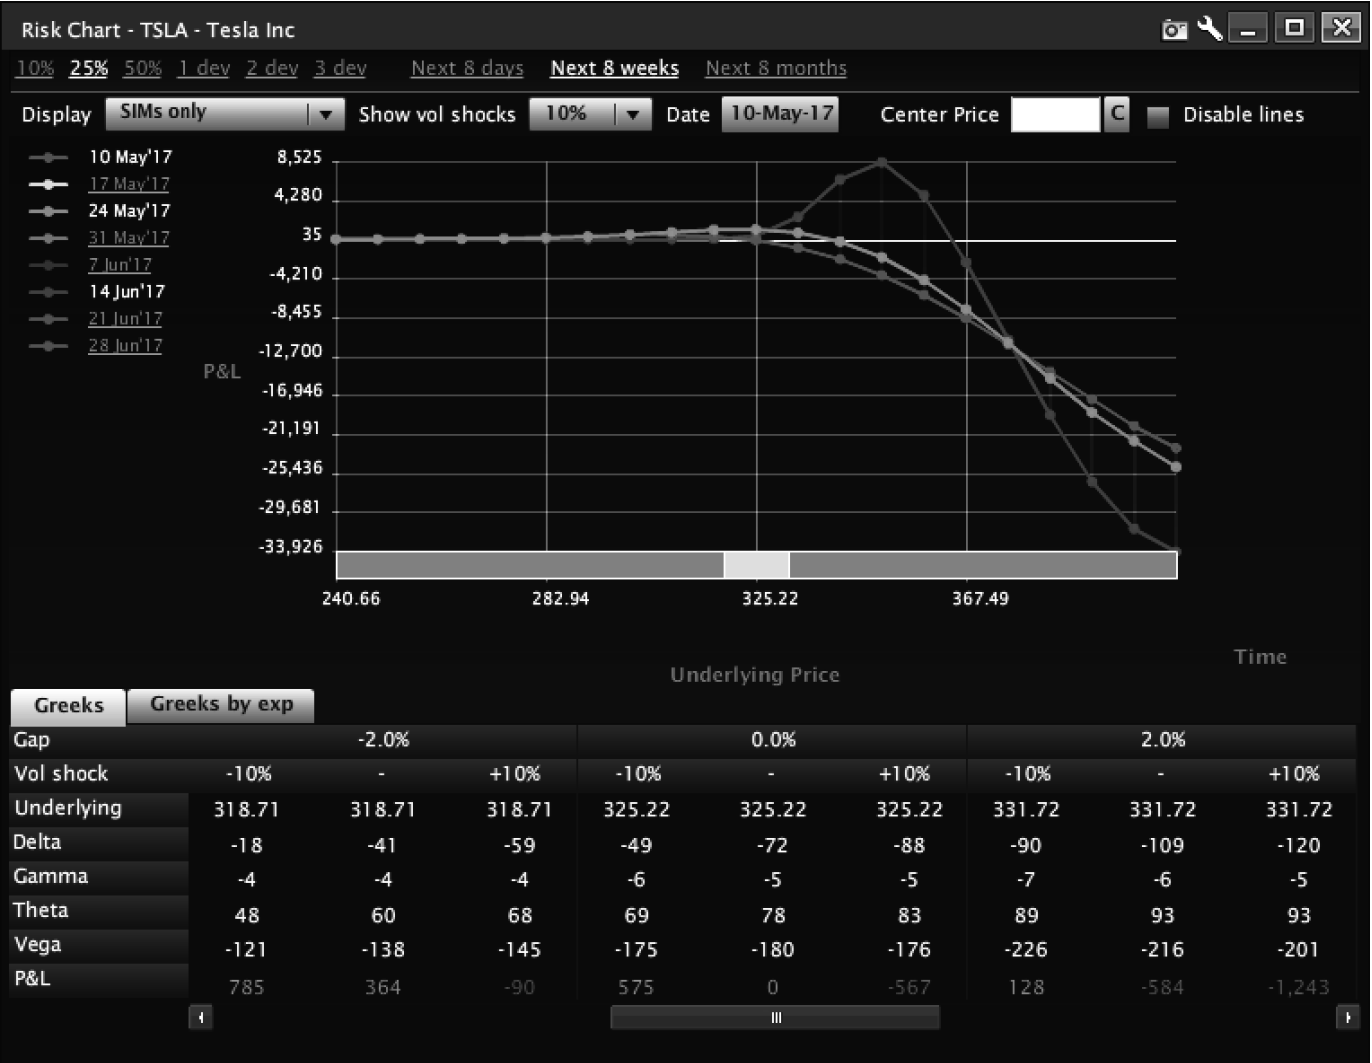
Beginning of Front Spread in TSLA
Let’s examine a front spread in TSLA:
At the onset, this is a classic front spread; you buy a near-the-money call and sell 2 OTM calls (see Figure 10.8).
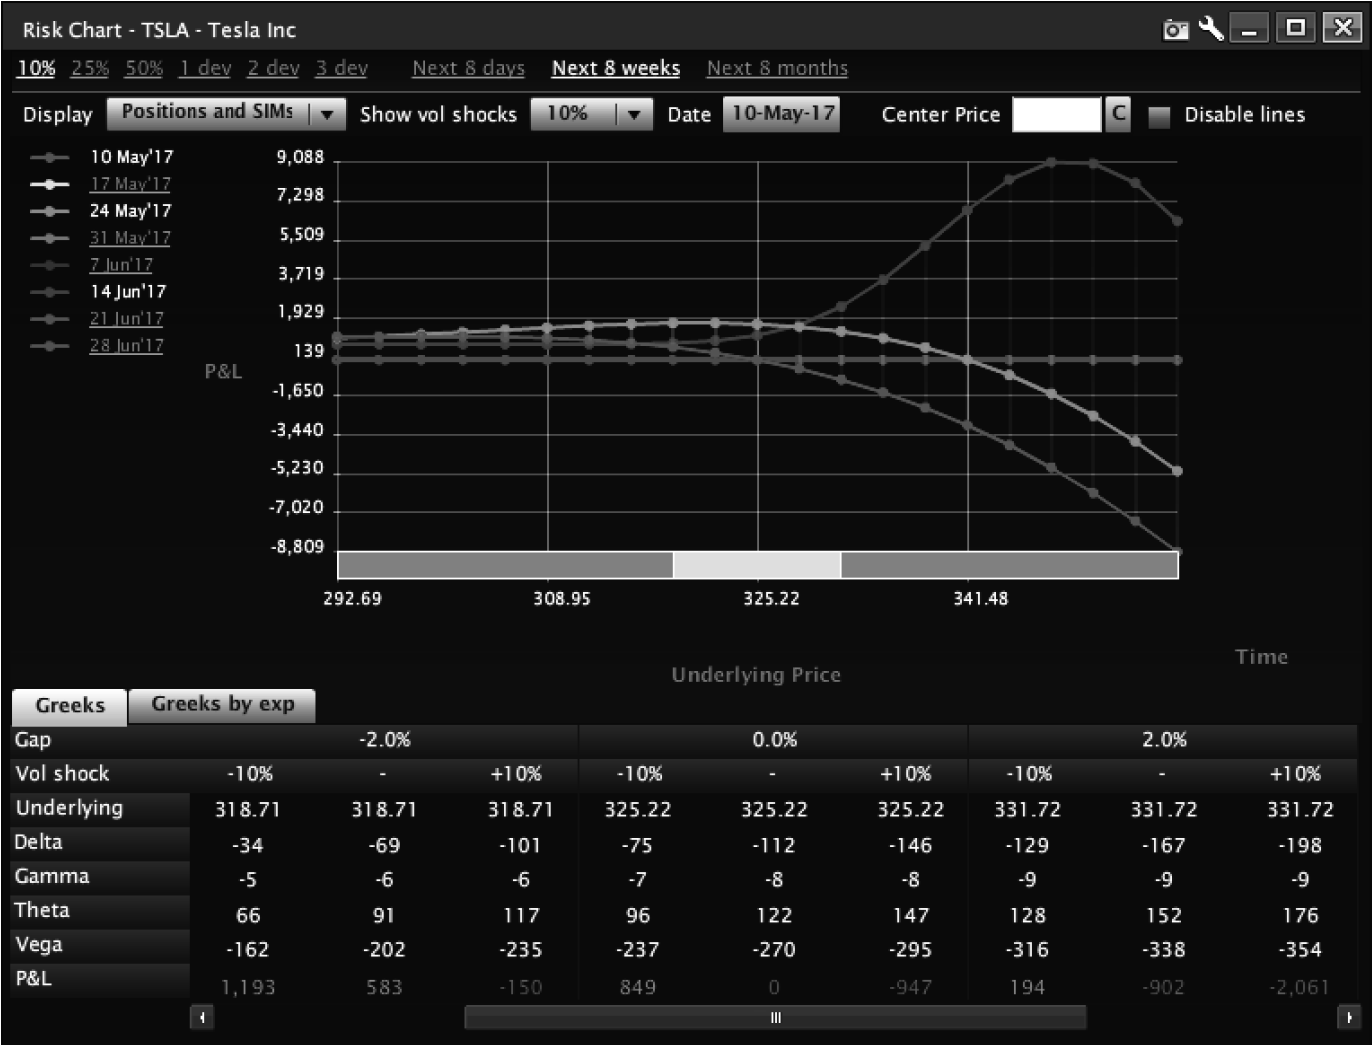
As the stock moves higher, you buy 3 350 calls to hedge off risk. This exploits the upward movement with an increased position on the long side. Figure 10.9 shows a TSLA front spread after a few days pass, managed with more calls.
If you aggressively cover, the underlying will not be a problem. The trade can have a P&L curve much like graph number one, where a strong move puts the trader in real trouble.
At this point, cut the delta in half every time it increases to the point that it ‘takes over’ the position. If you cut delta in half when delta starts to be the number one concern, you have a chance to make the front spread work. You can do this by buying calls or buying the underlying to handle delta. In the above example, you bought calls. This meant keeping delta in a position that it would not be so high that a move against you would put the entire position in peril. This means keeping delta at two times gamma. You can also look at the P&L of the position to manage risk. Never lose more than you are trying to make—as that becomes in doubt, delta should be cut.
Target Profit
Do not look at the margin unless you are on PM (portfolio margin). The margin associated with front spreads is high relative to risk. I prefer to look at these in terms of how much I am willing to lose, and set my P&L targets there. Thus, if I am willing to lose $500 on a trade, I shoot for $500–1,000 in profit. That is equivalent to selling a 1 by 2 at 0.30 and covering it for a 0.30 credit.
Front Spread checklist:
- What is the probable direction of the trade?
- What is the IV?
- What is the skew?
- Where is the momentum and HV?
- What is the target for the trade?
Using this checklist, you can develop a profitable front spread and a set of front spread trading positions.
Broken Wing Butterfly Variation
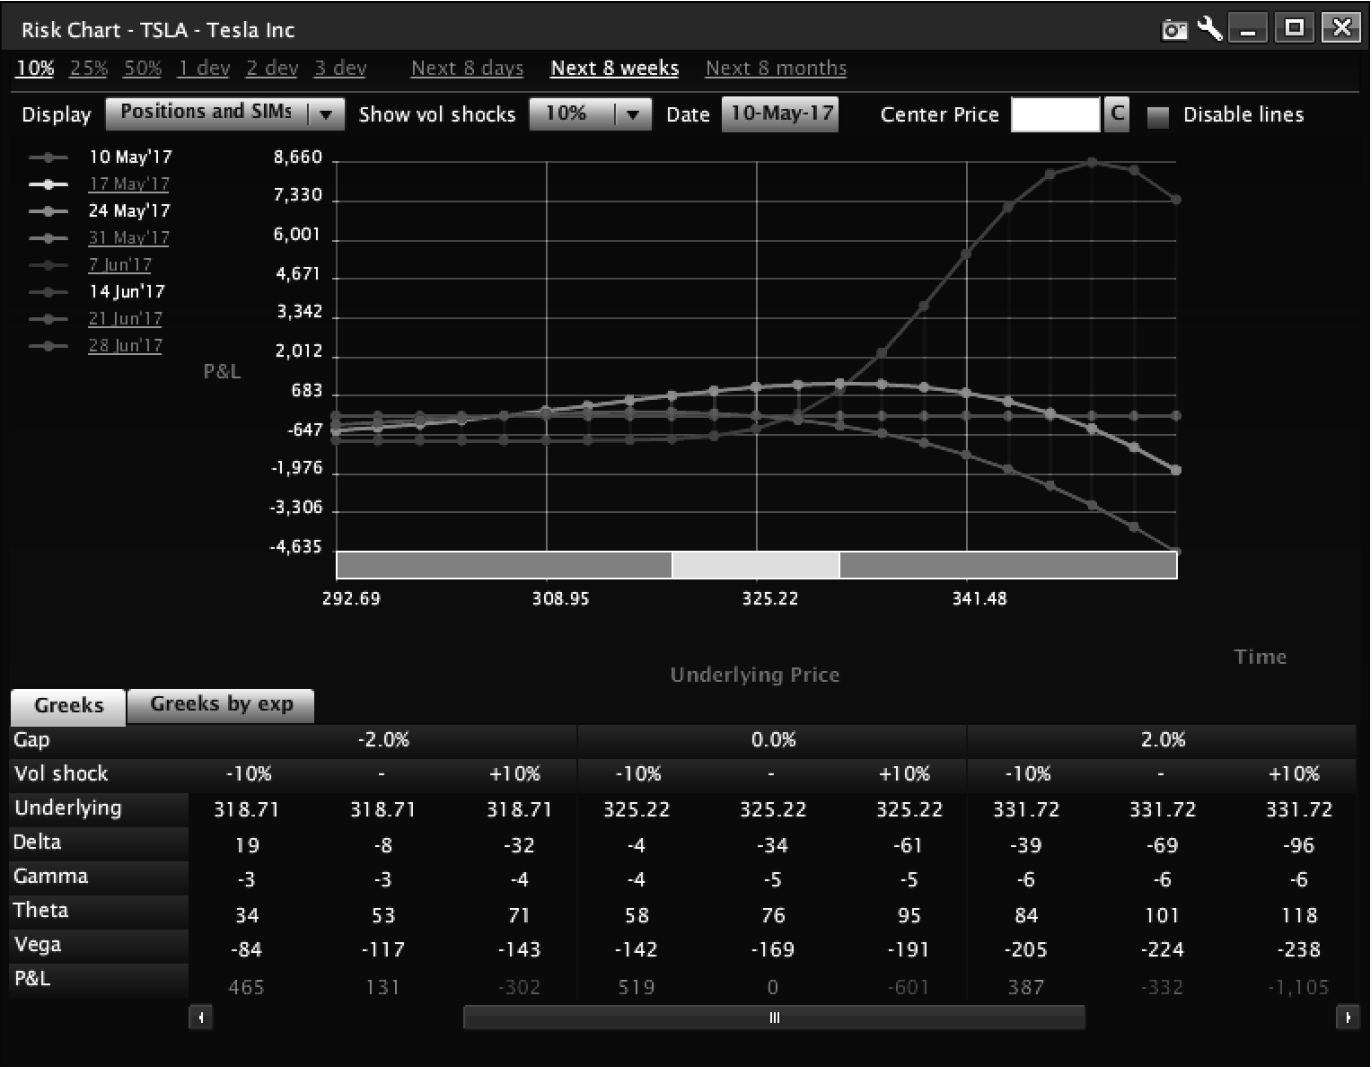
Returning to the TSLA example, a variant is the broken wing butterfly (as discussed earlier in this chapter). This is a front spread combining one long contract close to the money, with two short contracts out of the money. It is much like a front spread, but your long contract is further away from the two shorts. This reduces margin. The net of the trade produces a credit but limits risk if the underlying keeps moving (see Figure 10.10).
The chart looks a lot like a front spread, however, margin is reduced because you own an OTM call. Trading a broken wing is almost exactly like trading a front spread. The difference is that as the underlying rallies and you cover, the position loses less. Consider the broken wing butterfly as an alternative to the front spread.