4
Income and Wealth Inequality
ALICE RIVLIN, FOUNDING DIRECTOR of the Congressional Budget Office, former vice chair of the Federal Reserve Board, and for years an economic scholar of renown at the Brookings Institution in Washington, D.C., had this to say just before her passing in May 2019:
When we look deeply at the political and cultural divisions cleaving the United States, we consistently find extremes of inequality adding fuel to these fires. Stark differences in current economic security and future prospects bring fear, distrust, and resentment. A truly great country . . . would rise to the challenge to heal the wounds of hate and division by giving all Americans opportunities to participate in a growing economy that offers them shared prosperity.1
Income and wealth inequalities have been problematic across the globe for decades. Capitalism, as it has come to be pursued through widespread use of the financial secrecy system, is a principal contributor to economic divisions. The global financial crisis of 2007–2008 and the global pandemic beginning in 2020 underline the urgency of resolving inequities that are now so evident and so threatening to prosperity and progress.
POVERTY
Before going forward into income and wealth inequality, commentary on poverty is appropriate. The world knows how it should be dealing with poverty, and the urgency to do so is morally compelling. The extent of poverty has declined globally, with startling reductions achieved in the last quarter century. Capitalism is attuned through charitable instincts to exert at least some modest efforts toward ending poverty. But capitalism frankly does not know how to curtail widening inequality, and inequality is the far greater threat to democracy. Ending poverty is a vital but insufficient step for achieving a more sustainable world. This book is about changes required within capitalism if it is to contribute its full share toward the continuance of democracy.
Having said this, a few points about poverty are appropriate here. In 2018 the World Bank reported that across the 25 years from 1990 to 2015, the number of people living in extreme poverty, defined as $1.90 or less per day in purchasing power parity, declined from some 2 billion to 736 million, that is, from 36 percent to 10 percent of the world’s population (not including South Asia). Much of this progress occurred in East Asia and the Pacific region, with China achieving dramatic change, lifting hundreds of millions out of poverty. Sub-Saharan Africa, unfortunately, is moving in the opposite direction, with the number living in extreme poverty rising from 278 million to 413 million across the period, half of them children, with oil-rich Nigeria leading the way. Taking the broad view, François Bourguignon, former chief economist of the World Bank, draws the picture as follows:
For the first time since the Industrial Revolution two centuries ago, economic progress is moving more quickly than population growth, . . . overwhelmingly because of accelerated growth in average income per capita in the developing world. This is a stunning turn of events.2
Additional measures of poverty indicate that a quarter of the world lives on less than $3.20 a day, and almost half of the world lives on less than $5.50 a day. Multidimensional definitions of poverty encompassing education, consumption, and access to infrastructure paint a much more extensive picture of poverty than can be conveyed in monetary measures alone and indicate that half the poor within this broader definition are under 18 years of age. Societal poverty lines, which the World Bank introduced in its 2018 analysis and take into account hundreds of measures, interpret poverty as relative to the communities and nations in which it exists. By this measure, nearly 30 percent of the world is living in poverty. Even pre-COVID, the Food and Agriculture Organization said that three billion people around the world cannot afford a healthy diet.
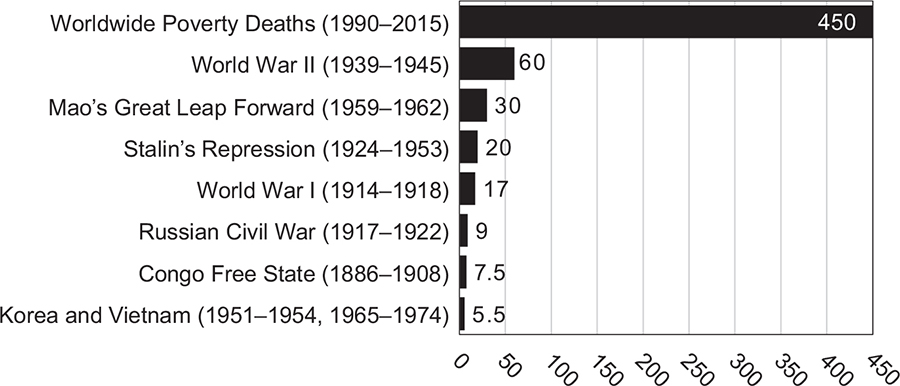
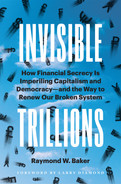
FIGURE 4.1 Deaths due to violence and poverty (in millions)
Source: Compiled by Professor Thomas Pogge, Yale University. Used with permission.
Yale philosopher Thomas Pogge estimates that 18 million people a year die of poverty-related causes. This is about 50,000 a day, more than 2,000 an hour, more than 30 a minute, more than 60 since the reader began turning the pages of this chapter. The comparison in figure 4.1 to examples of violent deaths in previous cataclysms drives the point home. Some longtime observers find the enormity of this reality, particularly when compared to more widely recalled conflicts and tragedies, the most compelling case for curtailing extreme poverty.
For many people there is an unfortunate side effect arising from the focus on poverty. It detracts from focus on the separate problem of inequality. It makes the richest and most ardent within capitalism think that aiding the needy is the extent of responsibility toward the world’s less fortunate. The positive duty to be charitable sufficiently overrides any negative duty to do no harm. The comforting argument is, help the poor become somewhat better off, and the rich can rise to unlimited heights. Capitalism has no answer to rising inequality and therefore asserts that only poverty is important. This kind of thinking, carried deeper into the twenty-first century, will undermine the democratic-capitalist system.
INCOME INEQUALITY
Inequality has been with us forever, addressed in cogent and troubled writings by Plato, St. Thomas Aquinas, Hobbes, Rousseau, and scores of other early thinkers. The world has survived, so why worry? Because they were writing when the world had fewer than 1 billion people, and today the world has 8 billion people, rising to a predicted 10 billion people or more by the end of the twenty-first century (figure 4.2). This is a quantitative and qualitative difference. Put aside any idea that the past is adequate prologue for the future. In this century of staggering income and wealth disparities, those who feel disadvantaged and downtrodden will force change, and those who are exceptionally fortunate must accept and encourage change. The combination of population pressures and economic motivations will be unrelenting.
As population soars, capitalism drives inequality. Globalization, technology, and financial deregulation are frequently cited as explanations for the separation between rich and poor. Each of these realities is important, but underlying all explanations is capitalism’s new motivation for secrecy and the structures created to facilitate secrecy, mechanisms that are dedicated to moving and hiding illicit and opaque income and wealth.
With this structure in place, more countries are experiencing rising income inequality than falling income inequality. Gini coefficients, a measure of inequality preferred by economists, reveal the same conclusion in each of four careful studies of this phenomenon as depicted in figure 4.3. Quite simply, citizens across the globe are correctly sensing that inequality is widening and that for many, personal prospects are narrowing.
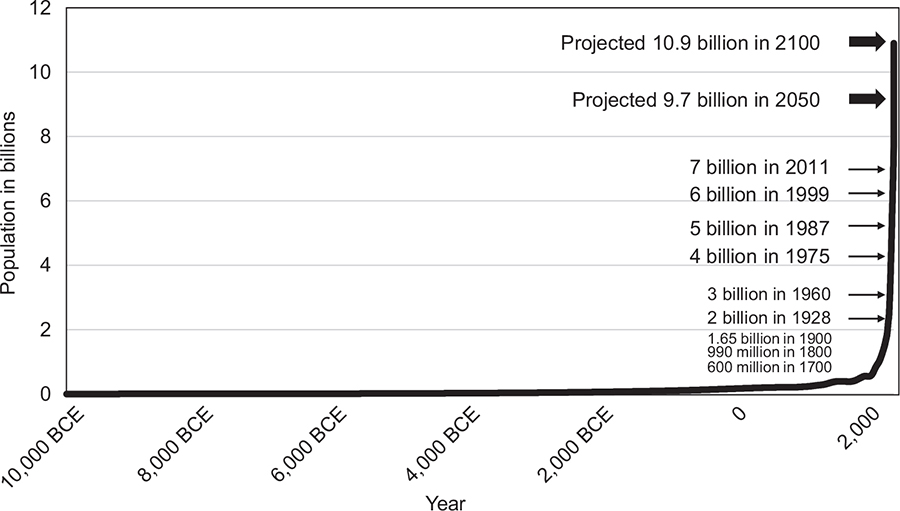
FIGURE 4.2 World population over the last 12,000 years
Source: Max Roser, Hannah Ritchie, and Esteban Ortiz-Ospina, “World Population Growth,” OurWorldInData.org.3
FIGURE 4.3 Countries with changes in income inequality (by source)
Source: Prepared by the author using data from Branko Milanovic, the World Bank, the University of Texas Inequality Project, and the World Income Inequality Database.4
Increases in income shares of the top 10 percent of the population are evident in major countries, as shown in figure 4.4.
Increases in income shares of the top 1 percent show the most dramatic change. The World Inequality Database demonstrates rising income shares of the most privileged elite in each country analyzed in figure 4.5.
Angus Deaton, Nobel Prize winner and Princeton University professor, lamenting the “grotesque expansions in inequality of the past 30 years,” argues as follows:
[L]arge differences in income are fueled by . . . and can further feed self-serving actions by well-placed groups to increase their own income at the cost of both economic growth and democratic governance. When whatever growth exists is not shared, new problems arise. Those who are left behind may be patient when they are getting something, but if their incomes are flat or declining, they are unlikely to remain patient for long. Inequality becomes a political issue. Ideally such dissatisfaction will bring political change. But if the political system is sensitive only to the needs of the wealthy—something that is arguably true in the U.S. Congress—there is a direct threat to political stability and, ultimately, to democracy itself. If the main political parties offer nothing to those who are excluded, they may turn to political remedies or candidates that threaten liberal democracy.7
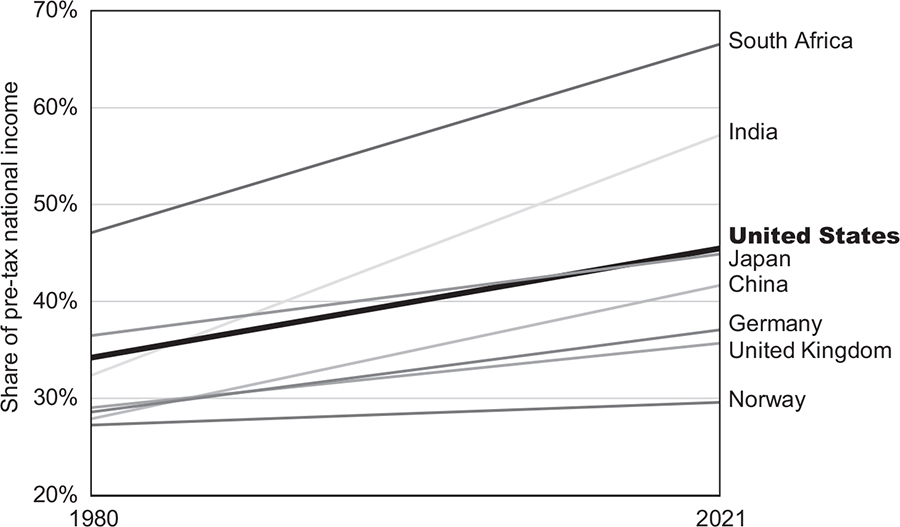
FIGURE 4.4 Share of income held by top 10% (1980–2021)
Source: Prepared by the author using data from the World Inequality Database.5
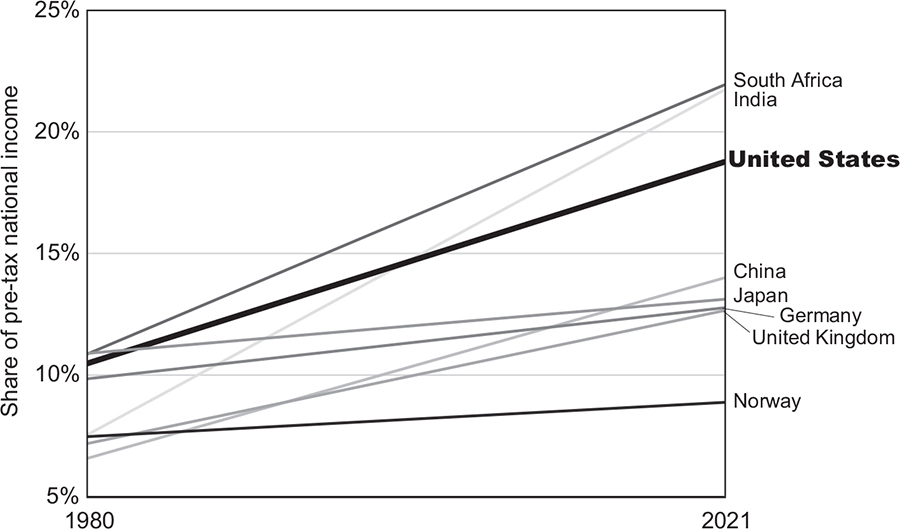
FIGURE 4.5 Share of income held by top 1% (1980–2021)
Source: Prepared by author using data from the World Inequality Database.6
Two broad conclusions are generally agreed: income differences between many countries are declining, while income differences within many countries are rising. The decline in between-country incomes is particularly driven by rising national incomes in China, India, and other Asian states as these nations adopt technologies and move toward middle-class status. The rise in income differences within countries is certainly influenced by astonishing growth in the billionaire class and apparent stagnation in middle-class incomes in many richer countries such as the United States. Stagnation is sometimes disputed; what is not disputed is a belief, a perception, that stagnation is real, affecting lives and prospects.
IMPACT OF THE FINANCIAL SECRECY SYSTEM
None of the studies of income inequality, whether with Gini coefficients or by decile or quintile groupings, adequately take into account hidden income, the very purpose of the financial secrecy system. Trillions of dollars are stashed invisibly outside of citizens’ countries, not showing up in national accounts or taxpayers’ filings.
Thus, the financial secrecy system directly links to inequality. The most commonly utilized element within this secrecy system is trade mis-invoicing, the deliberate mispricing of cross-border trade for the specific purpose of shifting revenues and profits across borders in a hidden manner. Percentages by which trade is misinvoiced correlate to rising Gini coefficients, as shown in figure 4.6 covering 58 emerging market and developing countries. The principal operating component of the financial secrecy system—falsified trade—draws money out of dozens of countries, further impoverishing billions of people. For each region of the world, as trade misinvoicing goes up, inequality goes up.
The secrecy motivation now entrenched within capitalism, using the supporting structures of tax havens, secrecy jurisdictions, disguised corporations, anonymous accounts, and more, is a direct cause of income inequality that degrades the quality of life for women, men, and children across the globe. The word “cause” is used intentionally, meaning more than a simple correlation of two measures. Taking hundreds of billions of dollars out of emerging market and developing countries, accumulating to trillions of dollars permanently transferred into wealthier countries, leaves poverty and inequality in its wake.
For half a century beginning in the 1960s, Western development experts, those scholars and practitioners engaged in efforts to bring economic prosperity to poorer nations, failed to put both sides of the development equation on the table: total money in and total money out. A collective ethos within the discipline focused on aid and investment going into developing countries and completely failed to ask what is coming out of developing countries. Not that they ignored available data; they did not ask the right questions.
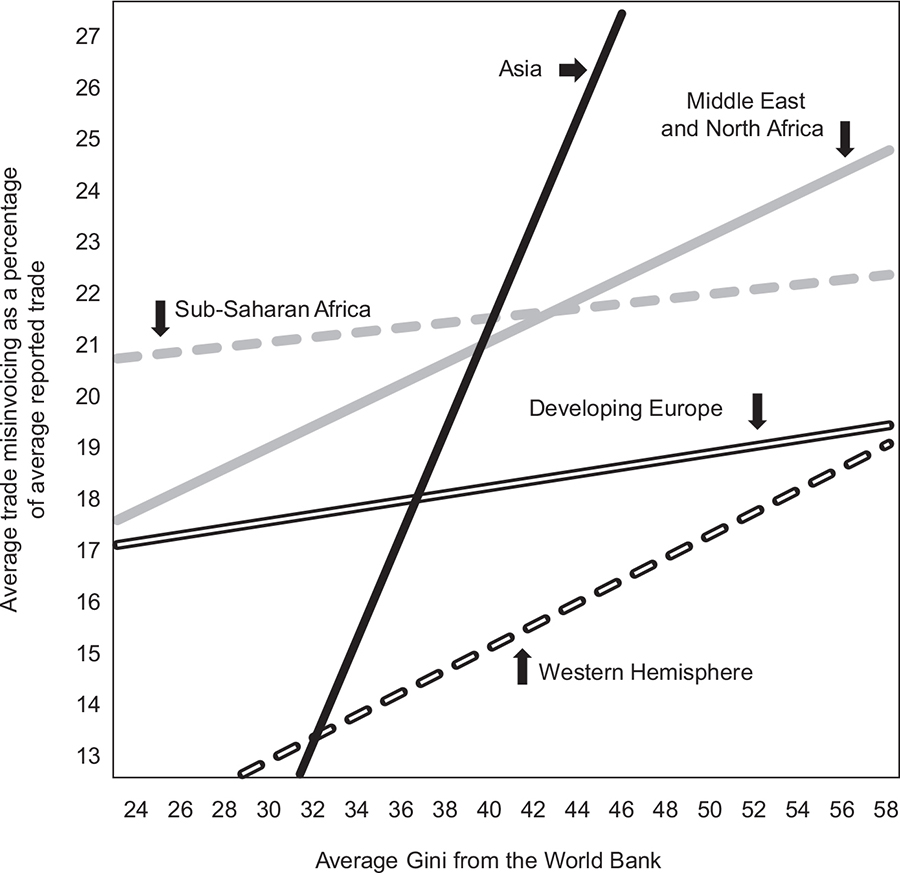
FIGURE 4.6 Trade misinvoicing between reporters and partners versus inequality (2012–2016)
Source: Global Financial Integrity. Used with permission.
How is this possible? Other branches of the economics profession were admirably asking the right questions within their spheres. Yet, with tens of millions of people dying of economic deprivation and hundreds of millions of people living lives of utter desperation, how does a focused group of development professionals disregard something so basic? Well, this much is going into developing countries; how much is coming out of developing countries? A few early papers guardedly attempted to address flight capital, money invested abroad, without making an effort to determine how much was legal and stayed on the books of countries from which it came and how much was illegal and disappeared from any record in the countries from which it came. The question has been asked many times, “How did such a basic deficit in the discipline occur over so many decades?” No answer has ever been offered.
Jean-Paul Sartre, twentieth-century existentialist, speaks of “the moment at which the question transforms the questioner.”8 For virtually the entire community of development experts, this moment never arrived.
There was one notable exception. A Burundian economist, Léonce Ndikumana, and his colleague, James Boyce, both at the University of Massachusetts, began in the late 1990s to address the illicit component of money emerging from developing countries. Others advanced their work a few years later, and today a number of analysts are coming to grips with magnitudes and methodologies surrounding the measurement of resource flows from developing countries. The World Bank and the IMF, addressed further in chapter 10, are, with extreme reluctance, tiptoeing into the arena, half a century too late for billions of people.
Wealthy Countries Too
Nor is this an issue limited only to developing countries. Across the last half century trillions of dollars have poured out of wealthy countries into secrecy sinks, hiding and sheltering money and evading and avoiding taxes. Economic titans in past generations at least kept their money at home. Today, megawealthy titans and major corporations take much of their money abroad. Trickle-down economics does not work when streaming-out economics is the norm.
A growing group of analysts is finally focusing on economic inequality in both richer and poorer countries. Thomas Piketty’s book Capital in the Twenty-First Century, first appearing in French in 2013 and since translated into 40 languages, has sold 2.5 million copies worldwide. Piketty merits singular praise for asking the right questions, the hard questions, and then courageously addressing these questions with answers couched in orders of magnitude. Chastising his fellow economists (case in point, development economists who for 50 years failed to ask the right questions), he persuasively argues that “economics should never have sought to divorce itself from the other social sciences and can advance only in conjunction with them.”9
Addressing the world’s richest nation, Piketty says:
Since 1980, however, income inequality has exploded in the United States. The upper decile’s share increased from 30–35 percent of national income in the 1970s to 45–50 percent in the 2000s. . . . [T]he United States may set a new record around 2030 if inequality of income from labor—and to a lesser extent inequality of ownership of capital—continue to increase as they have done in recent decades. The top decile would then claim about 60 percent of national income, while the bottom half would get barely 15 percent.10
Not all the causes of income inequality are hidden from view. Everyone knows that executive pay has exploded since the end of the 1950s. The Economic Policy Institute (EPI) based in Washington, D.C., produced the analysis in figure 4.7, showing CEO pay at the top 350 US firms at 351 times worker pay, up from less than 20 times worker pay in the post–World War II era, lauded by Tom Brokaw in his book as “The Greatest Generation.”
Commenting on its 2020 analysis, EPI states that
escalation of CEO compensation, and of executive compensation more generally, has fueled the growth of top 1.0 percent and top 0.1 percent incomes, generating widespread inequality.
[An] implication of rising pay for CEOs and other executives is that it reflects income that otherwise would have accrued to others: What these executives earned was not available for broader-based wage growth for . . . workers. It is useful, in this context, to note that wage growth for the bottom 90 percent would have been nearly twice as fast . . . had wage inequality not grown. Most of the rise of inequality took the form of redistributing wages from the bottom 90 percent to the top one percent.12
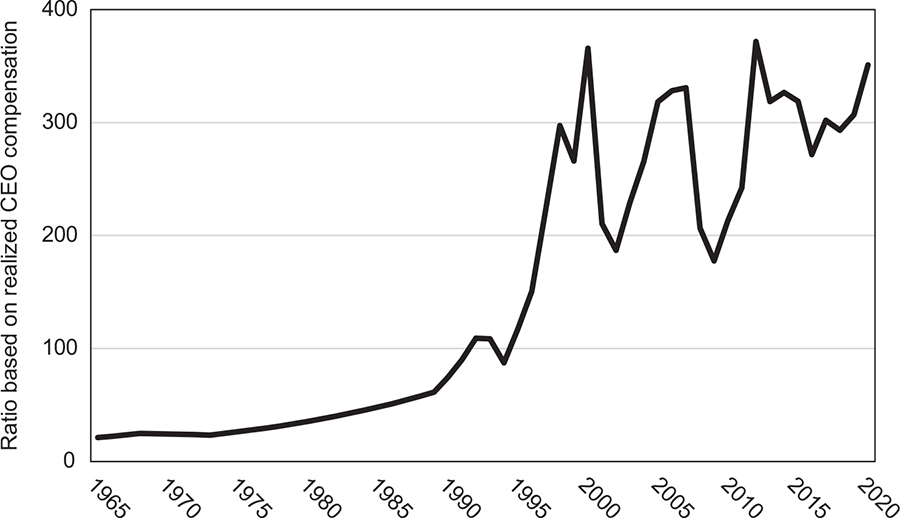
FIGURE 4.7 CEO-to-worker compensation ratio (1965–2020)
Source: Chart prepared by Lawrence Mishel and Jori Kandra, Economic Policy Institute. Used with permission.11
As billionaire and millionaire classes get richer, workers receive a declining share of national income, a phenomenon experienced in major countries since 1980 and, as illustrated in figure 4.8, since 2014. Deborah Hargreaves, studying both the United States and the United Kingdom, nails the importance of this issue:
It is time for the business sector to listen to the moderate voices for reform or reap the consequences of growing inequality, anti-business sentiment and possibly more dramatic clashes. If we don’t rise to the challenge, the fundamental trust that makes a liberal market democracy function could be damaged beyond repair. We run the risk of sleepwalking into a dystopian future of extreme income disparities and the unrest that could bring.14
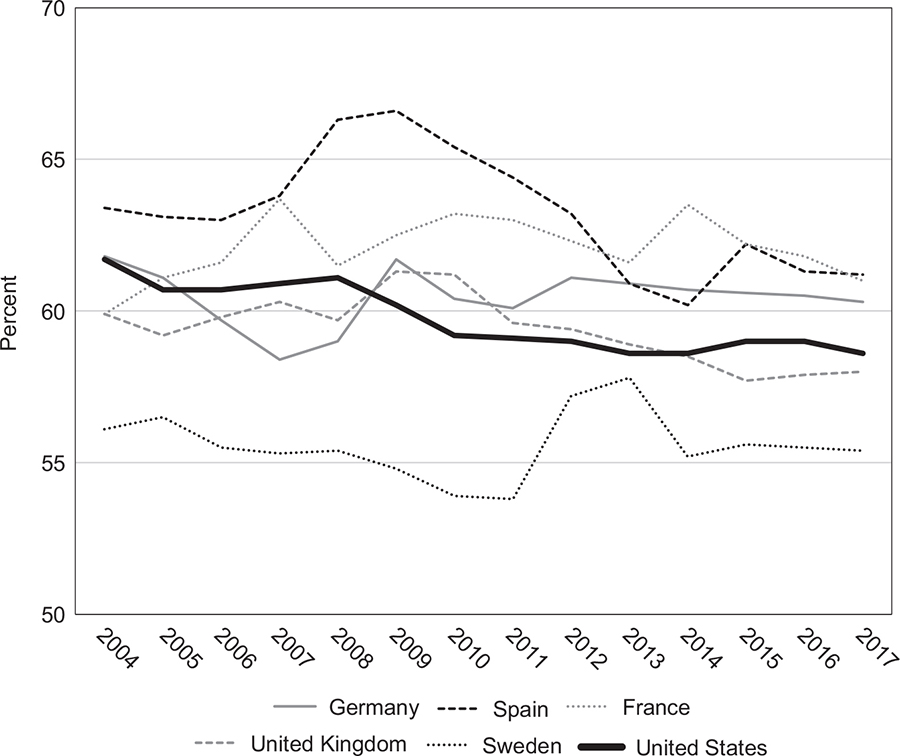
FIGURE 4.8 Labor income share as a percentage of GDP
Source: Prepared by the author using data from the International Labour Organization.13
Fading Optimism
The American dream of living better than one’s parents is withering. Creatively utilizing tax and census data, a team of Stanford, Harvard, and University of California, Berkeley, scholars led by Raj Chetty produced an extraordinary analysis showing that, whatever one’s income group at birth, chances are strong that income levels would be less than that of their parents. Hardest hit are those born in the sample years 1960, 1970, and 1980, with only about a 50–60 percent chance of exceeding the income level of their parents, as shown in figure 4.9.
Explaining further the import of their findings, Chetty et al. state that
children’s prospects of earning more than their parents have faded over the past half-century in the U.S. The fraction of children earning more than their parents fell from approximately 90 percent for children born in 1940 to around 50 percent for children entering the labor market today. . . . 16
[Income] mobility fell particularly sharply in the industrial Midwest, where rates . . . fell by 48 percentage points in Michigan and about 45 percentage points in Indiana, Illinois, and Ohio.17
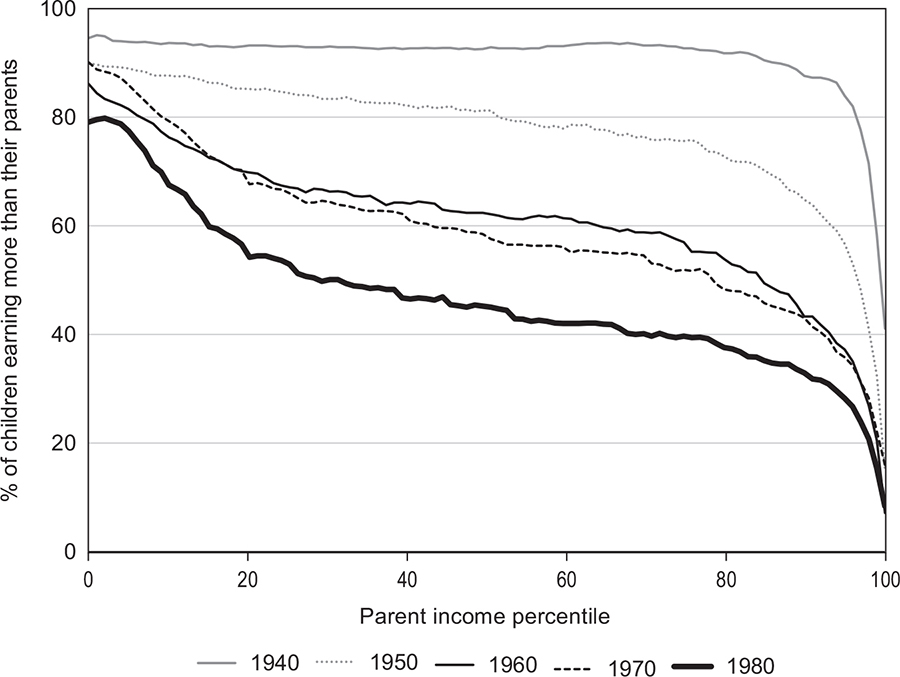
FIGURE 4.9 Diminishing odds of upward mobility
Source: Raj Chetty et al., “The Fading American Dream: Trends in Absolute Income Mobility since 1940.” Used with permission.15
The New York Times effusively praised this analysis:
Research has shown that people’s happiness is heavily influenced by their relative station in life. And it’s hard to imagine a more salient comparison than to a person’s own parents. . . . [This is] a portrait of an economy that disappoints a huge number of people who have heard that they live in a country where life gets better, only to experience something quite different. Their frustration helps explain . . . Americans’ growing distrust of nearly every major societal institution, including the federal government, corporate America, labor unions, the news media, and organized religion. In the industrial Midwestern states . . . going backward is the norm.18
“Going backward” is certainly not the result of working less and producing less in the United States, and this is also true in many more high-income countries. The value of what workers are producing outstrips their participation in these gains (figure 4.10). The Global Wage Report 2018/19 states that
the decoupling between wages and labour productivity explains why labour income shares (the share of labour compensation in GDP) in many countries remain substantially below those of the early 1990s.19
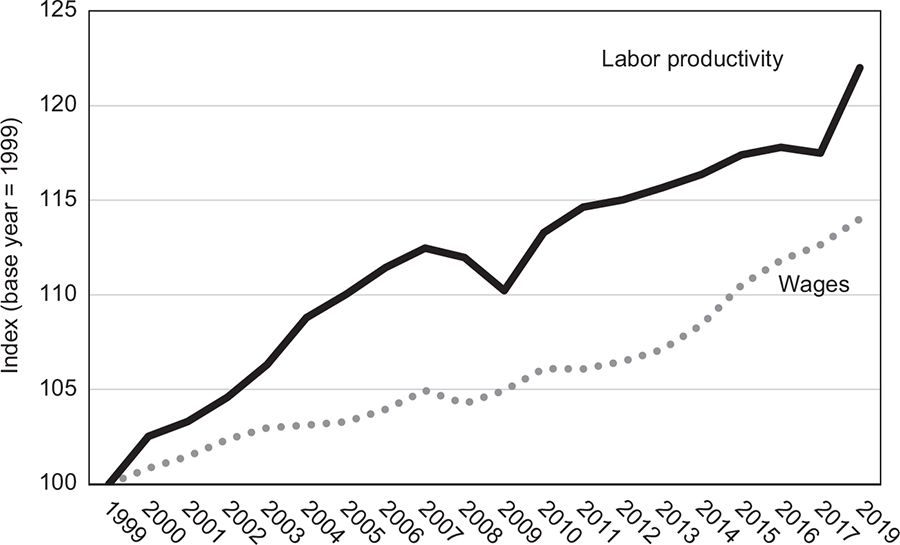
FIGURE 4.10 Trends in average real wages and labor productivity in high-income countries
Source: Chart from the International Labour Organization.20
Singling out the United States, an Economic Policy Institute analysis demonstrates a widening gap between workers’ productivity and pay (figure 4.11). Post–World War II years were quite stable, with separation beginning in the early 1980s and continuing since.
Economic analysts typically prefer to ask “what” based on hard data rather than “what if” based on conjecture. In a stunning piece of work, an economist and a mathematician at Rand Corporation joined forces to examine the relatively modest levels of income disparities in the United States in the post–World War II years and asked what if such modest levels of disparities continued up to the present, that is, rising in proportion to GDP. What they found was that
the rate of income growth at the median of the distribution was less than one third of the rate of growth of real per capita GDP. Unlike the growth patterns in the 1950s and 1960s, the majority of full-time workers did not share in the economic growth of the last forty years, . . . did not share in the benefits of economic growth to any significant degree.
From 1975 to 2018, the difference between the aggregate taxable income for those below the 90th percentile and the equitable growth [consistent with GDP] totals $47 trillion.22
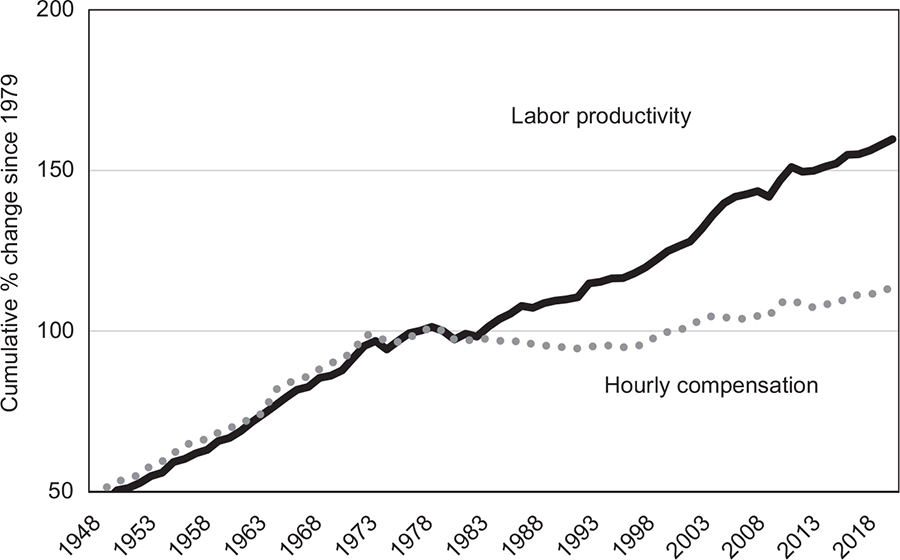
FIGURE 4.11 Productivity growth and hourly compensation growth (1948–2019)
Source: Chart by Lawrence Mishel, Economic Policy Institute. Used with permission.21
In other words, 90 percent of US workers are cumulatively $47 trillion behind where they would be if they had just held their own as the economy grew. Add two more years and this can no doubt be rounded to $50 trillion. Commenting further on this study, two analysts put it bluntly:
Whatever your race, gender, educational attainment, urbanicity, or income, the data show, if you earn below the 90th percentile, the relentlessly upward redistribution of income since 1975 is coming out of your pocket.23
Emmanuel Saez and Gabriel Zucman, both at the University of California, Berkeley, also delve into the “counterfactual” question:
If macro growth had been equitably shared from 1980 to 2018, the average pre-tax income of the bottom half of the income distribution would have been 57 percent higher in 2018 that it was in actual fact.24
Especially hard hit are millennials, those born between 1981 and 1996, called “the unluckiest generation in U.S. history”:
The Great Recession pushed young workers a few steps down the wage ladder. Research shows they never recovered. . . . It’s happening again, to many of those same young workers.25
William Gale at the Brookings Institution, together with other colleagues, agrees:
Substantial economic inequality has been an enduring fixture of millennials’ adulthood. While every generation faces its own unique opportunities and challenges, many people feel that the obstacles facing the millennial generation are especially acute.26
Decades of working hard and sharing less, coupled with growing frustrations of younger generations, have now caught up with the United States and other countries. Severe economic inequality exacerbates perceptions of other differences, including those of race, gender, and origin. Shared economic prosperity, if real, can moderate the impact of such differences.
But this reality—income inequality—is not the worst of the picture. Wealth inequality is far greater, threatening stability within and across nations.
WEALTH INEQUALITY
The wealth of the Walton family, controlling shareholders of Walmart, is increasing at $100 million a day. Newly hired Walmart associates are reportedly paid about $100 a day. Is this capitalism performing at its best—$100 million a day versus $100 a day?
For those Americans who hold much of their wealth in stocks, the 40-year run-up in share prices has been stunning (figure 4.12). For those who are dependent on an hourly wage, grounds for decades-long angst are real.
Thomas Piketty points out that wealth inequality is always more than income inequality and has been throughout history. “The distribution of capital ownership (and of income from capital) is always more concentrated than the distribution of income from labor.”28 In his starkest statement, Piketty says that “the consequences for the long-term dynamics of . . . wealth distribution are potentially terrifying.”29
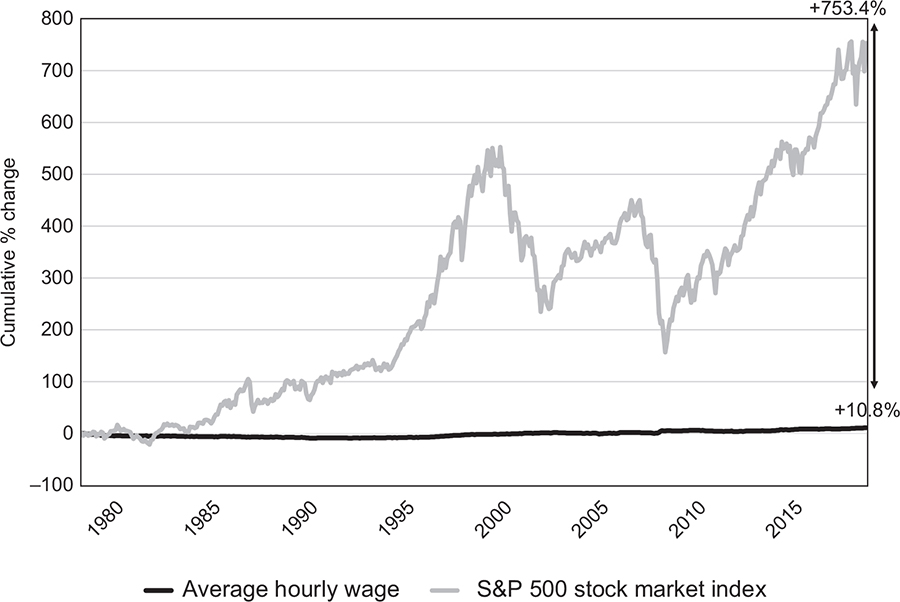
FIGURE 4.12 Stock market growth versus wage growth (1979–2019)
Source: Chart prepared by Institute on Taxation and Economic Policy, using Federal Reserve economic data and S&P 500 historical data. Used with permission.27
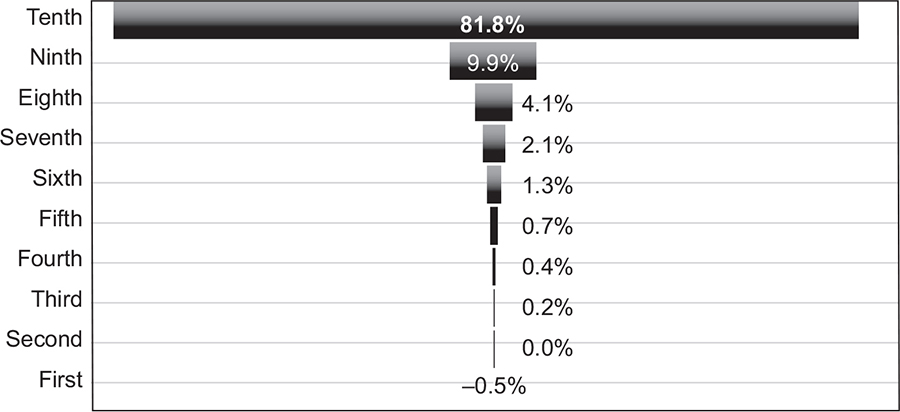
FIGURE 4.13 Share of global wealth (by decile)
Source: Prepared by the author using Credit Suisse data.30
The best depiction of wealth inequality is provided in funnel charts as in figure 4.13, derived from Credit Suisse’s 2021 Global Wealth Report. Nearly 82 percent of global wealth belongs to the top 10 percent, leaving only 18 percent of wealth for the bottom 90 percent. In fact, Credit Suisse indicates that the bottom 10 percent have a negative net worth, with debts exceeding assets.
Currently, global wealth is more than $400 trillion, tripling in real dollars in the last 20 years. Of this, the wealthiest 1 percent alone are now pushing toward half the total (figure 4.14).
And even these wealth measures are probably underestimated because they may not take fully into account money stashed in secret outside citizens’ countries of origin. Gabriel Zucman and colleagues combined information from the previously mentioned Swiss Leaks records of HSBC Private Bank holdings, the names of account holders revealed in the Panama Papers, and income and wealth records from three Scandinavian countries: “[A]bout 90–95% of all individuals on the HSBC list that could be matched to a tax return did not report their Swiss bank account.”32 Focusing on the wealthiest: “We find that the top 0.01% of the wealth distribution . . . evades about 30 percent of its taxes. . . . [R]esults found in Scandinavia are likely to be a lower bound for most of the world’s countries.”33
Broadly, these researchers estimate that about 10 percent of global GDP is held in offshore havens, which currently would amount to about $8 trillion. The Organisation of Economic Co-operation and Development (OECD) recently reported an estimate of $11 trillion.34 James Henry produced substantially higher figures in 2013, estimating that $21 to $32 trillion is in “hidden financial assets held offshore.” He goes on to comment as follows:
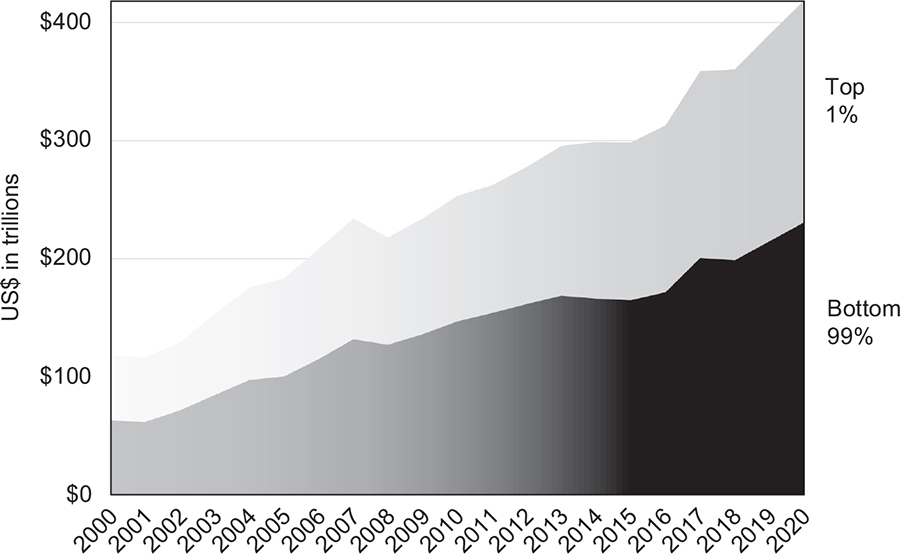
FIGURE 4.14 Global wealth of top 1% versus bottom 99%
Source: Prepared by the author using Credit Suisse data.31
This hidden offshore sector is large enough to make a significant difference to all of our conventional measures of inequality. . . . For most countries, global financial inequality is not only much greater than we suspected, but it has been growing much faster. . . . [T]his offshore sector . . . is basically designed and operated, not by shady no-name banks located in sultry islands, but by the world’s largest private banks, law firms, and accounting firms, headquartered in First World capitals like London, New York, and Geneva.35
Quite possibly, even likely, all three sets of estimates are short of the mark. The financial secrecy system, in business for half a century, shelters illicitly generated and often unseen wealth in the tens of trillions of dollars, powering inequality in its wake.
This chapter began with a discussion of why the main focus is on inequality rather than on poverty. Figure 4.15 demonstrates what global wealth would look like if we took money from the top decile and alleviated the poverty of the entire lower half of the world’s population, making every one of these almost 4 billion people in the bottom five deciles financially equal to those in the sixth decile.
Notice that economic inequality is hardly changed. Instead of owning 82 percent of the world’s wealth, the richest 10 percent would then still own more than 76 percent of the world’s wealth. The point is that addressing poverty alone does not solve the problem of inequality. Marginally alleviating poverty for the poorer half of the world, those living on just a few dollars a day, is completely laudable and absolutely urgent. But it does not solve the problem of the clash between capitalism and democracy, a clash driven in large part by bewildering levels of economic inequality. Concentrating on the bottom of the scale cannot substitute for changing the top of the scale. Far more equitable sharing of the world’s bounty is necessary if the democratic-capitalist system is to survive.
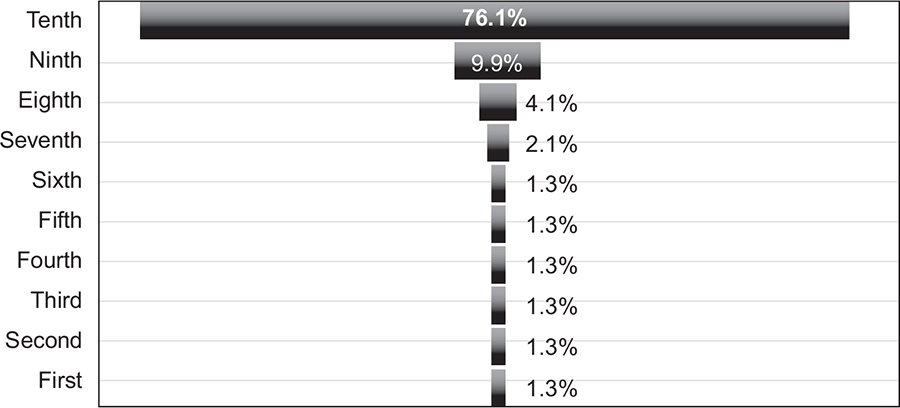
FIGURE 4.15 Share of global wealth (with bottom six deciles equal)
Source: Prepared by the author using Credit Suisse data.36
With 82 percent of the world’s wealth currently at the top of the scale in the hands of the top 10 percent, recall the description of the financial secrecy system in chapter 1. This is a system created and expanded over the last half century specifically for the purpose of moving money from the bottom to the top, poor to rich, criminal to legitimate, and corrupt to respectable. This is the intent of the system, not an unfortunate outcome. It does exactly what it is designed to do, and democratic capitalism is thereby threatened.
OTHER VOICES
In addition to multiple indices published annually, a vast literature surrounds issues of income and wealth inequality as well as disparities in many other conditions of human existence. A few quotes suggest the richness of scholarship and commentary focusing on the problem.
Fight Inequality: “We are at an extreme point in history. . . . The inequality crisis is fuelling injustices in land, health, education, taxation, worker’s rights, women’s right and human rights.”37
Wall Street Journal: “Economics has no accepted theory of inequality— no scientific understanding of the mechanisms and processes that create it. Until recently, wealth distribution was regarded by many economists as a minor issue compared to growth.”38
New York Times: “The solutions that have currency seem calculated to spare corporations and the wealthiest people from having to make any sacrifices at all, as if there is a way to be found to tilt the balance of inequality while those at the top hang on to everything they have.”39
Darren Walker, president of the Ford Foundation, asks the right questions:
Make no mistake, the exploitation of our democratic-capitalist system is intentional. Too often, the powerful and privileged who might stem the callousness and corruption seem largely to ignore it, avoid it, minimize it or, worst of all, maximize it for their own gain. As our system falters under the inequality it has produced, as society seems increasingly strained by— and susceptible to—ever-widening gaps, those of us who have benefitted from this inequality need to look in the mirror and ask why. Then we should ask how we fix it, with justice as our objective.40
Paul Krugman, Nobel Prize winner and commentator, opines, that
these days almost everyone has the (justified) sense that America is coming apart at the seams. Political polarization has marched side by side with economic polarization, as income inequality has soared.41
As Joseph Stiglitz states,
Economic inequality translates into political inequality, which leads to rules that favor the wealthy, which in turn reinforces economic inequality. . . . It is not just our economy that is at stake; we are risking our democracy.42
And so it is to democracy that we now turn.