Chapter 3
The Sustainability Scorecard
The difference between what we do and what we are capable of doing would suffice to solve most of the world’s problems
—Mahatma Gandhi
In Paul’s MBA class, a student once asked about sustainability management, “So ultimately, are we just talking about risk management?”
The short and yet complete answer is no.
It is clear that CEOs are thinking about the role of their firms in society and as stewards of the environment from which they draw their inputs. They are saying it is no longer enough to be “just good enough” by meeting minimum compliance requirements or achieving high-quality metrics. The call to action globally is to create “products that are better for you and better for the environment.” But this high standard cannot be achieved through error containment or risk avoidance alone.
In sustainability-focused discussions at round-table meetings with executives, we often hear them express their understanding that climate is connected to water, water to land, land to air, and so forth, and that their risk-based methodologies just cannot seem to keep up with the various fatalities and failures that are likely at every one of those nexuses. Yet they’ll invariably say, after acknowledging their understanding of the interconnected nature of their supply chains’ shock patterns, “Well, so I think I’ll just have to focus on reducing my carbon footprint.”
The lack of a systemic approach to measuring, tracking, and reporting sustainability KPIs drives outcome-focused leaders either to focus on the one metric they likely can control (a lot of times, that’s carbon) or to just go back to playing whack-a-mole with risk-based avoidance behavior. So for a firm with a heavy utilization of water, for example, water stewardship and conservation become high-priority risk-related items in its sustainability strategy. For agricultural firms, land use and soil quality become high-priority risk-related items in their models.
To be clear, risk management is important, and ESG audits will go a long way in ensuring compliance and a focus on the holistic impact of business operations (versus just impact on the financial bottom line), but sustainability strategies embedded in risk management propagate an avoidance behavior. This works right up to when it doesn’t—right up to when the volume of low-probability high-cost events or high-probability high-cost events is too high to address, and the risks outlined in the SEC filings outline numerous interconnected issues that reduce investor confidence.
Of course, established risk management metrics are important to track, especially in the initial phase of a firm’s sustainability journey. But in order to scale from a pilot or small venture to a midsize firm, and then from a midsize to a large or even global enterprise, forward-looking strategic approaches and metrics are what’s necessary. Strategic is the operative word here, because in order to look forward and design for the future, a firm cannot live in the past. We recommend driving forward with new metrics that are rooted not in avoidance behavior but in managing and scaling sustainability—hence the Sustainability Scorecard. And for your business to do this work over the long run, we recommend using a compass rather than a speedometer. In other words, it’s about your direction, not your speed. This is how you make sustainability work for your business—with incremental transformations that account for the financial and operational trade-offs while continuing to move your business in the direction of greater sustainability.
The Sustainability Scorecard Key Performance Indicators
SCORECARD COMPONENT: WASTE PREVENTION

▪ 0: process recovers all (91%-100% by weight) the waste generated.
▪ 1: process has a majority (51%-90% by weight) of its waste recovered through upcycling, landfill-based recovery processes/safe degradation in a graveyard, and/or multiple-use mechanisms ultimately avoiding a graveyard at end of life.
▪ 2: process has a majority of its waste disposed through the landfill, autoclaving, or incineration.
▪ 3: process leverages graveyards as its sole end of life (91%-100%).
SCORECARD COMPONENT: MAXIMIZING EFFICIENCY AND PERFORMANCE

▪ 0: process is maximally efficient and has no negative environmental or human health externalities.
▪ 1: process under evaluation is efficient, and the majority (51% or more) of chemicals under evaluation are not linked to high acuity and complexity disorders.
▪ 2: process under evaluation is efficient, and the majority (51%-90%) of chemicals under evaluation are linked to high acuity and complexity disorders.
▪ 3: process under evaluation is efficient, and all of the chemicals under evaluation are linked to high acuity and complexity disorders.
SCORECARD COMPONENT: USING RENEWABLE INPUTS
▪ 0: product under evaluation uses 90%-100% of renewable inputs in the entire known supply chain.
▪ 1: product under evaluation leverages renewable inputs for the majority (51%-90%) of the entire known supply chain.
▪ 2: product under evaluation leverages nonrenewable inputs for the majority (51%-90%) of the entire known supply chain.
▪ 3: product under evaluation leverages nonrenewable inputs for 100% of the entire known supply chain.
SCORECARD COMPONENT: ENSURING SAFE DEGRADATION
▪ 0: process degrades without any toxic effects on human health and environmental factors and extended producer responsibility is in place.
▪ 1: process degrades without any toxic effects, but extended producer responsibility is not in place.
▪ 2: majority of the components of the process degrade safely, but extended producer responsibility is not in place.
▪ 3: process does not degrade safely (i.e., is toxic, persistent, and bioaccumulative).
The Sustainability Scorecard provides a consistent and reliable framework for measuring the comprehensive value of business processes and communicating the full life-cycle cost-benefit improvements achieved. It is built on the backbone of the four principles for managing and scaling sustainability introduced in the previous chapter and highlights the four main goals of a sustainable corporate strategy:
1. Waste prevention
2. Maximizing efficiency and performance
3. Renewable inputs
4. Safe degradation
But before diving into the specific metrics and their leading indicators (i.e., compass points), let’s discuss the intention behind the scorecard.
The Intention behind the Scorecard
Uncovers Hidden Costs
Research into business practices tells us that over 70 percent of the costs of a product are budgeted in the design phase. Although the financial investment into a new product or process is typically accounted for during the design phase, most of a product’s social and environmental costs are actually incurred much later in the product life cycle.1 The Sustainability Scorecard solves a big issue for leaders in this area: the identification of costs incurred during each phase of a product’s life cycle, including production, use, end of life, and disposal. Once these costs can be holistically anticipated and tracked, they can also be more effectively managed or eliminated.
Is Flexible and Customizable
This scorecard is designed to be customized. While the principles in this scorecard should be leveraged as the arms of a compass and are widely applicable across numerous industries and use cases, the exact metrics we discuss may not be. This chapter provides a set of metrics to kick off an ideation journey for organizations, but not necessarily a set that is applicable across the board. For example, if you are part of a product firm or manufacturing firm, measuring PMI (process mass index) or some form of this metric is likely very valuable and will lead you in the direction of strategic and non-risk-based metrics.2 In the agricultural industry, the environmental impact quotient (EIQ) or process excellence index (PEI) may be a more useful metric for benchmarking the sustainability of operations. These metrics are meant to be transformed depending on several factors, including the type or category of waste your firm intends to prevent and the categories of hazards and performance that you intend to measure.3
Is Quantitative Yet Never Achieves Perfection
We all love achieving perfect grades on tests, but in this case, the scorecard has been designed to never achieve or “add up to” a perfect score. Rather, you may note that we broadly classify progress in four categories: 0, 1, 2, and 3. In the waste prevention guideline, 0 signifies complete recovery of all end-of-life materials; that is, all outputs of the process are reintroduced as inputs. A score of 3 signifies that no outputs are ultimately recovered as inputs, and ultimately finish the product life cycle in the grave.
The reason for this broad classification is that sustainability is a journey, a design constraint in product and process innovation, and a pillar of corporate strategy. It would be naive to imagine a world where all the environmental challenges to an industry have been resolved, while innovation continues to drive new materials, products, and processes. We believe that there is no one company in the world that is completely aligned with all of the four Sustainability Scorecard principles simultaneously. This scorecard is designed to provide an adequate view of a firm’s transformation while ensuring that knowledge gaps, implementation gaps, and future road map items are clearly communicated and visible in the scorecard, and can be addressed as a part of future plans.
Designing our scorecard for durability and relevance, while remaining mindful of the potential unknowns the future might present, was a critical consideration. Innovation presents challenges for which perfect knowledge or answers may not be present at the time; however, a compass to help you see what direction you’re moving in will always be useful.
In the case of high-tech and other rapidly evolving industries that are anchored in innovation and value it highly, the next unexpected solution may produce outcomes that are not fully understood for years—perhaps decades—after its introduction. Nanotechnology is a perfect example.
As Paul testified to Congress in 2009 related to an e-waste bill, the production of a memory chip requires about six hundred times its weight in fossil fuel.4 For comparison, the production of a car requires one to two times, and an aluminum can requires four to five times its weight in fossil fuel.5 And many electronic products, especially older models, contain substantial quantities of hazardous substances. Older cathode-ray tubes contain between four and seven pounds of lead in each tube!
In 2003, a user group categorized and studied the environmental challenges associated with the “hockey stick” growth that electronics waste presented. Several toxic chemicals that were restricted, even at that time, were found in the leaching and discharge of e-waste.6 The disposal and recycling of waste electronics has become an international and multidimensional issue riddled with large knowledge gaps, as researchers and industry groups work to figure out the best ways to ensure human and environmental safety while attempting to create circularity in such a complex space.
Tracks the Journey, Not Success or Failure
Ultimately, circularity occurs when all components are either utilized or managed in a way that the system inherently allows for a closed loop. Circularity is the goal because such systems are not only more resilient to vulnerabilities but more effective and efficient. You will notice that our ratings scale ranges from immaturity (3), a system wherein circularity has not been achieved, to complete recovery (0), wherein circularity has been achieved with a certain process or product. We intentionally conceived this scale to factor in the maturity of a firm’s methodology while combining quantitative and qualitative assessments of the scorecard to arrive at a 360-degree view of the product or process under evaluation.
The lack or presence of a strategy for the components of a product that arrive in the graveyard along any process flow is also indicative of process maturity. A commonly used tool for assessing the “greenness” of a particular process is the life-cycle assessment (LCA). The LCA measures the environmental impact of every stage of production and postproduction life of a product or service. In this assessment, the end-of-life disposal step of this product or process is called a graveyard. The lack of a strategy to address the disposal or graveyard effects of a firm’s products is an indicator of process immaturity, considering that the financial benefits of material and energy-flow recovery have been well documented in various industries. Firms early in their sustainability journey typically do not have established recovery mechanisms within their product stewardship programs. In these scenarios, the relationship between the product and the firm ends at the transaction, when the product then belongs to the customer, as does responsibility for disposal. In mature processes, graveyard effects are addressed and owned by the manufacturer or firm—even after the transaction with the customer has occurred.
And where inherent design challenges persist (e.g., in the case of electronics, where the true carbon footprint of nanochip production is unknown), the Sustainability Scorecard will continue to show a baseline level of immaturity. The intention behind this mindful scaling is to foster conscientious innovation, design, and awareness of knowledge gaps, and accurate reporting.
Beyond Neutrality, Repairs Externalities
The scorecard is designed to celebrate neutrality (with complete recoverability being scored as 0)—no unintended negative externalities—but also to encourage firms to continue to innovate with unexpected solutions. Consider carbon. Carbon dioxide is a long-lived pollutant; it resides in the atmosphere for centuries. This leads to a pesky problem: even if we decarbonize our entire economy today, we would still have to contend with the environmental, human health, and financial shocks of the carbon we have emitted over the past two centuries. It is increasingly likely that we will need to employ solutions that remove and sequester carbon from the atmosphere. In this case, we wanted to make space for firms to consider not only going carbon-neutral in the future but also taking responsibility for the carbon they may have historically emitted.
Provides an Understanding of the Life-Cycle Costs and Benefits
It is important to recognize that when attempting to embed unexpected solutions into existing systems, a full cost-benefit analysis of the life cycle is the best way to compare a traditional product or process and an unexpected one. For solutions that provide value along various parameters (such as unexpected solutions), the Sustainability Scorecard will enable operations executives to see where investments can be made for product and process innovation. These powerful drivers can be harnessed to encourage behavior and decision-making that are aligned with the corporate strategic goals of the future.
Enables Full-Cost Accounting
By evaluating a process or product through the lens of this scorecard, it is possible to understand the full-cost accounting and understand the economic cost of each externality and end point (recovery or landfill), and it allows for better management of natural and social resources.
Drives New, Unexpected Solutions
Like any self-reported questionnaire, the Sustainability Scorecard can be manipulated to provide an exaggeratedly positive output. And in a competitive market environment in which being “green” is something that appeals to customers, businesses have a lot to gain by pretending to be more sustainable than they really are. However, when our scorecard elements are placed as design requirements, they can drive unexpected innovations and new product development. This can result in the creation of incentives that mitigate against the risk of overly aspirational self-assessments and reporting.
And now, let’s get to the goodies. Next, we’ll discuss the most universally applicable Sustainability Scorecard KPIs and how you can use them as leading indicators for your firm’s progress.
Enable Strategic Sustainability Metrics
We have now discussed some of the main sustainability KPIs under each principle. These KPIs are intentionally nonreductive and forward facing.
Waste Prevention
In tracking waste prevention, there are several leading indicators or KPIs that we can use to determine whether we’re moving in the direction of greater sustainability.
Durability. Products that will last well beyond their useful commercial life often result in environmental problems, ranging from solid waste disposal to persistence and bioaccumulation. It is therefore necessary to design substances with a targeted lifetime to avoid the persistence of undesirable materials in the environment, also known as “forever chemicals” that affect human health through a variety of pathways. However, there is a balancing act to be managed. We want the product to tolerate operating conditions for its expected lifetime, and we do not want it to prematurely fail—however we define failure for that category. Effective and efficient maintenance and repair must also be considered, so that the intended lifetime can be achieved with the minimal introduction of additional material and energy throughout the life cycle.
As an example, plastics consisting of several materials, including nonbiodegradable polymers, represent the second-largest nonrecyclable fraction of municipal solid waste that finds its way into landfills, surpassing every other category quite significantly.7 Although this product has a short useful lifetime, it remains a significant source of environmental pollution by living far beyond its useful life in landfills, with plastic and fibrous components degrading into the soil and groundwater, placing humans miles away at risk.
One emerging solution is a starch-based packing material, Eco-fill, which consists of food-grade inputs (starch and water) that are durable enough to perform their function for the time period and can be dissolved in domestic or industrial water systems at the product’s end of life.8
Whatever your product, it is important to consider the range in which durability can be withstood without designing for immortality. We don’t want products that are no longer useful to live forever! And if they do, we’d advise designing for recoverability and/or safe degradation. In designing for the durability of a product, important sub-metrics to steer the way include
▪ Expected useful life of the product/expected number of uses before a replacement is required
▪ Failure frequency
▪ Tolerance to disturbance while remaining “viable”
Product life extension. This metric is really a component of durability. One of the approaches that firms often employ in designing their end-of-life solutions is to prolong the useful life of a product. This can be achieved in several ways—upcycling, for example. Adidas uses ocean plastic to produce its shoe. By way of leveraging a discarded product in the creation of a new one, an important cradle-to-cradle solution is born. Product life extension can also be a useful revenue-generating mechanism to ensure the prolonged life of products while diverting these products from graveyards. The sub-metrics we have identified that are most directly related to product life extension are
▪ Customer lifetime value
▪ Customer acquisition cost
As firms clean up their acts (literally), customer lifetime value has become an increasingly important metric. In the case of sustainable supply chains, this metric is the percentage spend of an account over the life of the account. Increasing the useful life of your product could mean that it is better (and cheaper) for the customer over the long term. And if the products that you are creating are inherently better and more cost-effective, it is likely that not only will customer retention increase but customer acquisition costs will decline.
While one can attempt to continually decrease customer acquisition costs over time via several strategies, customer lifetime value remains a consistently strong lever in strategic sustainable growth. In chapter 8, Roger McFadden, ex-Chief Science Officer of Coastwide Laboratories/Corporate Express (and later VP and Senior Scientist at Staples) sheds light on just how important a sustainability progress measure customer lifetime value has been in the commercial and household cleaning supplies industry.
Process mass intensity (PMI). The PMI metric is a measure or ratio of the weights of all material inputs into a product (water, organic solvents, raw materials, reagents, process aids, etc.) in relation to the ultimate weight of the product produced. This is an important focus because of the historically large amount of waste coproduced during manufacturing.
One of the biggest successes in implementing this metric has been in the biopharmaceutical industry, which in many cases creates more than one hundred kilos of waste per kilo of product. Biopharmaceuticals, or biologics as they are commonly known, are large-molecule therapeutics typically produced using biotechnology; they form a rapidly growing segment of the pharmaceutical market.9 Despite the success these drugs have had in treating various ailments, their hefty environmental footprint has gained significant attention in the media, with several stakeholders—healthcare providers, investors, and even employees at pharmaceutical firms—ringing the alarm.10 At the 2012 American Chemical Society Green Chemistry Institute, six large pharmaceutical companies participated in a benchmarking exercise to calculate the PMI for drugs for monoclonal antibody (henceforth referred to as mAb) production. They found that on average, 7,700 kg of input is required to produce 1 kg of mAb. Over 90 percent of the mass is due to water use, highlighting the water-intensive nature of biologics production, and the rest is solid waste. It became clear that a focus on reducing this waste-would result in significant production cost savings.11
With this information, Merck attempted reducing the PMI of Simvastatin, their leading cholesterol-lowering biologic, originally developed as Zocor®.12 In 2005, Zocor was Merck’s best-selling drug and the second-largest-selling statin in the world, with about $5 billion in sales. After Zocor went off patent in 2006, Simvastatin became the most-prescribed generic statin, with ninety-four million prescriptions filled in 2010.13 Off-patent drugs face fierce competition in the marketplace, as other firms’ products can compete with the drug and potentially drive down the price. With over 70 percent of waste being expended in the traditional production of Simvastatin, Merck knew there was a fantastic opportunity to drive down the cost of production by simply using fewer inputs, producing (and therefore managing) less waste per pill. In 2012, Professor Yi Tang of UCLA and his team developed a new process for the production of this biologic, using less-hazardous inputs that produce only one recyclable waste product. In addition, 97 percent of the inputs of this process make their way into the final output, meaning that only 3 percent of the entire ingredient list has to be recycled. With novel and cost-effective technology, more than ten metric tons of this drug have been manufactured using this new process, and in 2012, Tang was awarded the Presidential Green Chemistry Award for his exceptional work.14
Economy of space. Traditionally, manufacturing requires many steps, especially for complex products with various inputs. For example, in pharmaceuticals, the creation of complex drugs such as anticancer therapeutics requires multistep processes that can result in loss of material, low yields, and increased energy and time used. Economy of space (i.e., fewer production sites) and economy of manufacturing steps (in the case of pharmaceuticals, for example, “one-pot” synthesis in a minimal number of steps or reactions) will not only decrease production costs but also lead to
▪ Higher yields
▪ Higher-quality outputs
▪ Increase in the number of units per square foot of product
▪ Increase in the number of units transported per vehicle
In the case of Zoloft, one of the most frequently prescribed medications for depression, Pfizer dramatically improved the commercial manufacturing process for the drug by replacing a process called sertraline. Sertraline was a three-step process in the original manufacturing, which was replaced by a one-pot creation method that reduced the three steps down to one. Chemically, the firm leveraged the use of a very selective catalyst to not only accelerate the speed of drug production but also increase the yield of the desired drug. The firm focused on designing a manufacturing process that reduced production cost, improved the yield and quality of the final output, and also
▪ Used benign chemicals for drug production, thereby eliminating significant costs associated with the safe handling of drugs, biohazards, and worker safety. Simply reducing the manufacturing steps resulted in elimination of 310,000 pounds of toxic waste production per year. This elimination resulted both in cost savings and the avoidance of the possibility of a terrorist attack on the chemical plant that was producing and storing the toxic chemical.
▪ Reduced raw material use over the entire process by over 50%, further eliminating waste and reducing cost of production.
Another way to think about the economy of space is to consider business operations. During his work at Coastwide Labs, Roger McFadden considered the economy of space in product transportation. In changing the shape of product containers from a traditionally tapered conical shape to an S shape, the lab was able to fit 25 percent more product in a transportation container. When the operational savings on one container are scaled across an entire production line and considered year over year, this change yields significant financial benefits.
Maximizing Energy and Performance
Material efficiency and environmental health benefits. A gap we often see in reported metrics (in reductive metrics in general) is the ad hoc use of efficiency metrics (for example, production rate) as a one-dimensional concept. The value-add with the scorecard is that you’re looking at efficiency, but it’s no longer telling you only one part of the story (how efficient you are in production). It is also telling you how you use your space (particularly useful in the case of land-use metrics, such as for corn-based biofuels, where it would be clear to see that while the fuel efficiency is good, the use of land is so high that it causes local agricultural supply chains to get disrupted). Similarly, mass efficiency of a product will tell us the mass of the desired output divided by the total mass of the output—a big indicator of waste.
If a system is designed, used, or applied at less than maximum efficiency, resources are not just being wasted throughout the life cycle; the waste could also pose hazards to humans and the environment. The aim here is to view inputs alongside space, energy, and time, and mass efficiency metrics to evaluate the overall process design and eliminate waste. These metrics can also be used for real-time monitoring to ensure that optimized systems continue to operate under the intended design conditions.
For example, historically, only a part of the available volume of large-batch reactors in chemical manufacturing had been used during the reaction period, leaving significant space open. But this practice diluted the chemical reaction, making it more energy inefficient and expensive. Through process intensification techniques, such as the use of microreactors that operate continuously at very low volume with efficient mixing, higher productivity can be obtained from smaller amounts of material. Similarly, in the paint industry there has been a shift toward the manufacture of powdered coatings because they are more space, time, mass, and energy efficient (and therefore cheaper to produce) than liquid paint.
Nexus thinking and nexus energy efficiency. “Nexus thinking” allows us to understand the consumption efficiency or nexus efficiency of natural resources as they are leveraged to create energy. For example, the water-energy nexus is the relationship between the water used for energy production, including both electricity and sources of fuel such as oil and natural gas, and the energy consumed to extract, purify, deliver, heat/cool, treat, and dispose of water (and wastewater), sometimes referred to as the energy intensity of process.
So what is nexus thinking?
Julie Zimmerman, green engineering professor and nexus-energy expert at Yale University, explained it like this:
Just like you talk about embedded carbon in products, we talk about embedded water. Just like you do a carbon footprint, you can talk about a water footprint of a product. How much volume of fresh water is used to produce that product over the production chain? Whether I’m growing crops and I’m harvesting them . . . and I’m processing them, how much irrigation water goes into that crop? If I’m mining, how much water am I using in that process? Or energy production, how much water am I using in fracking and how do I account for that water across the entire supply chain?15
In our interconnected world, energy is derived from various sources to form hybrid grids that leverage public-private partnerships. Because of this, understanding the pricing structure of energy and the nexus energy efficiency is very important: How are resources that are typically considered public goods, such as water, being used in creating energy to run processes that are private in nature, such as the production of goods? In this way, measuring nexus-energy efficiency has the power to transform energy governance, oversight, regulation, and pricing models.
Nexus thinking is highly relevant from a supply-chain perspective to address important operational strategy questions:
▪ Where is the embedded water in my product or process coming from? As Zimmerman mentions in her research, tracing the supply chain is effective in understanding whether an organization is drawing on water from a scarce basin or not and enables firms to manage water and other inputs in the systematic manner that fossil fuel resources are managed.
▪ How can organizations increase their water efficiency?
What are the water-related dependencies that production sites are inheriting by way of location of production processes in certain geographies? From the perspective of organizations, these nexus questions can address critical supply-chain and operational strategy issues that are environmental in origin. For example, if a firm is considering engaging in a strategic partnership for its agricultural supply chain with an organization in a water-scarce country, nexus questions will help the firm understand the risk of becoming water dependent and can help it pursue relationships with organizations that source goods from water-rich geographies.
When governments or organizations set goals to address energy efficiency, looking at the nexus also helps shift the focus to understand how best to invest resources to address the problem. Take California. California set audacious goals to reduce carbon emissions, and it spent tens of millions of dollars upgrading the energy grid to meet them. However, when Zimmerman conducted an analysis of how efficiently the invested dollars addressed the energy problem, she arrived at a surprising finding: addressing the state’s carbon goals through water conservation instead of through upgrading the grid would have been a far cheaper and impactful strategy. So, instead of grid upgrades, she would have recommended implementation of a water use efficiency metric and water conservation. This would have resulted in a 50 percent cost savings to the state while having the same intended effect of reducing carbon emissions. Remember, carbon efficiency doesn’t align singularly with the energy sector. The moral of the story? When organizations are looking to address energy efficiency, looking at the nexus helps them shift the focus to how best to invest resources to address the problem.16
Intrinsically resilient and safe supply chains. Global supply chains are now more interconnected and complex than ever, and supply-chain resilience (and transparency) has become a focus for global firms. Intermediate goods, or goods that come before a finished product, have risen substantially in volume and value of trade across countries globally since the 2009 recession. This metric itself highlights the complexity, fragmented nature, and interconnectedness of global supply chains and therefore the inherent risk of disruption for a variety of reasons.
Researchers state that a high number of supply-chain decisions today are based on a trade-off between efficiency and vulnerability.17 This tradeoff is visible in the list of chemicals and their frequency in creating accidents in the US, mentioned and outlined in a table later in this book. The EPA’s Risk Management Planning (RMP) program was compiled to understand and learn from supply-chain accidents and the various industries in which these accidents occurred. Unfortunately, accidents related to intermediate goods, particularly those that are chemical in nature (the highest volume of traded intermediate goods, according to the OECD), are high.18 By replacing highly volatile intermediate goods with less reactive or accident-prone ones, firms can design more resilient supply chains without compromising efficiency or increasing the operational expenses for worker safety and insurance. In the creation of circular, resilient supply chains, we echo the words of Trevor Kletz, a pioneering chemical engineering researcher, who stated, “What you don’t have, you can’t leak.”
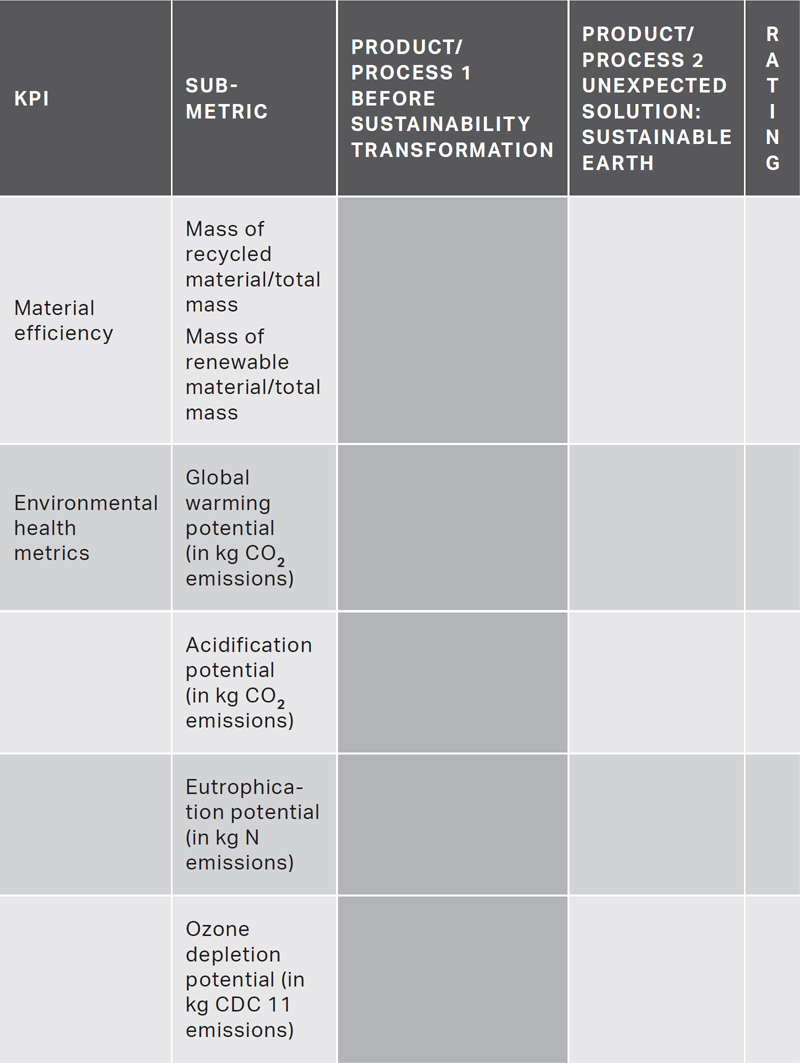
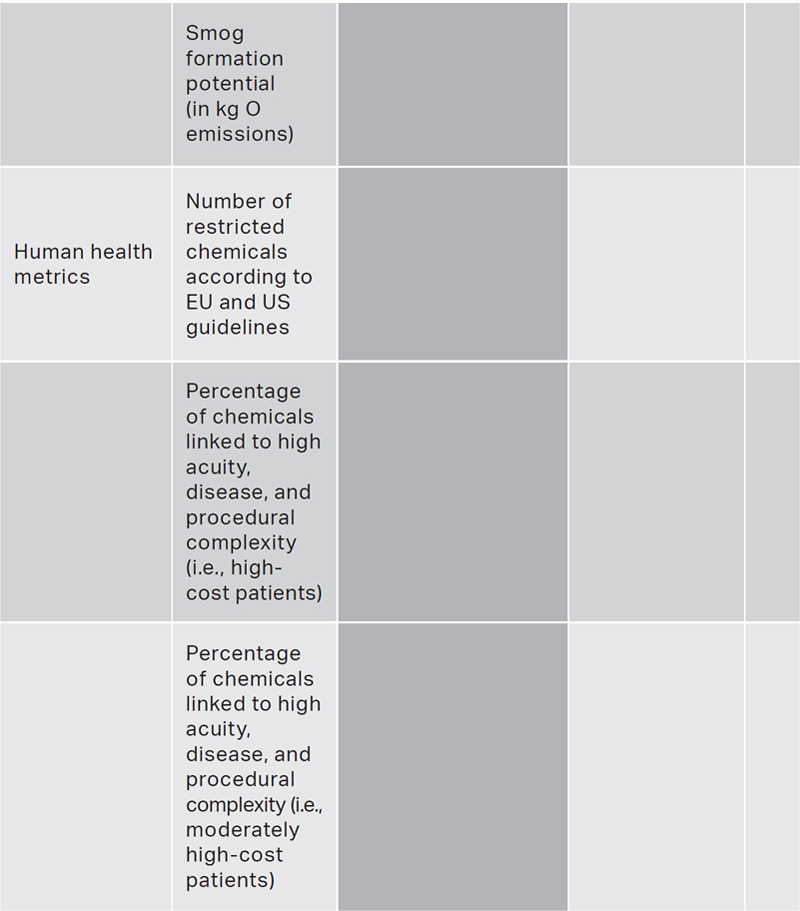
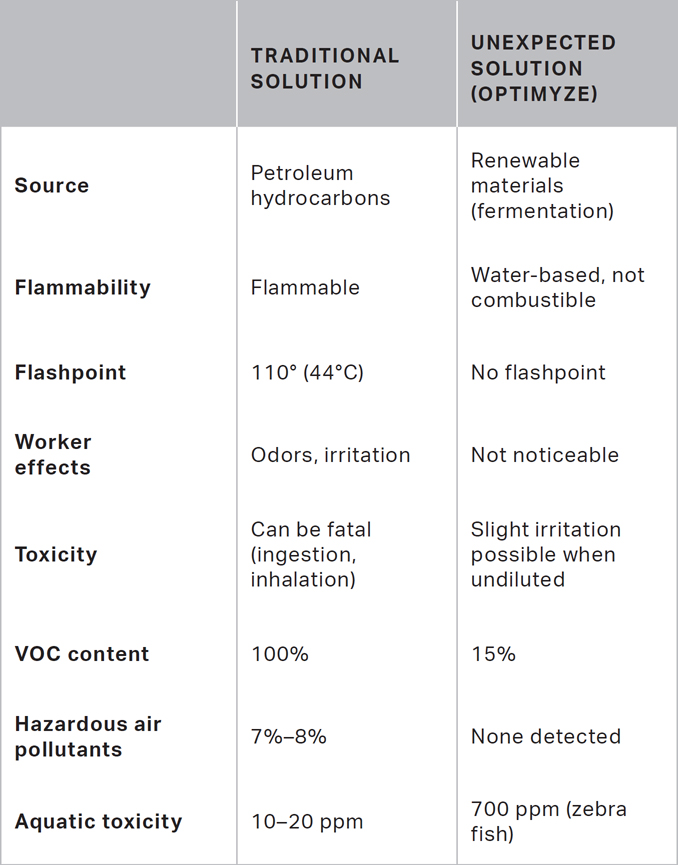
Paper and pulp production is one of the oldest industries in North America and reports a high incidence of accidents (e.g., chemical leaks and worker injury due to gas exposure). Optimyze®, a novel technology developed by Buckman Industries, is helping lower the industry’s accident rates. This unexpected breakthrough employs an enzyme to replace a toxic chemical used in paper mills to clean contaminants from paper products prior to recycling. One mill in the United States reported reduced use of the traditional toxic chemical by six hundred thousand gallons per year by using the enzyme-based Optimyze solution, and an increase in recycling production by 6 percent (a $1 million bolster to the financial bottom line).19
The table shows how Optimyze performs compared to the traditional chemical.
INHERENT SUSTAINABILITY OF THE OPTIMYZE SOLUTION
Metrics that may serve as KPIs in the inherent safety section are
▪ Accidents due to intermediate-good trade
▪ Proportion of intermediate goods that are resilient due to “inherent safety”
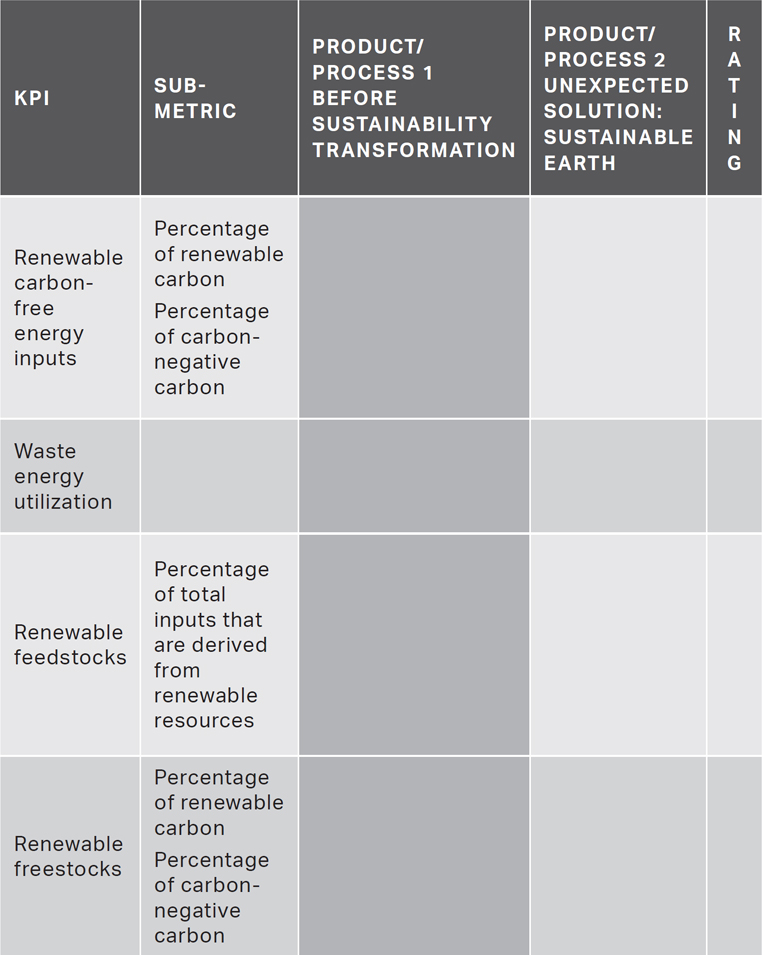
Renewable Inputs
Hybrid energy systems. Biological materials, such as solar, wind, and hydro energy, are often cited as renewable inputs. Renewable resources, however, can be used in cycles with nonrenewable resources to create hybrid systems, or can be leveraged as single sources of energy to achieve sustainability.
Resource recovery. If the waste product from a process can be recovered and retains value—for example, if it can be used as an alternative feedstock or recyclable input—this too should be considered renewable from a sustainability standpoint. Examples of the use of such inputs include in the manufacture of bio-based plastics, the recovery of biomass feedstocks, and the treating of wastewater with natural ecosystems.
One promising technology for renewable inputs is algae (yes, pond scum!). The extraction of oils from this unicellular organism fulfills commercial needs. While much work is still required to bring this fuel to market, there are several reasons to consider this input as a renewable alternative to fossil fuels, especially in high-impact sectors, as we will discuss later in this book.
Algae present several advantages over fossil fuels and other biofuels: they yield more oil per pound than corn and soybeans, do not divert crops from the food supply, and can potentially be grown in sewage water and seawater without impacting the freshwater supply. In addition, breakthroughs in production allow for the use of supercritical carbon (safe and nontoxic) for one-pot reactions that save time and resources at the system level by extracting from algae only the components that are required. Supercritical carbon is a well commercialized technology in which carbon dioxide is heated and held in fluid state of matter. The precise extraction of only required components is not possible with other traditional solvents, and because supercritical carbon is a well-commercialized technology, cost savings can be realized in commercializing the biofuel refinery.
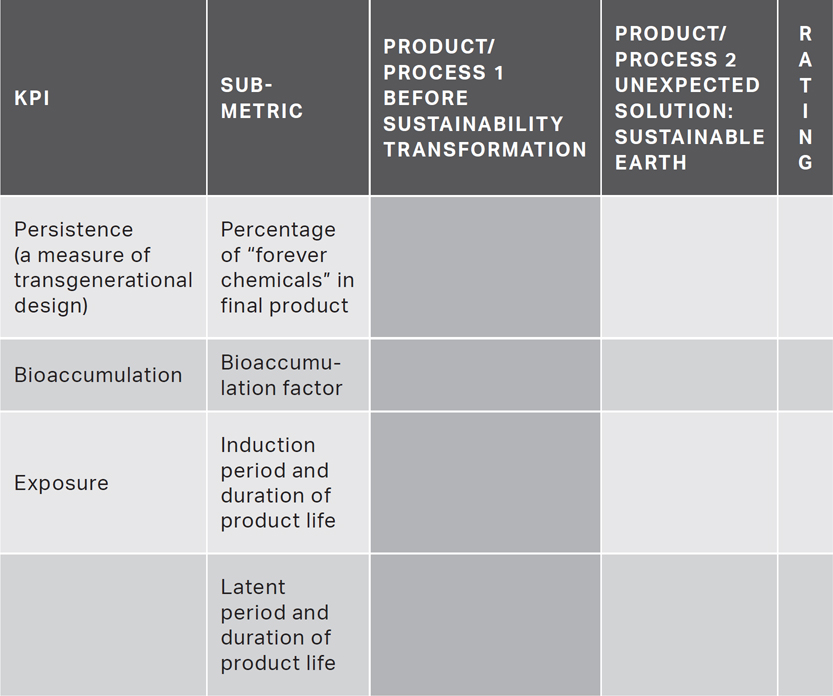
Safe Degradation
In the same way that mechanistic toxicology knowledge is essential to identify and weed out hazardous features, an understanding of the mechanisms of degradation and persistence is required to promote degradation and eliminate features that promote persistence. Described here are the metrics we recommend tracking to ensure safe degradation and prevent the unintended consequences of leaching (as is commonplace with plastics and electronic waste).
Persistence/immortality. The persistence of organic chemicals has been an important element of chemical hazard assessment for over forty years. High persistence indicates the potential for long-lasting environmental and human exposure to a chemical, exposure that is difficult to control and reverse. Immortality indicates that the chemical will persist forever.
Bioaccumulation. The longer one is exposed to a toxic chemical, the higher the rate of bioaccumulation—the buildup of related toxins in the body—in the individual.
A forward-looking approach that can be used to eliminate persistence is transgenerational design. Transgenerational design refers to future generations’ exposure to environmental and social externalities. This is particularly relevant in products where components end in a landfill and potentially leach into groundwater, causing exposure to chemicals (such as endocrine-disrupting chemicals, as discussed later in this book) that result in human health impacts. While no formal, standardized metric for transgenerational design exists, it may be helpful to note the number of generations affected by the product’s end of life.
Chemical body burden. The chemical body burden is a quantitative measure of the accumulation of chemicals in a population due to end-of-life externalities of the product. There are a few metrics that can serve as leading indicators of the chemical body burden of a product or process:
▪ Bioconcentration
▪ Bioaccumulation
▪ Biomagnification
Bioconcentration is the process by which toxins increase in concentration as the host of the toxin is consumed in the food chain. Because humans are at the end point of most food chains, we must consider this hazard.
Biomagnification factors can be included in the scorecard, and a value greater than 1 indicates that the concentration of the element being measured (for example, a pesticide) in the organism is greater than it is in the organism’s environment.
Time and exposure. Exposures can be measured or quantified in several ways depending on the product or process under evaluation. This can be reported as the number of exposures, time duration of the exposure, and the degree or a rating of the harmful effect of the exposure.
For any product or process, we recommend creating an exposure scenario. An exposure scenario, as defined by the EPA, is a set of facts, assumptions, and inferences about how and when exposure takes place that aids the assessor in evaluating, estimating, or quantifying exposure.20 A scenario is made up of combinations of the following:
▪ Sources and context of use (how the product will be manufactured, used, and disposed of)
▪ Environmental pathway (environmental and human health considerations based on the nature of use and on the routes of exposure [respiratory, contact exposure through the skin, etc.])
Time and exposure are important metrics to consider for any product or process, especially when persistence, bioaccumulation, and toxicity (PBTs) are tracked as well. We recommend engaging the anticipated time and exposure metrics early—that is, in the design phase of a new product or process—in order to make any design improvements or production changes that are required. Databases of existing knowledge, models that evaluate biodegradability or PBT attributes, and experimental testing are all valuable in incorporating these metrics to design strategic, forward-facing measures of success.
Consider the following design issue related to exposure. The electronics industry wants to remove a toxic flame retardant from circuit boards without sacrificing performance or function. Drop-in replacement chemicals such as tetrabromobisphenol-A (TBBA) meet the functionality requirements, but introduce other concerns in the PBT and exposure metrics of our scorecard as they relate to worker safety. Steps could therefore be taken to neutralize the harmful effects of TBBA; however, this may still introduce other chemicals that would not reduce the toxicity of the product on degradation in a landfill at the end of its life.21 Hence, per our scorecard, while the immediate safety of the product may remain the same due to the neutralization of the harmful chemical, the end-of-life considerations would show an increase in toxicity. In this instance, a deeper redesign may be warranted to eliminate the flammability potential of the circuit board by using inherently safer mineral-based flame retardants. This would require moving away from a drop-in replacement like TBBA and sourcing mineral-based flame retardants. The ideal result would be a more favorable time/exposure ranking on our scorecard, as it would reduce or eliminate the exposure-related effects on workers and reduce the PBT impact on the environment and human health on degradation. Another redesign element to consider could be reducing the overall operating voltage of the circuit. If the voltage of the circuit board can be reduced enough without disrupting performance, the use of flame retardants could be eliminated altogether!
While exposure scenarios in and of themselves are not new, they are not routinely used in the design phase to evaluate the downstream effects of inputs. Further, exposure scenarios need to be conducted on all inputs, not just the few that are known to be harmful. We recommend leveraging toxicology and exposure software to understand the exposure related to entire material inventories. It’s the only way to gain a comprehensive understanding of which inputs are hazards and should be designed out, and which ones present a low or marginal exposure over the entire useful life of the product.
Extended producer responsibility. Extended producer responsibility and product stewardship are policy frameworks in which producers are incentivized to adopt environmentally superior design, but we encourage firms to view this metric through a business lens. An indicator of extended producer responsibility can be quantified by the presence of a collection system to enable upcycling, refurbishing of devices (for resale and reentry into the revenue-generating pathway), or even collection of component parts from landfills to reenter production processes as inputs (as in the case of e-waste). We describe how to use this metric in scoring within the safe degradation component of the scorecard.
How to Use the Sustainability Scorecard
Identify a Product or Process to Evaluate
The first step in using the Sustainability Scorecard is to identify a few service lines (products) or processes within your organization as targets for evaluation. The impetus for such identification could be multifold—for example, the potential for innovation, the presence of a competitive product in the marketplace that may change the market landscape for the service line in the coming months, or elimination of “forever chemicals” from the product material mix either due to upcoming regulatory implications or to meet consumer demand.
Review the Suggested KPIs for Each Principle to Determine Which Apply
Next, we encourage you to carefully review the various KPIs we suggest for each of the four principles (waste prevention, maximizing efficiency and performance, renewable inputs, and safe degradation). This scorecard, as we mentioned earlier, is designed to be customized. It would be nearly impossible for any scorecard to broadly apply to every industry and every sector in the economy. That said, the basic premise of our KPIs is to serve as leading indicators of whether your product or process is moving in the direction of fulfilling the principle. Therefore, within waste prevention, for example, the KPIs of waste economy and space economy will likely be valuable to evaluate, while the sub-metrics may need to be changed to be more relevant to your specific firm or industry.
Assess Directionality and Identify a Target
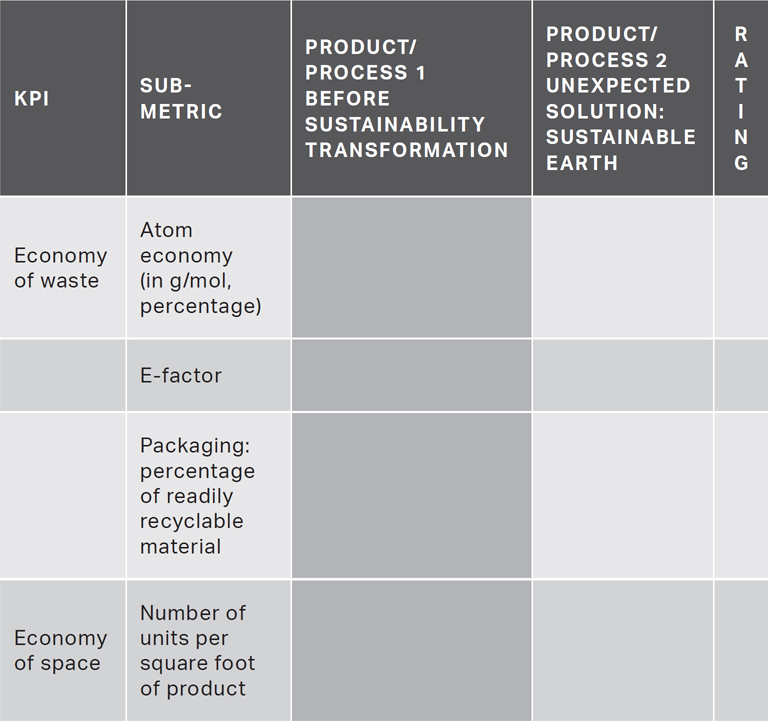
We recommend always targeting the value 0 as a “north star.” And this is where our refrain of prioritizing the compass (not the speedometer) comes in. As long as your year-over-year values are trending toward zero, we would consider this trend positively heading in the right direction (trending toward the north star). The reason is this: sustainability and material and energy science and technology are constantly evolving. There is potential for current practices to be improved on with emergence of new data and technologies. In such an event, there is potential for some line items to appear constant or even look worse in a year. Don’t worry! As long as you are trending toward zero—that is, complete recoverability—you are progressing in the right direction, regardless of how long it’s taking you. Let’s use an example to illustrate. Say you are using the scorecard to assess changes you are making to a traditional fertilizer production process. You want to know how the new solution moves the needle on waste prevention—in particular, on atom economy, a sub-metric of the economy of waste KPI (see table).
ASSESSMENT OF ONE LINE ITEM IN THE SCORECARD: ATOM ECONOMY
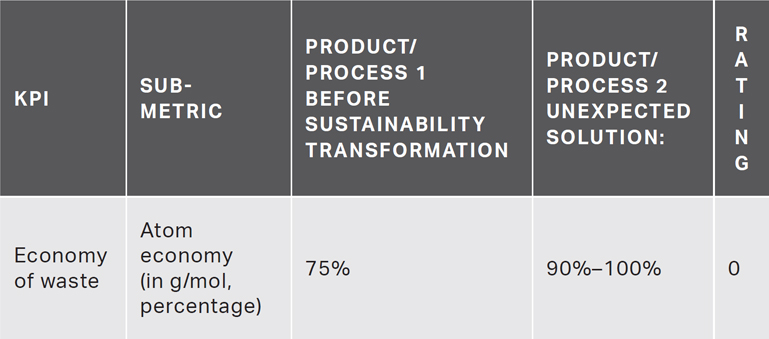
First, note the current value for atom economy under “Before sustainability transformation” and the potential new one under “Unexpected solution.” For the sake of an example, let’s say that a traditional fertilizer production process yields an atom economy of 75 percent while an unexpected solution yields a process with an atom economy of 100 percent. The trendline in this case would be upward. In each metric, the target is to arrive at a value of 0, or a net impact on human health and the environment of zero. In the case of a solution wherein atom economy is 100 percent—in other words, zero waste—this would result in a compass rating of 0 (the highest possible).
Qualify Your Findings
At the end of the quantitative analysis of the scorecard, we recommend an accompanying qualitative analysis. This is very important. Whereas traditional assessments tend to be based on quantitative metrics, qualitative assessments and metrics are equally important in the Sustainability Scorecard.
In qualifying your findings, a key concept to qualitatively assess is functionality. Functionality can be defined along a variety of parameters for a single product (fertilizer in this case). In terms of analytics, it would be challenging to report a singular value for functionality, given the variety of units possible. This reality is compounded by customer, management, and investor desires to increase the value of F as much as possible through product or process design. In other words, operational systems are designed to increase functionality per invested dollar (or invested material) as much as possible.
The implications of an F-factor rating, durability of a product, say fertilizer, and its impact on the extended producer responsibility, for example, are all components that can only be meaningfully brought into a cohesive analysis in the qualitative section. Let’s consider the F-factor for fertilizer as an example. F-factor is defined as function per kg of input. In other words,
F-factor = functionality/kg of input (material or energy)
Articulating a quantitative value for F-factor is perhaps intuitive, which can be challenging.
Next consider the subsequent step in analyzing F-factor. If functionality were increased high enough and invested materials were minimized to negligible amounts (or perhaps even eliminated), we would end up with a system wherein all the function of the solution exists without the need for any invested materials!
So what does this mean for fertilizer? The following are two leapfrog solutions where “traditional” fertilizer ceases to exist:22
▪ Innovative solutions wherein bacteria can potentially be harnessed to fix nitrogen from the air and then distributed to agricultural sites via waterways (thereby eliminating the transportation of bulk solid fertilizer)
▪ Treating water with plasma, a gas, to produce nitrates and nitrites, which plants can use as fuel
For solutions such as this, the qualitative section with the F-factor analysis is a very effective tool for articulating the value proposition.
Although qualitative metrics may be less rigorous from a data analytics perspective, they involve integrative systems thinking (or “big-picture thinking”) that is outside traditional analytical frameworks, it is possible that they are more closely linked to the interconnected nature of sustainability systems and to the goals as outlined in the United Nations Sustainable Development Goals (UNSDGs).23 Here’s how:
▪ Unexpected solutions such as those described throughout this book are usually able to achieve multiple goals simultaneously, in comparison to traditional solutions that align with only one major and/or a few minor problem statements. For example, a water splitting technology described in detail later in this book allows for the creation of a sustainable battery or energy storage mechanism. Another solution has the ability to utilize wastewater from sewage to produce energy. These unexpected solutions present several value propositions and can replace several traditional solutions at once. In such a scenario, big-picture thinking—such as the UNSDGs—can clearly articulate the various parameters along which the value is provided.
▪ Unexpected solutions further equity by solving particularly wicked problems for various industries. For example, inherently safe chemical sites prevent accidents that would ultimately affect entire geographies. Reducing social and environmental impacts and eliminating “forever chemicals” from manufacturing of everyday products have the potential to significantly reduce the total cost of care for large population subsets in healthcare and to improve the public health outcomes for vulnerable communities, all while improving financial outcomes for organizations.
Strategically Implement Unexpected Solutions to Lead to Profitability
Once the scorecard has been filled out, you have a comprehensive, science-backed assessment of how your new, unexpected product or process compares to your traditional one. This final output at the end of the book can serve as the business case for transformation, quantitatively and qualitatively articulating the benefits of the unexpected solution as well as support finance professionals in arriving at a full-cost accounting (including projected year-over-year impact on operating expenses, revenue-generating impacts, and opportunities for capturing market share).
But perhaps you haven’t discovered your new, unexpected solution yet. Maybe you are still in the stage of assessing your current operations. Here’s how we recommend you leverage the results of your scorecard assessment:
1. Compare year-over-year progress toward the target (0) after implementation of incremental improvements
2. Develop proactive plans to capture lost economic value at each stage through an informed full-cost accounting process
3. Use it to inform product or process redesign (more on this in chapter 5)
We developed the Sustainability Scorecard to provide organizations across all industries a path toward progress, toward an ideal future state, where economic growth and environmental and human health goals coexist and act as key growth levers for each other. For more on assessing which stage of the journey your firm is on—and how to use the Sustainability Scorecard to move to the next level—read on!