
1
The Fusion 360 Interface
In this chapter we’ll explore Fusion’s interface, navigate it, make some sketches and solids, save and upload a file, and discuss where files are stored.
We downloaded Fusion in the preface. On a Mac, launch it from the Applications folder; on a PC, click its desktop icon. A window will appear, asking you to sign in (Figure 1-1). If you haven’t made an Autodesk account yet, go to accounts.autodesk.com and do so.
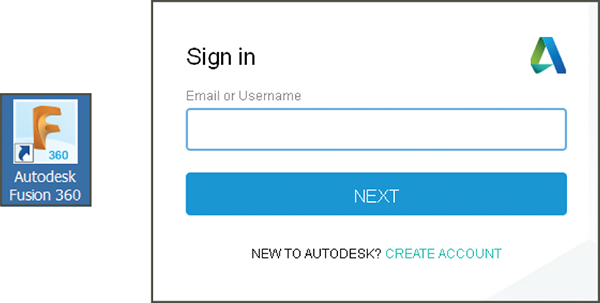
Figure 1-1: The Fusion desktop icon and sign-in screen
The Interface
Figure 1-2 shows the interface. It consists of a Data panel, gridded workplane, Browser panel, toolbars, ViewCube, and axis lines that intersect at a point called the origin. Let’s look at them.
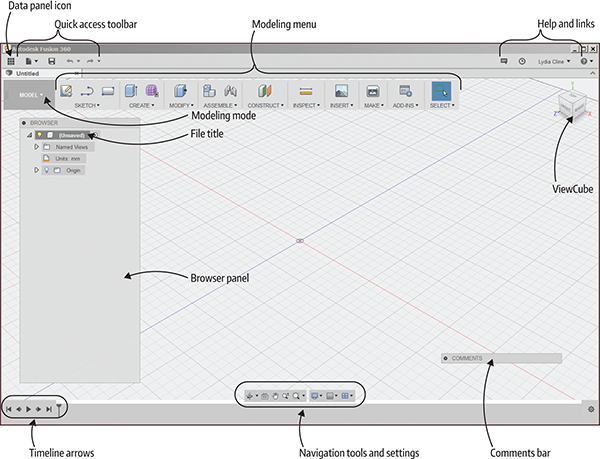
Figure 1-2: Fusion 360’s interface
Data Panel
Click the grid icon to open the Data panel, where you can access your existing designs, import files, add collaborators, and see who currently has a file open. Double-clicking a file’s thumbnail opens it. Dragging the thumbnail into the open workspace brings those components into the open file (you must save the open file before you can drag anything into it). Click the grid icon again to close.
Quick Access Toolbar
This toolbar shows File and Save icons and the undo and redo arrows. Click the File icon to access Fusion functions such as New Design and Export (Figure 1-3).
Figure 1-3: Click the File icon to access Fusion functions.
Help and Links
Click the dropdown arrows to access links to forums, tutorials, a gallery of user-generated files, and more (Figure 1-4). The arrow next to your name accesses the Preferences window, which offers user interface (UI) customization options (Figure 1-5). For example, if you don’t like tooltips appearing, want to reverse the zoom direction, or change the default modeling orientation, you can do so. Settings are stored in the cloud, so they’ll remain in place if you work on different computers.
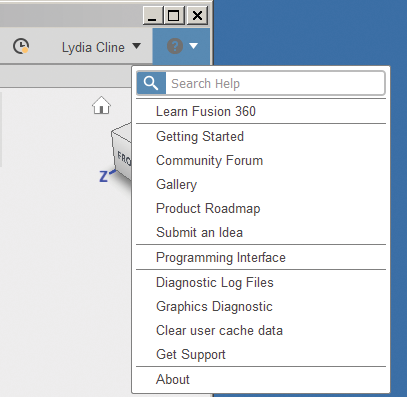
Figure 1-4: Access links for community help and tutorials here.
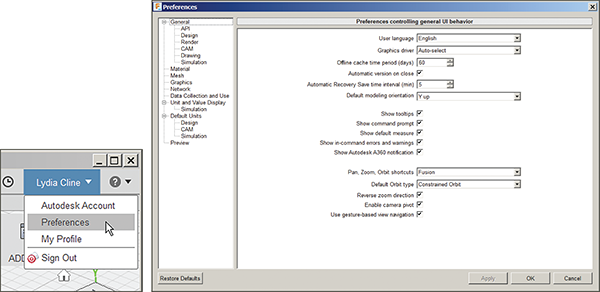
Figure 1-5: Customize the UI in the Preferences menu.
Modeling Toolbar
This toolbar contains the modeling tools. Click the dropdown arrow next to each menu entry to see the submenus. You can also type S anywhere on the screen to make a search box appear; type the tool or its hotkey into that box to activate the tool. See Additional Resources (at the end of this chapter) for the URL to the Fusion Shortcuts and Hotkey Guide.
Let’s use a tool now. Click the Sketch menu’s dropdown arrow, and then click Rectangle and 2-point Rectangle (Figure 1-6). Note that when you hover over a tool that isn’t already in the toolbar, a curved arrow appears that you can click to add it to the toolbar.
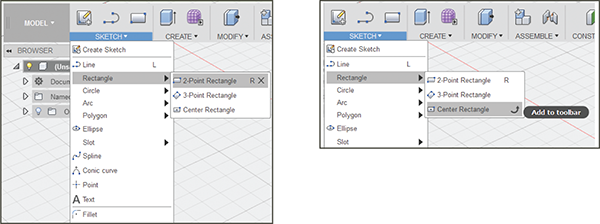
Figure 1-6: The 2-point Rectangle (left). If a tool isn’t already in the toolbar, a curved arrow will appear when you hover over it; click to add (right).
Three planes appear; one is horizontal and two are vertical. Click the horizontal one and then click two points of the rectangle (Figure 1-7). Click Stop Sketch to finish (Figure 1-8).
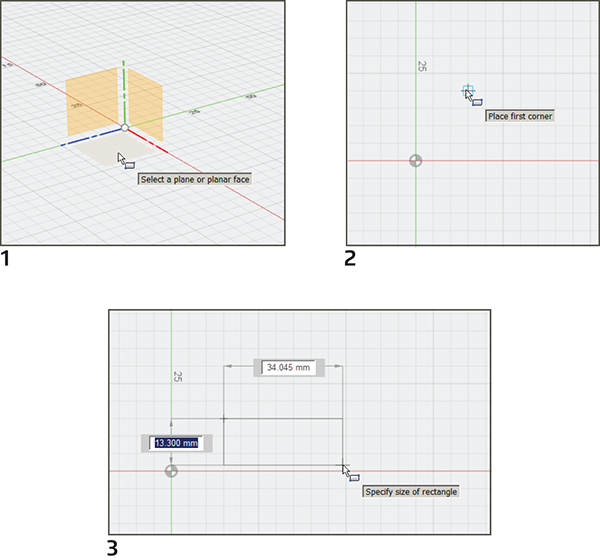
Figure 1-7: Drawing a rectangle
Right-click the rectangle to select it and open a context menu. Choose Press Pull from that menu and drag the arrow up. Press Enter and you’ll have made a solid form called a body (Figure 1-9).
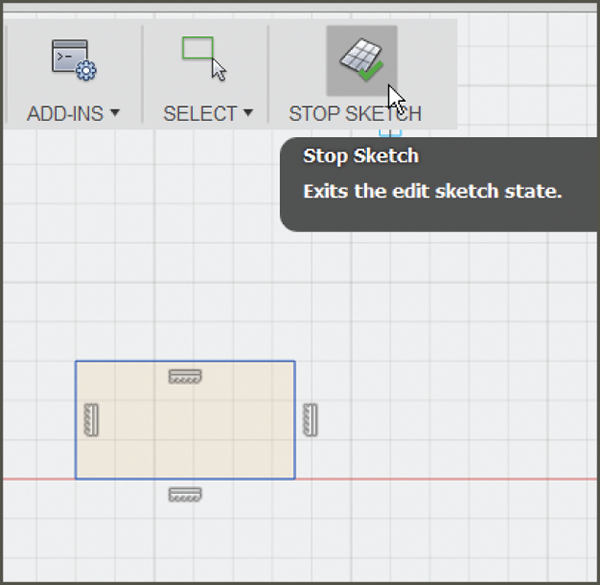
Figure 1-8: Click Stop Sketch to finish the rectangle and return to a 3D view.
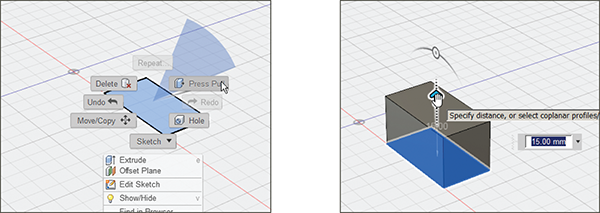
Figure 1-9: Turn the sketch into a solid with Press Pull.
ViewCube
The ViewCube shows the model’s orientation on the work plane. Left-click the cube and drag to rotate it; the solid will rotate with it. Click the cube’s sides to view it orthographically—that is, as a top, front, or side view. Hover the mouse over the cube to make a house icon and a dropdown arrow appear. Clicking the house icon returns the sketch plane to its default position and zooms in to fit the model on the screen; clicking the dropdown arrow reveals options for viewing the model in perspective, orthographically, or in perspective with orthographic faces (Figure 1-10).
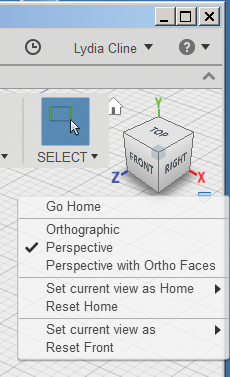
Figure 1-10: The ViewCube shows the model’s orientation on the work plane.
Modeling Workspaces
Click here to set the workspace’s modeling mode (Figure 1-11). Switching modes also switches the toolbar to show the relevant tools. The workspaces are as follows:
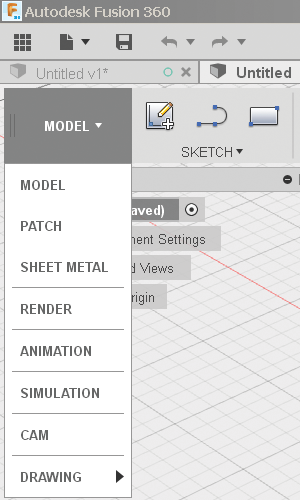
Figure 1-11: The Fusion modeling modes
- Model: Create and edit solid models.
- Sculpt: Create and edit T-spline models (organic forms).
- Patch: Create and edit surface models.
- Sheet Metal: Create and edit designs made of thin sheets.
- Render: Apply realistic colors and textures to the model. It’s only a display and has nothing to do with a physical 3D print. You can render locally or in the cloud. Cloud rendering is much faster, but it requires purchased credits.
- Animation: Create videos showing how the design should work.
- Simulation: Run tests to see how the model will perform under loads and stress.
- CAM: Generate machine toolpaths to cut the model out on flat pieces of material.
- Drawing: Generate a multiview layout of the model.
- Mesh: Modify and repair STL files. This workspace appears when an STL file is inserted.
Sculpt is actually a sub-workspace, accessed through the Model and Patch workspaces. The Sketch menu is a sub-workspace, too, and both the Model and Patch workspaces have it. The Sheet Metal workspace is available only when the timeline (discussed shortly) is enabled.
Browser Panel
The Browser panel lists document settings, views, and the origin, axes, and planes. Click Document Settings to access units; you can change them here. Click Named Views to see the model in a top, front, or side position. Click the origin to see the different planes, useful for choosing a sketch orientation.
Every Fusion document has a single, default component called the root component. The browser’s top field shows its name, which is Unsaved until you save it. Right-click it to access functions. As the model evolves, everything—sketches, bodies, components, and assemblies—is listed in the Browser panel. You can edit these items through the browser and control their visibility. Items appear with default names like Component 1:1, Component 1:2, or Body. The first number is the version number, and the number after the colon is the copy number. You can rename all browser entries, a good practice for telling them apart as their numbers grow. Click the text field to activate it, type a new name, and then press the Enter key to finish.
All panels can be undocked by dragging their top bar. Re-dock by dragging the panel over a workspace edge until a vertical green line appears (Figure 1-12) and then releasing the mouse. Keep the browser open or click the minus sign (–) to minimize it.
Selecting
The first entry under the Select menu is the Select tool. Clicking it deselects whatever tool you’re in. Dragging it from the upper left to the lower right makes a selection window that selects everything inside it. Dragging it from the lower right to the upper left makes a crossing window, which selects everything it touches.
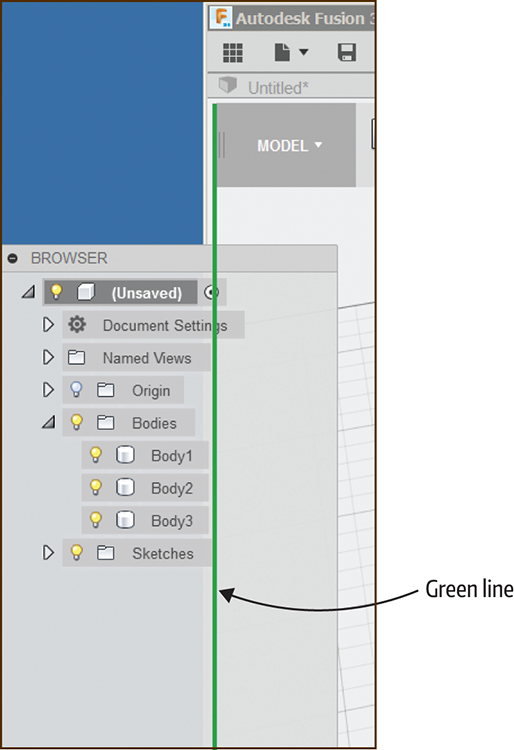
Figure 1-12: To dock or undock the browser, drag it over a workspace edge until a green line appears.
You can also select bodies and components by clicking their browser entry. This ensures that you select the whole item. When you select an item by clicking it directly or by dragging a window around it, sometimes you might not select the whole item, which will result in tools not working on it.
Each browser entry has a light bulb in front of it. When the bulb is yellow, the item is visible; when the bulb is gray, the item is hidden. When there are subcategories, such as the category Body and five bodies under it, the category can be turned off but an individual item under it turned on. Likewise, a category can be turned on but an individual item under it turned off.
Timeline
Also called the history tree, the timeline is a row of icons that appears at the bottom of the screen while you’re designing parametrically. There’s an icon for each action performed (Figure 1-13). The timeline grows with the project, and multiple icons can be grouped (click the first icon, hold the Shift key down, and click the last icon) to make it more manageable.
Double-click an icon to select its corresponding feature in the model; right-click an icon to access a context menu; drag an icon left or right to change the order in which operations are calculated. Move the slider to the left to “go back in time”—that is, to revisit earlier operations. A yellow icon means that feature has a warning; perhaps you’ve deleted something that Fusion needs to keep the design intact, but Fusion cached it, enabling you to continue working. A red icon means there’s an error; an example is the edge that a fillet used was deleted, meaning the fillet can’t be constructed anymore. It’s best to fix warnings and errors as they arise.
You can turn off the timeline by right-clicking the browser’s title field and clicking Do Not Capture Design History. This puts you in direct modeling mode, which you may find easier and more intuitive than parametric modeling mode. To turn the timeline back on, right-click the browser’s title field and click Capture Design History. The timeline will start from that point; you permanently erase all previous timeline icons when you enter Direct Mode.
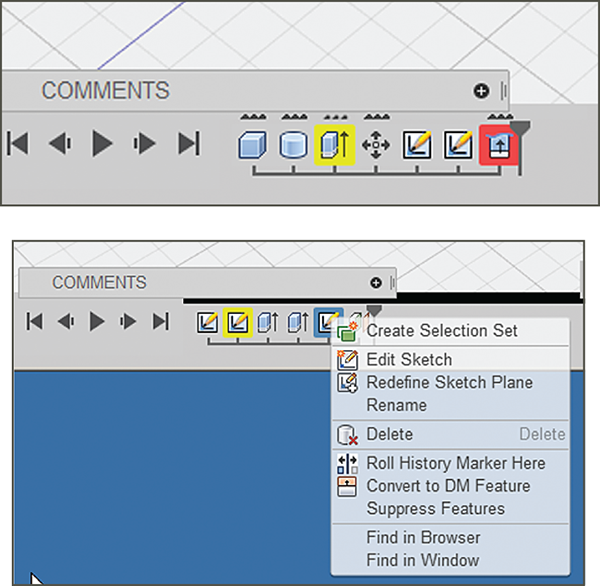
Figure 1-13: The timeline has icons of all operations performed. (Top) Red and yellow highlights indicate warnings or problems. (Bottom) Right-click an icon for a context menu.
Navigation Panel
The Navigation panel contains tools that let you zoom, pan, and orbit. It also has display settings that affect the workspace and how the model appears (Figure 1-14). For instance, you can change the grid size, change how the mouse snaps to the grid, see the model as wireframe, and see multiple views of it on one screen. The following is a description of the navigation tools. Click the dropdown arrow next to each icon to see options.
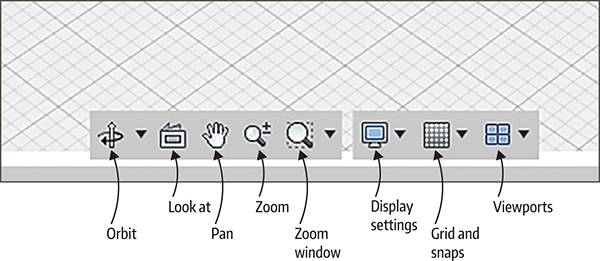
Figure 1-14: The Navigation bar
- Orbit: This whirls you, the viewer, around the model so you can see it from all angles and heights. Your position relative to the model moves, not the model itself. You can orbit constrained or free. Constrained orbits around the x-y plane or the z-axis. Free orbits in any direction. A quicker way to free orbit is to hold the Shift key down first, and then hold down the mouse’s scroll wheel.
- Look At: Click a spot on the model and then click this icon. The model’s position will adjust accordingly.
- Pan: This moves the model around on the screen. Pan more efficiently by holding down the scroll wheel of the mouse and moving it around.
- Zoom: This gives you a magnified view of the model (think telephoto lens) to see small details, or reduces your view of it (think wide-angle lens) to see the big picture. Zoom more efficiently by rotating the mouse’s scroll wheel up and down.
- ZoomWindow: Drag a window around a specific location you want to look closer at. The Fit option fills the screen up with the model. If your model hides off in a corner after you click it, you’ve got little pieces you drew earlier still hanging around. Find and erase them, and your model will come back. Clicking Fit is a way to locate “lost” pieces.
- Display Settings: Adjust the look of the workspace.
- Grid and Snaps: Make the grid visible or invisible; adjust its settings and the snap increments.
- Viewports: Show the workspace as one large workspace or as smaller, multiple workspaces.
Comments Panel
Type comments here to collaborators (Figure 1-15) and click Post when finished. Click the minus (–) sign to minimize it. Dock it by moving it over a vertical workspace edge until a green line appears, and then release the mouse.
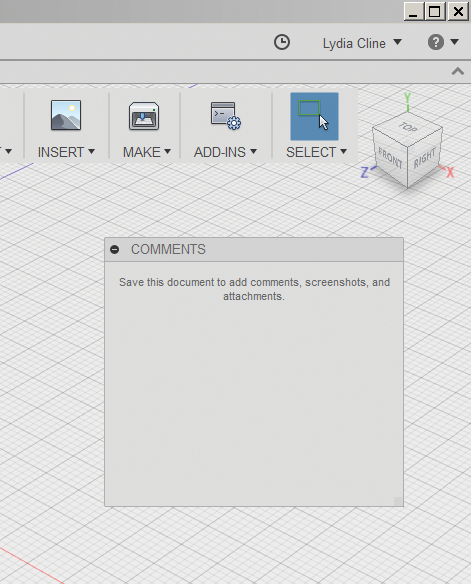
Figure 1-15: The Comments bar is for typing notes to collaborators.
The Marking Menus
To perform the same action over and over, use the marking menus. Right-click, hold, and drag the mouse to the left or right to access it (Figure 1-16). This brings up a menu that includes a command for the last operation performed.
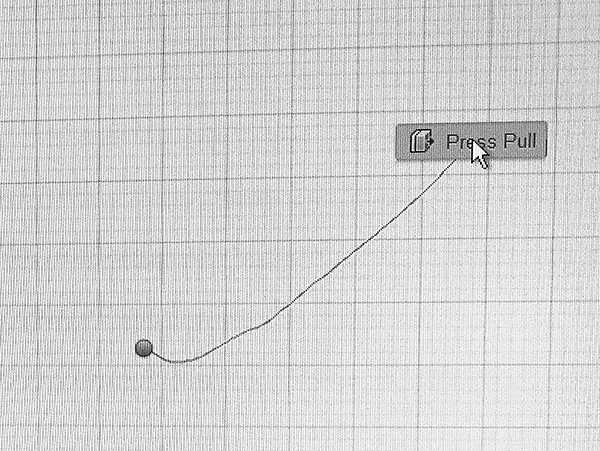
Figure 1-16: Right-click, hold, and drag the mouse left or right to access the marking menus.
Collaboration
Log on to a360.autodesk.com to access your cloud-based workspace (Figure 1-17). Here’s where your files are stored, and you can access them from your desktop computer, mobile device, or the web. You can share and discuss your work with others. You can also rename the files. Figure 1-17 shows my workspace; the files are on the Data tab. Click the Calendar tab to enter important dates; click the Discussions tab to post notes; or click the Invite button to bring other people into the project.
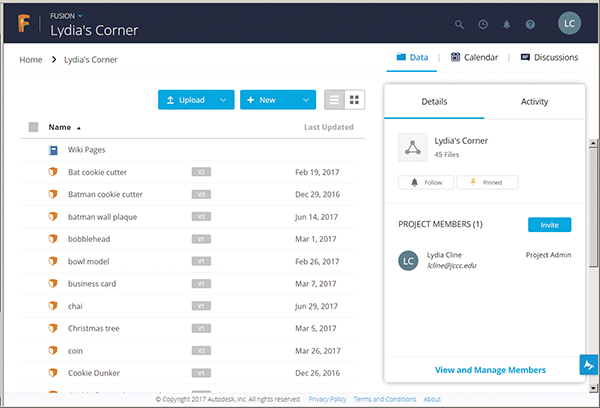
Figure 1-17: The online workspace
Saving Files On- and Offline
To save a file, click File/Save or File/Save As. This will save your file to Autodesk’s servers, and you can access them by clicking the Data panel icon or going directly to your A360 account. You can also save your files offline by clicking File/Export and checking Save To My Computer (Figure 1-18). You’ll be able to work on that file offline and send it to others. Note the New Design From File choice. That’s how you open a Fusion or any other supported file that’s stored on your computer. You can also export any drawing you make as a DXF file and print it. Many free DXF viewers are available, and they’ll let you print the drawing to scale.
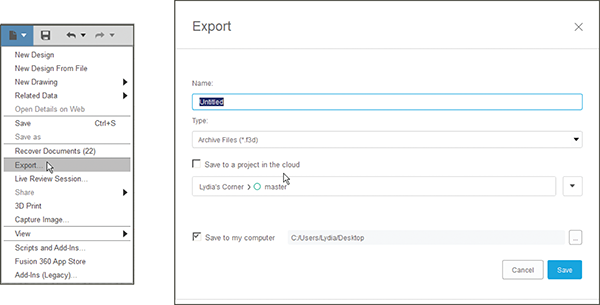
Figure 1-18: Save files offline with the Export function.
Screenshots
There is no option to send the file to a traditional printer. If you want paper copies of your model, click File/Capture Image (Figure 1-19) to make a screenshot. Alternatively, make a screenshot on a PC by typing snip in the Start menu search field to bring up the snipping tool, and then dragging the cursor around the area you want to screenshot. On a Mac, press Command+Shift+4, which temporarily replaces the cursor with a selection window, and then click and drag the tool to make your selection. The screenshot will appear on the desktop.
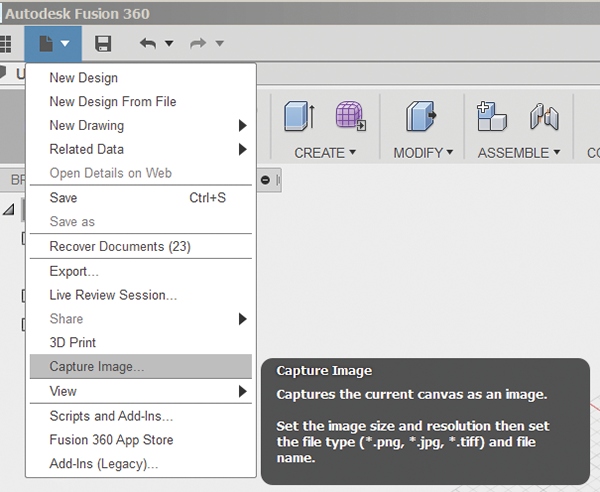
Figure 1-19: The Capture Image feature makes a screenshot.
Graphics Diagnostic Tool
If Fusion is running slowly on your device, check out the Graphics Diagnostic tool. Click Help/Graphics Diagnostic and a window will appear, showing the current settings (Figure 1-20). You might be able to adjust them for better performance. There’s also a Copy To Clipboard button for pasting the graphics information into a word processing program.
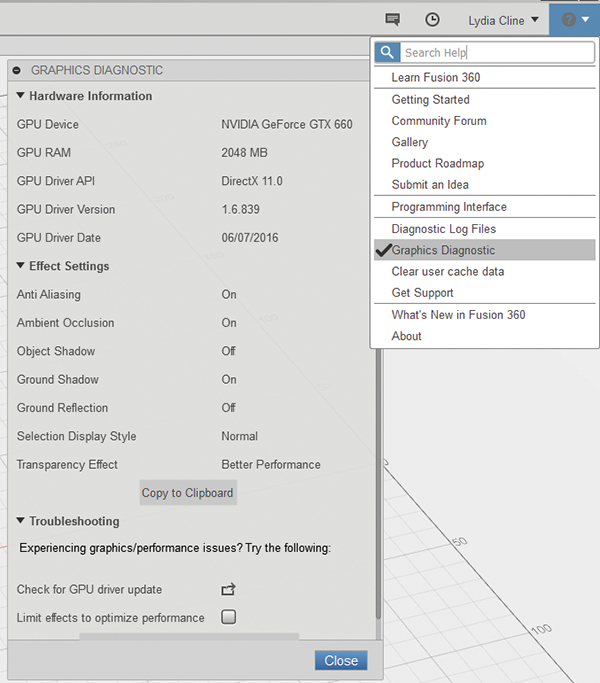
Figure 1-20: The Graphics Diagnostic tool
And now that you’ve been introduced to Fusion 360, join me in Chapter 2, where you’ll learn how to sketch!