In this chapter, we will cover:
- Logging meaningful steps within your route
- Debugging using logging
- Throughput logging
- Enabling step-by-step tracing in code
- Disabling JMX
- Configuring JMX
- Naming your routes to make it easier to monitor
- Adding JMX attributes and operations
- Monitoring other systems using the Camel JMX Component
- Setting breakpoints in your routes
In this chapter, we will explore a number of capabilities that Camel includes to make it easier to monitor and debug your Camel integration routes. A number of the logging recipes can be used to help with both debugging your routes, and to track significant events or data within your routes. Many of this chapter's recipes will explore Camel's JMX integration.
Java Management Extensions (JMX) is a Java standard technology, included within the default Java runtime, for managing and monitoring applications and systems. JMX allows a runtime environment to remotely expose instrumented resources (MBeans) that have metrics (read/write properties) and operations. This allows remote consoles to do the following:
- Collect runtime statistics about system by reading those MBean properties
- Make updates to the running system by changing those MBean properties such as updating the number of threads in a pool
- Perform actions using MBean operations, such as purging a Queue of messages by calling the Queue MBean's purge operation
A full description of JMX is beyond the scope of this book. You can read more at the Java SE documentation site for JMX at http://docs.oracle.com/javase/7/docs/technotes/guides/jmx/index.html.
Camel includes deep JMX integration that provides very fine-grained metrics and operations, which can help to keep your integrations working well in production environments. This integration provides you with the ability to enable, disable, and change configurations that impact runtime behavior of Camel. This includes turning debugging information on or off, and changing configurations that directly impact the routing and processing of messages. Camel, as always, includes meaningful defaults that allow you to use these capabilities with minimal configuration, and allows you to fine-tune, override, and extend as needed.
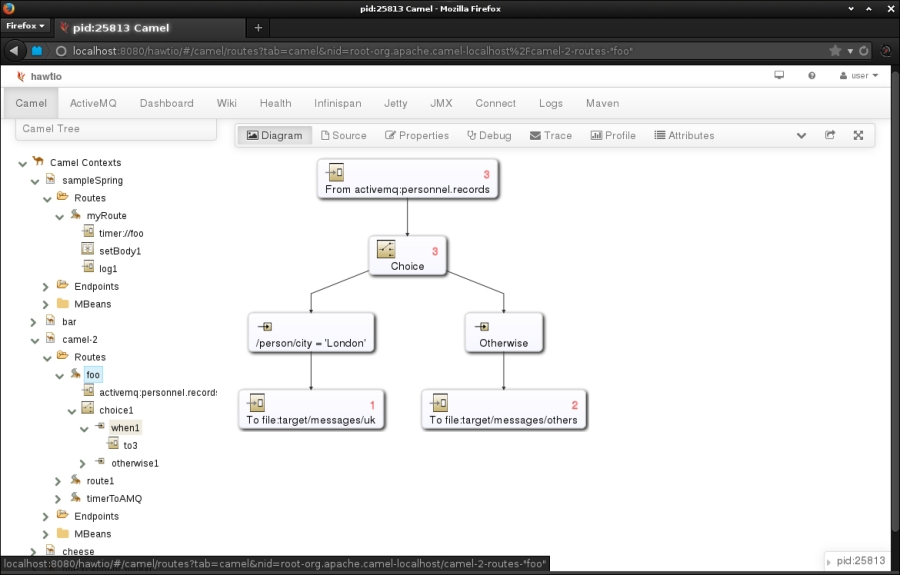
This chapter includes screenshots of an open source web console called hawtio (http://hawt.io) which was started by the creator of Apache Camel, James Strachan. This console includes a number of capabilities that you can use with your Camel-based integrations, including: visualizing and editing routes, graphical debugging and message tracing, interacting with JMX, and searching your log entries. This chapter could not do justice to all of the cool features within the hawtio console. However, we have included some screenshots to help you better understand how debugging and monitoring work in Camel, and maybe to encourage you into trying hawtio yourself.
A number of Camel architectural concepts are used throughout this chapter. There is a broader overview of Camel concepts in the Preface. Full details can be found at the Apache Camel website at http://camel.apache.org.
The code for this chapter is contained within the camel-cookbook-monitoring module of the examples.