
Camel's ability to allow you to create route "recipes" (definitions) is very powerful, but it can make traditional debugging difficult. You cannot easily set a breakpoint on a line of Spring XML. Likewise, setting a breakpoint in your RouteBuilder.configure() method will not yield the results you want as it only gets called once at startup when your route definition is parsed into a runtime route (other code).
This recipe will show you how, in your unit tests, to define methods that will be called before and after every processor step, giving you a line of Java code where you can set breakpoints to more easily debug your code.
The Java code for this recipe is located in the org.camelcookbook.monitoring.debug package. The Spring XML files are located under src/main/resources/META-INF/spring and prefixed with debug.
This recipe's instructions assume that you have an existing route definition that you are trying to debug. Within this recipe we will debug the following:
public class DebugRouteBuilder extends RouteBuilder {
  @Override
  public void configure() throws Exception {
    from("direct:start")
      .transform(simple("Debug ${body}"))
      .log("${body}")
      .to("mock:result");
  }
}
The steps detailed in this recipe are identical regardless of whether your route is defined using the Java or XML DSLs. It does assume you are using Camel's test support, in that your unit tests extend CamelTestSupport. For Spring testing, CamelSpringTestSupport extends CamelTestSupport.
In order to debug messages as they flow through your routes, perform the following steps:
- In your
CamelTestSupportextended unit test, override theisUseDebugger()method and have it returntrue:public class DebugTest extends CamelTestSupport { @Override public boolean isUseDebugger() { return true; } } - To enable the setting of breakpoints before each processor step, override the
debugBeforemethod from the baseCamelTestSupportclass:@Override protected void debugBefore(Exchange exchange, Processor processor, ProcessorDefinition<?> definition, String id, String label) { // This method is called before each processor step. // Set your breakpoint here log.info("Before {} with body {}", definition, exchange.getIn().getBody()); } - To enable the setting of breakpoints after each processor step, override the
debugAftermethod from the baseCamelTestSupportclass:@Override protected void debugAfter(Exchange exchange, Processor processor, ProcessorDefinition<?> definition, String id, String label, long timeTaken) { // This method is called after each processor step // Set your breakpoint here log.info("After {} with body {}", definition, exchange.getIn().getBody()); }
An instance of a Camel Debugger can be associated with a Camel context. This leverages Camel's InterceptStrategy to call Camel Breakpoint instances before and/or after each processor step in a route. The CamelTestSupport class will enable two simple callback methods that you can override—debugBefore and debugAfter—if the isUseDebugger() method returns true. This provides an easy way for you to set breakpoints in your route definitions without needing to learn the full Debugger API.
The Camel Debugger allows you to associate one or more Breakpoint instances with your Camel context. Each Breakpoint allows you to have code called before and after route processor steps, and on exchange events. The Breakpoint instances can also be suspended and resumed. You can also create conditional Breakpoint instances that will only be called if its associated Condition match, meaning it has rules to say to define which processor steps it should break on. All the things that you would expect to enable full debugging capabilities.
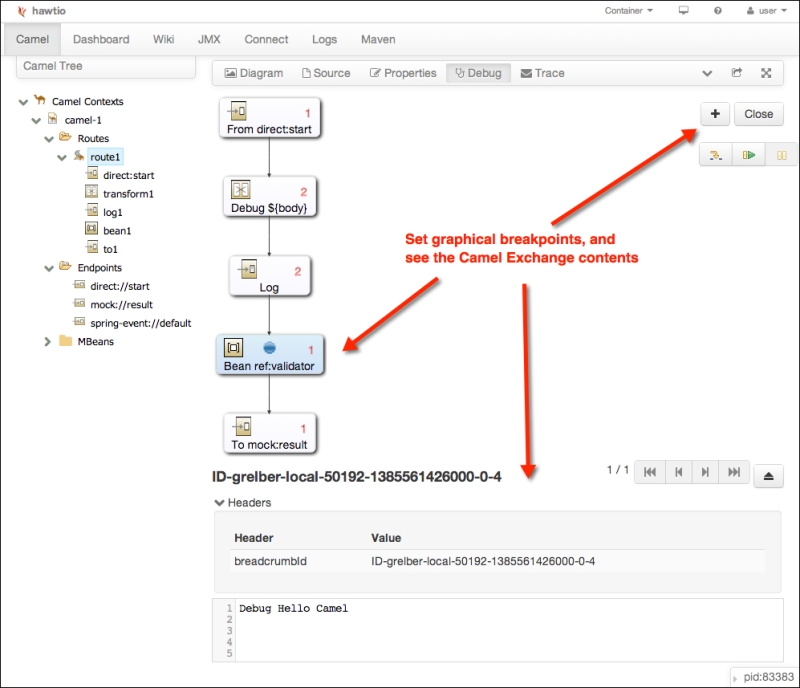
The hawtio console uses the Camel Debugger to allow you to set breakpoints on its visualization of the Camel route.
The hawtio console also includes a Logs tab that can show you stack traces as shown in the following screenshot:
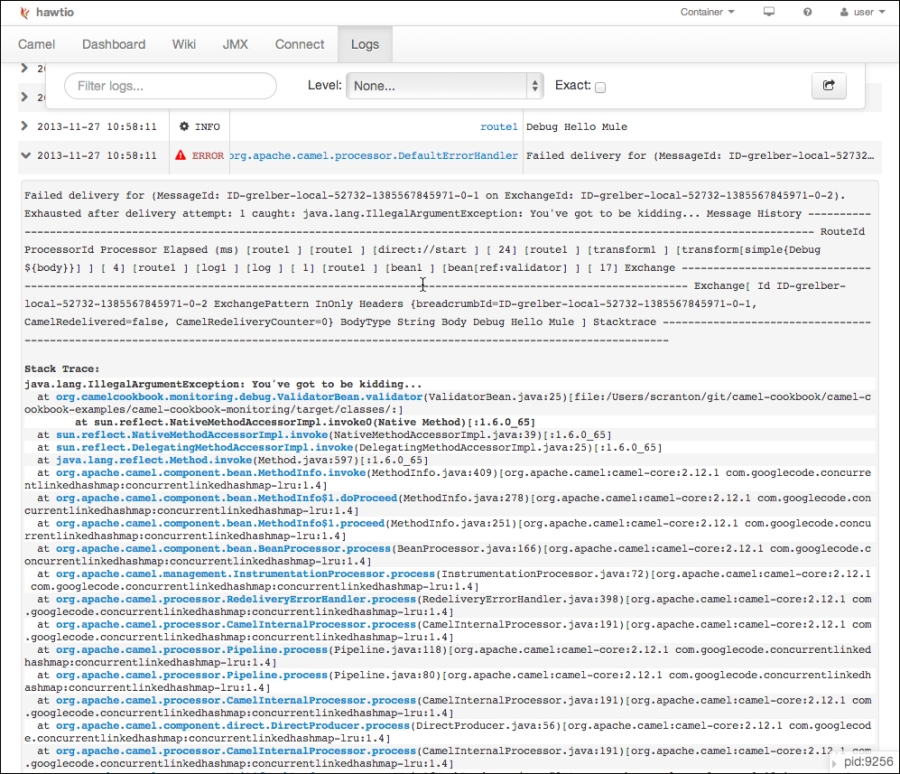
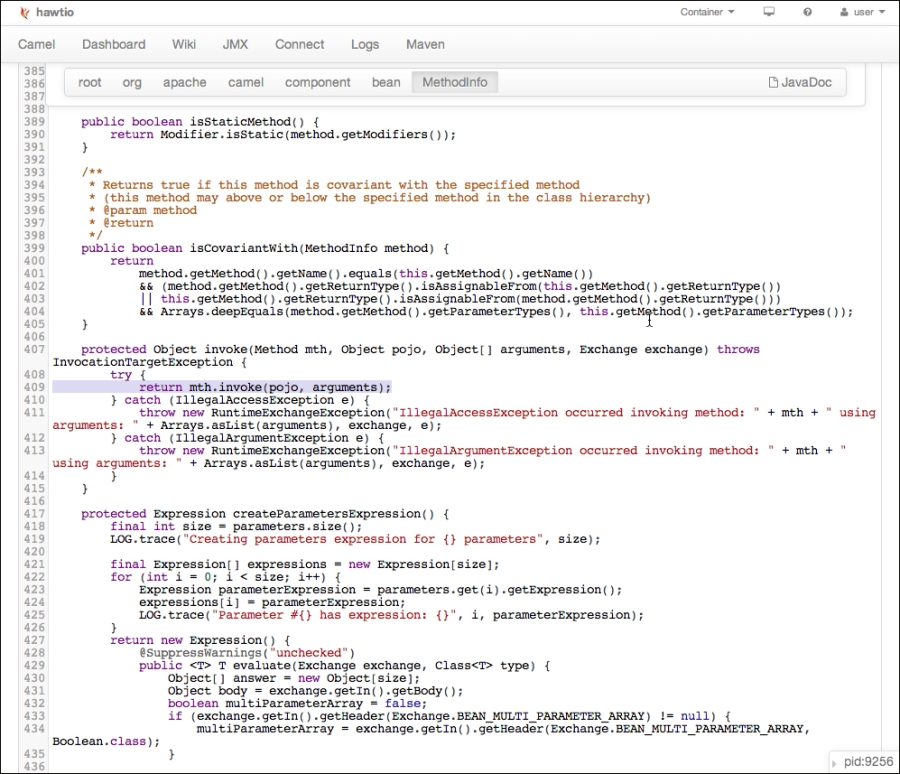
This allows you to jump directly to the line of code, assuming you have generated a source jar for your Camel Maven project.
- Camel Debugger: http://camel.apache.org/debugger.html