
Just like SNMP in the previous chapter, we can use Python scripts and other tools to directly poll the device. However, there are tools such as Cacti, which is an all-in-one open source package, that includes data collection (poller), data storage (RRD), and a web frontend for visualization.
In the case of NetFlow, there are a number of open source and commercial NetFlow collectors you can choose from. If you do a quick search for "top N open source NetFlow analyzer," you will see a number of comparison studies for different tools. Each one of them has their own strong and weak points; which one to use is really a matter of preference, platform, and your appetite for customization. I would recommend choosing a tool that would support both v5 and v9, potentially sFlow as well. A secondary consideration would be if the tool is written in a language that you can understand; I imagine having Python extensibility would be a nice thing.
Two of the open source NetFlow tools that I like and have used before are NfSen (with NFDUMP as the backend collector) and ntop (or ntopng). Between the two of them, ntop is a better-known traffic analyzer; it runs on both Windows and Linux platforms and integrates well with Python. Therefore, let's use ntop as an example in this section.
The installation of our Ubuntu host is straightforward:
$ sudo apt-get install ntop
The installation process will prompt for the necessary interface for listening and the administrator password. By default, the ntop web interface listens on port 3000, while the probe listens on UDP port 5556. On the network device, we need to specify the location of the NetFlow exporter:
!
ip flow-export version 5
ip flow-export destination 172.16.1.173 5556 vrf Mgmt-intf
!
We will also need to specify which the direction of traffic exports, such as ingress or egress, under the interface configuration:
!
interface GigabitEthernet0/0
...
 ip flow ingress
 ip flow egress
...
For your reference, I have included the Ansible playbook, cisco_config_netflow.yml, to configure the lab device for the NetFlow export.
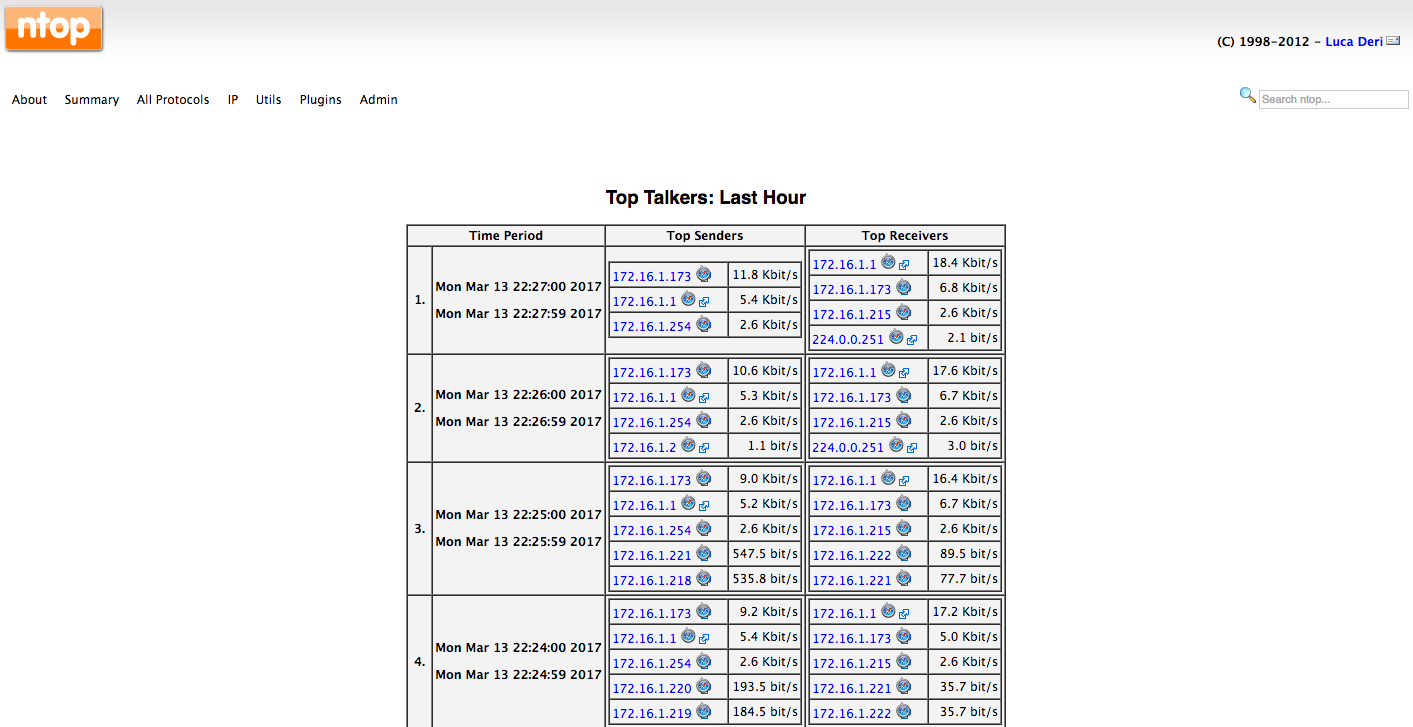
Once everything is set up, you can check the ntop web interface for local IP traffic:

One of the most often used features of ntop is using it to look at the top talker graph:
The ntop reporting engine is written in C; it is fast and efficient, but the need to have adequate knowledge of C in order to change the web frontend does not fit the modern agile development mindset. After a few false starts with Perl in the mid-2000s, the good folks at ntop finally settled on embedding Python as an extensible scripting engine. Let's take a look.