
A fractal is a never-ending pattern that repeats itself at all scales. Fractals are found everywhere in nature. We find them in our blood vessels, branches of trees, and in the structure of our galaxies, and the beauty of them lies in the fact that they are made out of simple formulas.
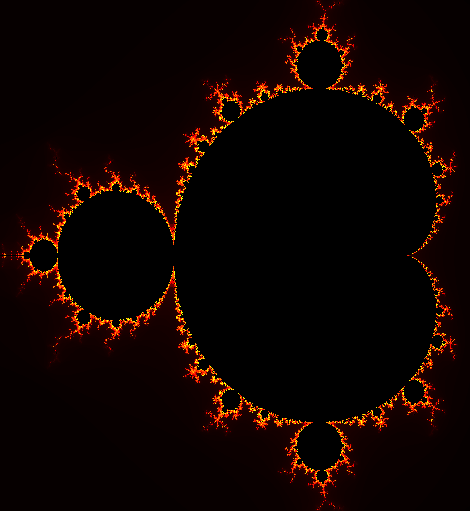
We will demonstrate the simplicity of these seemingly complex-looking phenomena by drawing a fractal named a Mandelbrot set. We assume a basic knowledge of set theory and complex numbers in this section. Our code produces a Mandelbrot set that looks like the following diagram:
The Mandelbrot set is defined as a set of complex numbers, c:

So that the complex number c obeys the following recurrence relation:

Think of recurrence relations as functions where the last output is fed as input into the same function in the next iteration.
So the Mandelbrot set is a set that only includes those complex numbers for which the previous equation does not, after any number of iterations, blow up the value of zn to infinity.
For a clearer understanding, if we take the number 1 as c and apply it to the preceding equation (note that 1 is also a complex number with no imaginary component—so real numbers are a subset of complex numbers and hence they too lie on the complex plane):
| Value of z after n iterations(zn) | Value of zn+1 = z2 n + c for c = 1 |
| z0 | 02 + 1 = 1 |
| z1 | 12 + 1 = 2 |
| z2 | 22 +1 = 5 |
| z3 | 52 +1 = 26 |
It is clear that the previous series will blow up to infinity as the number of iterations tends to infinity. Since this complex number 1 blows up the equation, it is not a part of the Mandelbrot set.
Contrast this with another number, c = -1 the values for which are plotted in the next table:
| Value of z after n iterations(zn) |
Value of zn+1 = z2 n + c for c = -1 |
| z0 | 02 + -1 = -1 |
| z1 | -12 + -1 = 0 |
| z2 | 02 + -1 = -1 |
| z3 | -12 + -1 = 0 |
Note that you may continue the preceding series up to infinity but the value will keep alternating between -1 and 0, thus never exploding. This makes the complex number -1 eligible for inclusion in the Mandelbrot set.
Now, let us try to model the preceding equation.
One immediate problem to overcome is that we cannot model infinity in the previous equation. Fortunately, it can be seen from the equation that if the absolute value of z ever exceeds 2, the equation will eventually blow up.
So a definitive way to check whether the equation blows up is to check whether the magnitude of Z > 2. The magnitude of a complex number a + ib is defined as follows:

So in order to check whether a complex number a+ib blows up the preceding equation, we need to check the following:

Or:

The next question to consider is how many times should we iterate Zn to see if its magnitude exceeds 2 or not?
The answer to this depends on the kind of image resolution you seek to obtain in the final image. In general, the higher the maximum number of iterations, the greater the image resolution, subject to the limitation of individual pixel size, beyond which you can never go in terms of details. In practice, an iteration of a few hundred times is sufficient. We use a maximum iteration of 200 as that is enough to determine whether or not the equation blows up for a small-scale image that we will draw. Accordingly, we define a variable in 8.08_Mandelbrot.py as follows:
max_number_of_iterations = 200
Next, we define a method that takes in the real and imaginary components of a complex number, and tells whether the equation blows up for the complex number input.
For example, the method should return 2 for an input of 1, as the path to blow up is sensed right in the second iteration for the input value 1. However, if we give it an input of -1, the equation never blows up so it runs for the maximum number of iterations and returns the maximum_iteration_count, which we have defined as 200 and is akin to saying that the said number belongs to the Mandelbrot set (8.08_Mandelbrot.py):
print(mandelbrot_set_check(1, 0)) # returns 2
print(mandelbrot_set_check(-1, 0)) # returns 200
Accordingly, we define the mandelbrot_set_check method as follows (8.08_Mandelbrot.py):
def mandelbrot_set_check(real, imaginary):
  iteration_count = 0
  z_real = 0.0
  z_imaginary = 0.0
  while iteration_count < max_number_of_iterations and
        z_real * z_real + z_imaginary * z_imaginary < 4.0:
    temp = z_real * z_real - z_imaginary * z_imaginary + real
    z_imaginary = 2.0 * z_real * z_imaginary + imaginary
    z_real = temp
    iteration_count += 1
  return iteration_count
The code simply implements the recurrence relation for the Mandelbrot set.
While it's sufficient to know whether a complex number lies in the Mandelbrot set, we also keep a track of the iteration count, also called the escape time, which is the number of iterations it took a complex number to blow up, if it does blow up. If the iteration count returns as maximum_number_of_iterations, it means the complex number does not blow up the equation and the escape time is infinite, that is, the number is a part of the Mandelbrot set. We keep track of the iteration count as we will use this data to paint areas with different escape times in different colors.
Now that we have a way to tell whether or not a complex number belongs to the Mandelbrot set, we need a set of complex numbers to run through this method. In order to do that, we first define a maximum and a minimum complex number, between which we will check for inclusion in the Mandelbrot set. Note that in the following example, we have set the range of complex numbers between -1.5-1i and 0.7+1i.
You can try different ranges of these complex numbers, as long as the area falls inside a circle of radius 2, and it will print different regions of the Mandelbrot set:
min_real, max_real, min_imaginary, max_imaginary = -1.5, 0.7, -1.0, 1.0
Let's next proceed by defining the image_width and image_height variables as follows:
image_width = 512
image_height = 512
To draw the Mandelbrot set in an image, we need to map each pixel coordinate of the image to our complex numbers. Having defined the maximum and minimum range for the real and imaginary parts of our complex numbers, it's simply a matter of interpolating the complex numbers to map them to the pixel coordinates.
The following two methods do that for us (8.08_Mandelbrot.py):
def map_pixels_to_real(x):
  real_range = max_real - min_real
  return x * (real_range / image_width) + min_real

def map_pixels_to_imaginary(y):
  imaginary_range = max_imaginary - min_imaginary
  return y * (imaginary_range / image_height) + min_imaginary
Now we are ready to draw the actual image. We create a Tkinter root window, draw a canvas atop it, and then run the following loops:
for y in range(image_height):
 for x in range(image_width):
   real = map_pixels_to_real(x)
   imaginary = map_pixels_to_imaginary(y)
   num_iterations = mandelbrot_set_check(real, imaginary)
   rgb = get_color(num_iterations)
   canvas.create_rectangle([x, y, x, y], fill=rgb, width=0)
The preceding code takes each pixel in the image, maps its x, y coordinates to a real and imaginary number respectively, and then send this number out to the mandelbrot_set_check method, which in turn returns the number of iterations it took for the number to blow up. If the number did not blow up, it returns the value of maximum_number_of_iterations. With this number in hand, we call another method that gives an RGB color code, which is just based on some arbitrary numbers. It just adds the cosmetic value, and you can play with different arbitrarily designed color mapping schemes to generate Mandelbrot images of different colors. Finally, we use this color to fill the (x, y)th pixel on the canvas.
This concludes the iteration. Our code can now generate the Mandelbrot set. However, note that this code takes some time to generate the Mandelbrot set.