
This chapter teaches you different techniques to monitor and tune an Azure SQL database. You will learn to monitor an Azure SQL Database using the Azure portal, Dynamic Management Views ( DMVs), and Extended Events.
You will also learn how to tune an Azure SQL Database using Automatic tuning and Query performance insight.
You will learn to implement in-memory features to improve workload performance.
By the end of this chapter, you will be able to:
- Monitor and tune an Azure SQL Database from the Azure portal
- Monitor an Azure SQL Database using Dynamic Management Views
- Monitor an Azure SQL Database using Extended Events
- Implement in-memory technologies to improve database performance
The Azure portal provides multiple monitoring options, which are available under the Overview | Monitoring | Support + Troubleshooting sections for an Azure SQL Database:

Let's talk about each of these options in detail.
Database metrics such as CPU percentage, DTU percentage, data I/O, and other metrics can be monitored through the overview section.
The overview section displays the DTU percentage from the past hour of an Azure SQL Database in the form of a line chart:

You can even pin the chart on your Azure portal dashboard by clicking on the pin icon in the upper-right corner of the chart.
This way, you can monitor the DTU percentage as and when required.
Note
In order to see the graph working, you will require some workload running. You can achieve this by executing the
Start-Workload.sql file placed in the
C:codeLesson09 folder.
Open a new PowerShell command and run the following command:
.Start-Workload.ps1 -sqlserver toyfactory -database toystore -sqluser sqladmin -sqlpassword Packt@pub2 -ostresspath "C:Program FilesMicrosoft CorporationRMLUtilsostress.exe" -workloadsql .workload.sql
The
preceding command will use the
ostress.exe rml utility to execute the queries specified in the
workload.sql file against the
toystore database in the
toyfactory Azure SQL Server.
For a more detailed analysis and to monitor other metrics, click on the line chart:

The Metrics blade gives you further insight into the workload by allowing you to monitor other metrics such as CPU percentage, Data I/O, percentage, Database size percentage, and others.
Hover the mouse over the line chart and the metrics at that point in time will be displayed at the bottom.
The Metric blade also allows you to view metrics in multiple ranges such as the past hour, the past 24 hours, the past week, and a custom time range.
Select the metrics you want to monitor together, name the chart, and pin it to the Azure portal dashboard for future monitoring.
You can select one more metric and analyze the type of workload. For example, in the preceding chart, the workload is CPU-intensive as the DTU percentage is equal to the CPU percentage, because there isn't any Data I/O percentage recorded during the given time.
You can add the alert on the metric for proactive monitoring. For example, you can add an alert to send email notifications whenever the DTU percentage crosses a threshold, say, that is greater than 80%, or the database size is bigger than 80%.
You can even take preventative actions automatically by using runbooks, similar to what was explained in Chapter 6, Scaling Out Azure SQL Database.
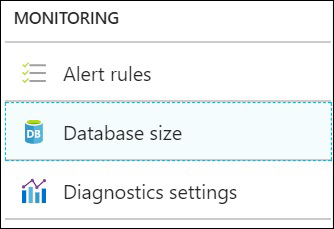
In this section, we will discuss how to create Alerts using the Azure Portal, view database size, and capture data using Diagnostic settings.
As stated earlier, you can create email alerts on metrics you wish to monitor. To create an alert using Azure Portal, in the database overview blade, select Alert Rules under the monitoring section.
In the Alert Rules blade, select Add alert and fill out the alert details to create and set up the alert:

You can also add a webhook to the alert to take preventative action automatically when the alert threshold is reached. For example, let's say you create an alert that sends out an email whenever the database size crosses the 80% (used) threshold.
The administrator sees the email alert and increases the database size so that the customers aren't affected. However, you can automate this by:
- Creating an Azure Automation job that runs a PowerShell script to increase the database's size
- Creating a webhook for the Azure Automation job
- Specifying the webhook in the Alert definition
The next time the database size percentage is greater than 80%, the alert will send out an email notification to the administrator and will trigger the webhook. This will start the Azure Automation job, and the database size will be increased.
The database size option under the monitoring section provides a chart representation of the current and max database size. It also gives an option to change the database's size:

The change database size link opens the Configure Performance blade, wherein you can change the service tier or change the database size within the same service tier.
Diagnostic settings allow you to collect relevant data such as database wait statistics, timeouts, errors, and blockings so as to troubleshoot performance issues or audit an Azure SQL Database.
The following data can be captured using diagnostics settings:
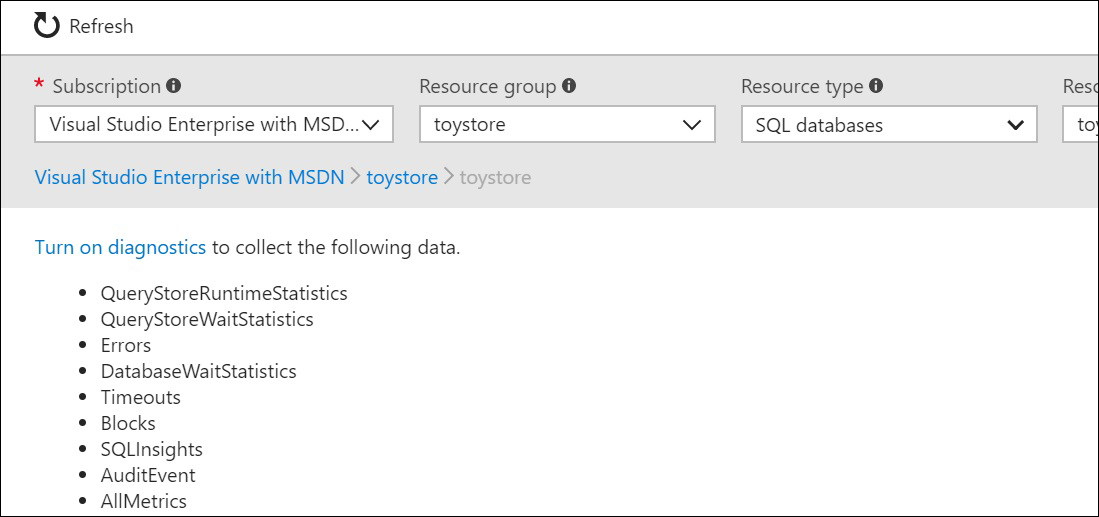
To enable diagnostic settings, select the database and the server you want to enable it for and then select Turn on diagnostics.
In the Diagnostics settings blade:
- Provide the setting name, for example, if you plan to collect wait stats, you can name it toystore wait stats.
- Select Archive to a storage account and then select the storage account where the diagnostic data will be saved.
You can also stream the data to an event hub for real-time monitoring or send it to Log Analytics.
- Check
DatabaseWaitStatisticsand set the retention to one day. The retention only applies to the Archive to Storage option.The archive to storage option lets you save the diagnostic data to an Azure Storage container. The log files can therefore be used for troubleshooting as and when required:

- Click Save to start collecting the data.
The logs will be captured and archived to the given storage account:

The logs are saved in JSON format, and have data, as shown in the following code:
{
    "records":
    [

        {
             "LogicalServerName": "toyfactory",
             "SubscriptionId": "bf64f3c6-6e64-48c5-a7cc-6c35b4f9aebf",
             "ResourceGroup": "toystore",
             "time": "2018-01-30T02:42:27.2000000Z",
             "resourceId": "/SUBSCRIPTIONS/BF64F3C6-6E64-48C5-A7CC-6C35B4F9AEBF/RESOURCEGROUPS/TOYSTORE/PROVIDERS/MICROSOFT.SQL/SERVERS/TOYFACTORY/DATABASES/TOYSTORE",
             "category": "DatabaseWaitStatistics",
             "operationName": "DatabaseWaitStatistcsEvent",
             "properties": {"ElasticPoolName":"","DatabaseName":"toystore","start_utc_date":"2018-01-30T02:42:27.2000000Z","end_utc_date":"2018-01-30T02:47:27.1530000Z","wait_type":"SOS_SCHEDULER_YIELD","delta_max_wait_time_ms":0,"delta_signal_wait_time_ms":3267,"delta_wait_time_ms":3266,"delta_waiting_tasks_count":51}
              ...
...
    ]
}
You can analyze the JSON in your favorite JSON editor or in SQL Server 2016.
- To delete the diagnostics setting, navigate to the diagnostics settings blade and click Edit setting against the diagnostics setting you wish to delete:

In the resultant blade, select Delete to delete the setting:

Query Performance Insight works on top of the Query Store and requires that Query Store is enabled on the Azure SQL Database.
Query Store, introduced in SQL Server 2016, records queries, plans, and runtime statistics for detailed query performance analysis.
In an on-premises SQL Server, Query Store provides a graphical interface, which lists down queries by time windows. This helps in analyzing database usage patterns and query plan changes.
It provides an easier way to identify and force the best query plan out of multiple query plans of the same query.
Note
To read more about Query Store for On-Premises SQL Servers, go to https://docs.microsoft.com/en-us/sql/relational-databases/performance/monitoring-performance-by-using-the-query-store.
Query Performance Insights analyze the data collected in the Query Store and:
- Provides percentage usage of CPU, Data I/O, and Log I/O database metrics which constitute DTUs.
- Lists out the top queries by CPU, Data I/O, Log I/O, duration, and execution count. It also provides further details into individual queries such as execution count, duration, CPU, Data I/O, and Log I/O percentage utilization.
- Lists out performance recommendations for Create Index, Drop Index, Fix Schema Issue, and Parameterized Queries.
In this section, we will understand how to monitor queries using the Query Performance Insight blade. Consider Mike, who plans to keep track of Query performance insight and to monitor queries of Toystore Ltd. He runs through a workload to generate some database activity and then observes the Query Performance Insight blade for the queries. The detailed steps are given below:
- To start the workload, open a new PowerShell console window and execute the following command:
powershell.exe "C:codelesson09Start-Workload.ps1 -sqlserver toyfactory -database toystore -sqluser sqladmin -sqlpassword Packt@pub2 -workloadsql "C:CodeLesson09workload.sql" -numberofexecutions 10"
Note
You may get the following warning. Ignore this.
"WARNING: Could not obtain SQL Server Service information. An attempt to connect to WMI on 'Microsoft.WindowsAzure.Commands.SqlDatabase.Types.ps1xml' failed with the following error: The RPC server is unavailable. (Exception from HRESULT: 0x800706BA)"
The preceding command will execute the queries specified in the
workload.sqlfiles 10 times, as specified by thenumberofexecutionsvariable. This will generate some database activity for you to analyse.You will have to wait for another 5-10 minutes for the details to show on the Azure Portal.
- Navigate to the toystore database on the Azure Portal (https://portal.azure.com). In the overview blade, select Query Performance Insight under the Support + Troubleshooting section:


- A line chart showing CPU consumption of the past 24 hours by the top queries. The CPU is selected by default, however, you can all see five queries by Data IO and Log IO.
- The default aggregation applied is
SUMand is customizable. - The top five queries details that include CPU%, Data IO%, Log IO%, duration, and execution count.
- Click on ID 472 to get the query's details. The query ID will be different in your case. The query details blade shows the:
- Query text:

- Overall CPU, Data IO, and Log IO.
- CPU, Data IO, Log IO, Duration, and Execution count in a one-hour interval:

- You can select an area or a portion on the timeline from the line chart to see insights for that time duration. To do that, click and hold the mouse at the starting point on the line chart and drag it to the time interval you wish to see the insight for:


Observe that the graph shows the insights for the time period of 8:10 AM to 11:34 AM instead of 24 hours, which is shown in the first image.
You can also click on the Zoom-In and Zoom-Out icons in the upper-right corner of the chart to change the time interval.
- Query text:
- Close the query details blade to return to the Query Performance Insight blade. Select the Long Running queries tab:


The long running queries tab displays the top five long running queries from the past 24 hours.
The interval can be changed by clicking on either the Custom tab or the Customize further button.
Click on a query to get the query details so that you can get to the query details blade. This is similar to the query details blade in the last step.
- Select the Custom tab on the Query Performance Insight blade. The Custom tab provides options to further filter the insights on the time period, number of queries, metric type, and aggregation type:

Change the Metric type to Duration, the time period to the last six hours, and the Aggregation type to max and click Go to filter the insights:

This filters out the top five queries with a maximum duration of six hours. You can get further query details, as explained earlier in the section.
This completes the section.
Dynamic Management Views return diagnostic data that can be used to monitor a database's health and performance.
The metrics available on the Azure Portal can also be monitored using the following DMVs:
This DMV returns the historical analysis for all the databases in an Azure SQL Server. The data is collected and aggregated every five minutes and is retained for 14 days.
The following query returns the resource utilization from the last six hours:
-- Execute in master database
-- Get utilization in last 6 hours for the toystore database
Declare
    @StartTime DATETIME = DATEADD(HH,-3,GetUTCDate()),
    @EndTime DATETIME = GetUTCDate()
SELECT
    database_name,
    start_time,
    end_time,
    avg_cpu_percent,
    avg_data_io_percent,
    avg_log_write_percent,
    (
        SELECT Max(v)
        FROM (VALUES (avg_cpu_percent), (avg_data_io_percent), (avg_log_write_percent)) AS
        value(v)) AS [avg_DTU_percent]
FROM sys.resource_stats
WHERE database_name = 'toystore' AND
start_time BETWEEN @StartTime AND @EndTime
ORDER BY avg_cpu_percent desc
The following query returns the average CPU utilization across databases. This helps us find the most-used databases:
SELECT
    database_name,
    AVG(avg_cpu_percent) AS avg_cpu_percent
FROM sys.resource_stats
GROUP BY database_name
ORDER BY avg_cpu_percent DESC
You can further modify the preceding query to return databases exceeding a certain threshold value, say, databases with a CPU utilization greater than 80%.
This DMV records data for individual Azure SQL databases every 15 seconds, and this is retained for an hour. This allows you to further drill down for deeper insights into individual database utilization.
The following query returns the average CPU, Data I/O, Log IO, and Memory utilization for the toystore database:
-- Get Average CPU, Data IO, Log IO and Memory utilization
-- Execute in toystore database
SELECT
    AVG(avg_cpu_percent) AS avg_cpu_percent,
    AVG(avg_data_io_percent) AS avg_data_io_percent,
    AVG(avg_log_write_percent) AS avg_log_write_percent,
    AVG(avg_memory_usage_percent) AS avg_memory_usage_percent
FROM sys.dm_db_resource_stats;
The following query returns the average DTU utilization for the toystore database over the past hour:
-- Get the Average DTU utilization for toystore database
-- Execute in toystore database
SELECT
   end_time,
  (SELECT Max(v)
   FROM (VALUES (avg_cpu_percent), (avg_data_io_percent), (avg
log_write_percent)) AS
   value(v)) AS [avg_DTU_percent]
FROM sys.dm_db_resource_stats
ORDER BY end_time DESC
The DMVs used
to monitor
connections are the same as the ones used to monitor
connections in an On-Premises SQL Server, which are
sys.dm_exec_connections,
sys.dm_exec_sessions, and
sys.dm_exec_requests.
The
following query returns all sessions for the
sqladmin login:
-- Get all sessions for user sqladmin
SELECT
    session_id,
    program_name,
    status,
    reads,
    writes,
    logical_reads
from sys.dm_exec_sessions WHERE login_name='sqladmin'
The
following
query returns all requests for the
sqladmin login:
-- Get all the requests for the login sqladmin
SELECT
    s.session_id,
    s.status AS session_status,
    r.status AS request_status,
    r.cpu_time,
    r.total_elapsed_time,
    r.writes,
    r.logical_reads,
    t.Text AS query_batch_text,
    SUBSTRING(t.text, (r.statement_start_offset/2)+1,
        ((CASE r.statement_end_offset
          WHEN -1 THEN DATALENGTH(t.text)
       ELSE r.statement_end_offset
         END - r.statement_start_offset)/2) + 1) AS running_query_text
FROM sys.dm_exec_sessions s join  sys.dm_exec_requests r
ON r.session_id=s.session_id
CROSS APPLY sys.dm_exec_sql_text(r.sql_handle) AS t
WHERE s.login_name='sqladmin'
The
DMF (
Dynamic Management Function),
sys.dm_exec_sql_text, returns the query text for the given
sql_handle.
The
query_batch_text column returns all the queries being sent as a request in one batch. If you run the
workload as mentioned earlier, you will realize that the
query_batch_text column
contains all the queries specified in the
workload.sql file.
The
running_query_text column returns the query which is currently being executed. It is calculated using the
statement offset start and end values from the
sys.dm_exec_requests DMV.
The following DMVs can be used to monitor queries and procedure performance.
Note
The DMVs mentioned here are not specific to Azure SQL Database. They can be used on On-Premises SQL Servers as well.
These are not the only DMVs used to monitor performance. You can get a complete list of DMVs for Azure SQL Database from https://docs.microsoft.com/en-us/sql/relational-databases/system-dynamic-management-views/system-dynamic-management-views.
You can also refer to the following article for troubleshooting performance problems: http://download.microsoft.com/download/D/B/D/DBDE7972-1EB9-470A-BA18-58849DB3EB3B/TShootPerfProbs2008.docx.
This article is for Microsoft SQL Server 2008, however, it applies to Azure SQL Database and other higher On-Premises SQL Server versions.
This DMV returns the aggregated statistics such as execution count, reads, writes, and worker time for the cached query plans.
The following query returns the top give CPU-intensive queries:
SELECT
    TOP 5
    (total_worker_time/execution_count)/(1000*1000) AS [Avg CPU Time(Seconds)],
    SUBSTRING(st.text, (qs.statement_start_offset/2)+1,
        ((CASE qs.statement_end_offset
          WHEN -1 THEN DATALENGTH(st.text)
         ELSE qs.statement_end_offset
         END - qs.statement_start_offset)/2) + 1) AS statement_text,
    qs.execution_count,
    (qs.total_elapsed_time/execution_count)/(1000*1000) AS [Avg Duration(Seconds)]
FROM sys.dm_exec_query_stats AS qs
CROSS APPLY sys.dm_exec_sql_text(qs.sql_handle) AS st
ORDER BY total_worker_time/execution_count DESC;
The following query returns the top five long-running queries:
SELECT
    TOP 5
    (total_worker_time/execution_count)/(1000*1000) AS [Avg CPU Time(Seconds)],
    SUBSTRING(st.text, (qs.statement_start_offset/2)+1,
        ((CASE qs.statement_end_offset
          WHEN -1 THEN DATALENGTH(st.text)
         ELSE qs.statement_end_offset
         END - qs.statement_start_offset)/2) + 1) AS statement_text,
    qs.execution_count,
    (qs.total_elapsed_time/execution_count)/(1000*1000) AS [Avg Duration(Seconds)]
FROM sys.dm_exec_query_stats AS qs
CROSS APPLY sys.dm_exec_sql_text(qs.sql_handle) AS st
ORDER BY (qs.total_elapsed_time/execution_count) DESC;
You
can order
by the preceding query on the
total_logical_reads column to get the top five IO read-intensive queries.
Blocking is a scenario where a query is waiting to acquire a lock on a resource which is already locked by another query. Blocking causes major performance problems and can bring a database to a halt.
The following query returns the blocking details:
-- Get blocked queries
SELECT
  w.session_id
 ,w.wait_duration_ms
 ,w.wait_type
 ,w.blocking_session_id
 ,w.resource_description
 ,t.text
FROM sys.dm_os_waiting_tasks w
INNER JOIN sys.dm_exec_requests r
ON w.session_id = r.session_id
CROSS APPLY sys.dm_exec_sql_text (r.sql_handle) t
WHERE w.blocking_session_id>0
GO
In order to see the preceding query results, generate a blocking scenario by following the given steps:
- Open a new query window in SQL Server Management Studio and connect to the
toystoredatabase. Execute the following query:Begin Tran INSERT INTO [Warehouse].[Colors] ( ColorID, ColorName, LastEditedBy, ValidFrom, ValidTo ) VALUES ( 1001, 'Pulpy Orange', 1, Getdate(), Getdate() ) -- ROLLBACKThe preceding query will open a new transaction to insert a new row in the
Colorstable. However, observe that the transaction is left open and is not closed. - Open another query window in SSMS and connect to the
toystoredatabase. Execute the following query:INSERT INTO [Warehouse].[Colors] ( ColorID, ColorName, LastEditedBy, ValidFrom, ValidTo ) VALUES ( 1001, 'Pulpy Green', 1, Getdate(), Getdate() )The preceding query tries to insert a row in the
Colorstable, however, it is blocked by the query in step 1. - Run the following query to detect blocking:
-- Get blocked queries
SELECT
  w.session_id
 ,w.wait_duration_ms
 ,w.wait_type
 ,w.blocking_session_id
 ,w.resource_description
 ,t.text
FROM sys.dm_os_waiting_tasks w
INNER JOIN sys.dm_exec_requests r
ON w.session_id = r.session_id
CROSS APPLY sys.dm_exec_sql_text (r.sql_handle) t
WHERE w.blocking_session_id>0
GO
You should get the following output. The
session_idvalue may be different in your case:
The session ID 106 is requesting for an exclusive lock on the
Colorstable, however, session ID 130 already has an exclusive lock on theColorstable. Therefore, session ID 106 is blocked by session ID 130.To remove the blocking, uncomment and execute the
ROLLBACKcommand in the first query.
Extended Events, introduced in SQL Server 2008, are lightweight methods used to capture diagnostic information in SQL Server.
Extended Events are similar to the SQL Trace, however, they're more lightweight and scalable than SQL trace.
The following are the important components of an Extended Event.
Session
An Extended Event session, when started, captures the specified data for one or more events.
Events
Events are the
activities or actions which the data is to be recorded for. For example,
sql_statement_starting and
sql_statement_completed are the events raised whenever a SQL statement is started or completed on the given database.
Event Fields
Every event has a set
of event fields or data points which are recorded whenever the event is triggered. For example, the
sql_statement_completed event has a duration event field.
Global Fields
These are
the common data points to be recorded whenever the specified event occurs. Examples of global fields are
session_id,
sql_text,
database_name, and
database_id.
Target
The target specifies the storage to be used for the capture data. The following targets are allowed in SQL database:
- Ring Buffer target:
- Event Counter:
Counts all events occurred during a particular Extended Event session instead of capturing full event details. It can be used to characterize a workload to be CPU intensive, I/O intensive, or memory intensive.
- Event File Target:
Writes full event details to an Azure Storage Container. This allows you to do historical analysis on the saved data.
In this section, we’ll examine queries made to the toystore database using Extended Events. Mike looks after the report of query performance insight of Toystore Ltd. After generating the report, he plans to look after the Extended Events to track down the queries that are taking longer than 10 seconds to complete on the
toystore database. We'll use Extended Events to capture such queries.
- Open a new query window in SQL Server Management Studio and connect to the
toystoredatabase.Execute the following query to create the extended event session:
CREATE EVENT SESSION [LongRunningQueries] ON DATABASE
ADD EVENT sqlserver.sql_statement_completed
    (
    ACTION
        (
            sqlserver.database_name,
            sqlserver.query_hash,
            sqlserver.query_plan_hash,
            sqlserver.sql_text,
            sqlserver.username
        )
    WHERE ([sqlserver].[database_name]=N'toystore')
    )
ADD TARGET package0.ring_buffer
WITH (STARTUP_STATE=OFF)
GO
The preceding query creates an extended event session,
LongRunningQueries, with:- Event:
sql_statement_completed - Action: Specifies the global fields to capture
- Target: Ring buffer
- Startup_State: Off, which means that the session will not automatically start when the SQL Server services are started
-- Start the Event Session
ALTER EVENT SESSION [LongRunningQueries]
   ON DATABASE
    STATE = START;
Execute the following query to start the
LongRunningQueriessession: - Event:
- Execute the following PowerShell command to start the workload:
powershell.exe "C:codelesson09Start-Workload.ps1 -sqlserver toyfactory -database toystore -sqluser sqladmin -sqlpassword Packt@pub2 -workloadsql "C:CodeLesson09workload.sql" -numberofexecutions 10"
Wait for at least one execution to complete.
- Execute the following query to get the output from the extended event target:
-- Get the target data into temporary table
SELECT
    se.name   AS [XEventSession],
    ev.event_name,
    ac.action_name,
    st.target_name,
    se.session_source,
    st.target_data,
    CAST(st.target_data AS XML)  AS [target_data_XML]
into #XEventData
FROM
               sys.dm_xe_database_session_event_actions  AS ac

    INNER JOIN sys.dm_xe_database_session_events         AS ev  ON ev.event_name = ac.event_name
        AND CAST(ev.event_session_address AS BINARY(8)) = CAST(ac.event_session_address AS BINARY(8))
…
…
   -- Parse the target xml xevent into table
SELECT * FROM
(
SELECT
    xed.event_data.value('(data[@name="statement"]/value)[1]', 'nvarchar(max)') AS sqltext,
    xed.event_data.value('(data[@name="cpu_time"]/value)[1]', 'int') AS cpu_time,
 ...
WHERE duration > = 10000000
GO
DROP TABLE #XEventData
The Extended Event data is stored in an XML format. First, the query gets the target XML into a temporary table. The extended event target details are stored in
sys.dm_xe_database_session_targets dmv.A sample target xml is shown in the following code:
<event name="sql_statement_completed" package="sqlserver" timestamp="2018-02-03T16:19:28.708Z">
    <data name="duration">
      <type name="int64" package="package0"></type>
      <value>1</value>
    </data>
    <data name="cpu_time">
      <type name="uint64" package="package0"></type>
      <value>0</value>
    </data>
    <data name="physical_reads">
      <type name="uint64" package="package0"></type>
      <value>0</value>
    </data>
    <data name="logical_reads">
      <type name="uint64" package="package0"></type>
      <value>0</value>
    </data>
…
…
    </data>
Each event has an XML element with event fields as the child elements. This makes it easy to parse the event data.
When parsing data, make sure that the event field data type is the same as what is mentioned in the XML. For example, for the statement field, the data type should be
nvarchar, as in XML, the data type mentioned is the Unicode string.Once you have at least one execution of the workload completed, you should get an output similar to the following:

The query returns all of the SQL statements which have durations greater than 10 seconds.
- Execute the following query to stop and drop the extended event session:
-- Stop the Event Session
ALTER EVENT SESSION [LongRunningQueries]
    ON DATABASE
    STATE = STOP;
GO
-- Drop the Event Target
ALTER EVENT SESSION [LongRunningQueries]
    ON DATABASE
    DROP TARGET package0.ring_buffer;
GO
-- Drop the Event Session
DROP EVENT SESSION [LongRunningQueries]
    ON DATABASE;
GO