
Statistical tests are usually used to catch extreme values for individual features. The general name for this type of test is extreme-value analysis. An example of such a test is the use of the Z-score measure:

Here,  is a sample from the dataset, µ is the mean of all samples from the dataset, and
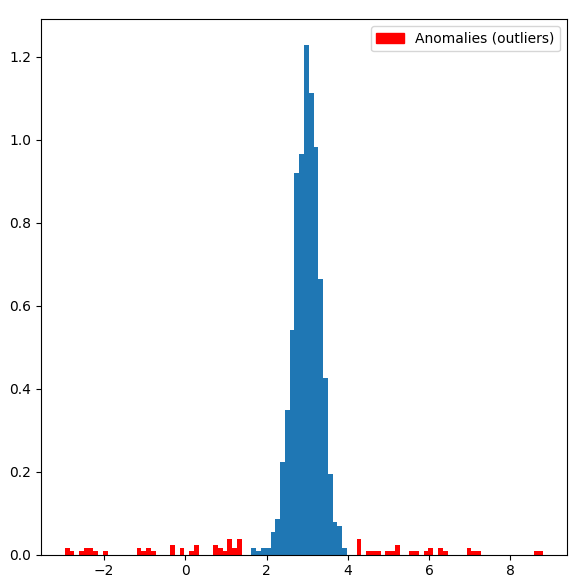
  is the standard deviation of samples in the dataset. Z-values are placed in the interval [-1, 1] and the smallest values that are close to zero are the most normal or expected ones. The following graph shows which values from some type of normally distributed data can be treated as anomalies or outliers by using the Z-score test:
One important concept that we should mention is extreme values – the maximum and minimum values from the given dataset. It is important to understand that extreme values and anomalies are different concepts. The following is a small data sample:
[1, 39, 2, 1, 101, 2, 1, 100, 1, 3, 101, 1, 3, 100, 101, 100, 100]
We can consider the value 39 as an anomaly, but not because it is a maximal or minimal value. It is crucial to understand that an anomaly needn't be an extreme value.
Despite the fact that extreme values are not anomalies in general, in some cases, we can adapt methods of extreme-value analysis to the needs of anomaly detection. But this depends on the task at hand and should be carefully analyzed by machine learning practitioners.