Chapter 12: Applying Theory to Practical Real-World Examples
In the previous chapter, we went through some useful use cases, developed thanks to ShardingSphere's many years of experience in an enterprise setting.
Based on these same use case experiences, we will now set out to provide you with methodologies to apply the use cases into practical experience.
Providing you with such examples means that by the end of this chapter, you will be able to ground the knowledge you have gained so far on ShardingSphere into real-world use cases. In other words, you will be able to apply theory to practice.
Over the course of this chapter, we will be covering the following topics:
- Distributed database solution
- Database security
- Synthetic monitoring
- Database gateway
Technical requirements
No hands-on experience in a specific language is required but it would be beneficial to have some experience in Java since ShardingSphere is coded in Java.
To run the practical examples in this chapter, you will need the following tools:
- A 2 cores 4 GB machine with Unix or Windows OS: ShardingSphere can be launched on most OSs.
- JRE or JDK 8+: This is the basic environment for all Java applications.
- Text editor (not mandatory): You can use Vim or VS Code to modify the YAML configuration files.
- A MySQL/PG client: You can use the default CLI or other SQL clients such as Navicat or DataGrip to execute SQL queries.
- 7-Zip or tar command: You can use these tools for Linux or macOS to decompress the proxy artifact.
You can find the complete code file here:
https://github.com/PacktPublishing/A-Definitive-Guide-to-Apache-ShardingSphere
Distributed database solution
In order to give you some potential common scenarios that might be encountered in the real world, we have selected a few possible cases. Reading these cases will show you how to combine multiple features to create solutions that can greatly enhance your system, and allow you to make the most of Apache ShardingSphere.
Case 1 – ShardingSphere-Proxy + ShardingSphere-JDBC + PostgreSQL + distributed transaction + cluster mode + the MOD sharding algorithm
The first case will take you through a scenario including ShardingSphere-Proxy as well as ShardingSphere-JDBC working with PostgreSQL. Distributed transactions are included with ShardingSphere's Cluster mode and the MOD sharding algorithm.
The deployment architecture
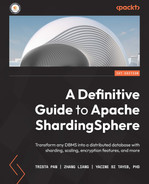
The deployment architecture of Case 1 is shown in Figure 12.1. Apache ShardingSphere's distributed database solution adopts the hybrid deployment model of ShardingSphere-JDBC plus ShardingSphere-Proxy, and centrally manages sharding rules through a configuration center. The underlying storage engine of the example distributed database is the PostgreSQL database. The XA transaction manager manages distributed transactions. The operation mode is Cluster to ensure configuration synchronization between multiple instances. The sharding algorithm is the auto-sharding algorithm, MOD. In such a case, users such as yourself do not need to worry about the underlying data distribution because the automatic sharding algorithm and scaling can help manage shard.
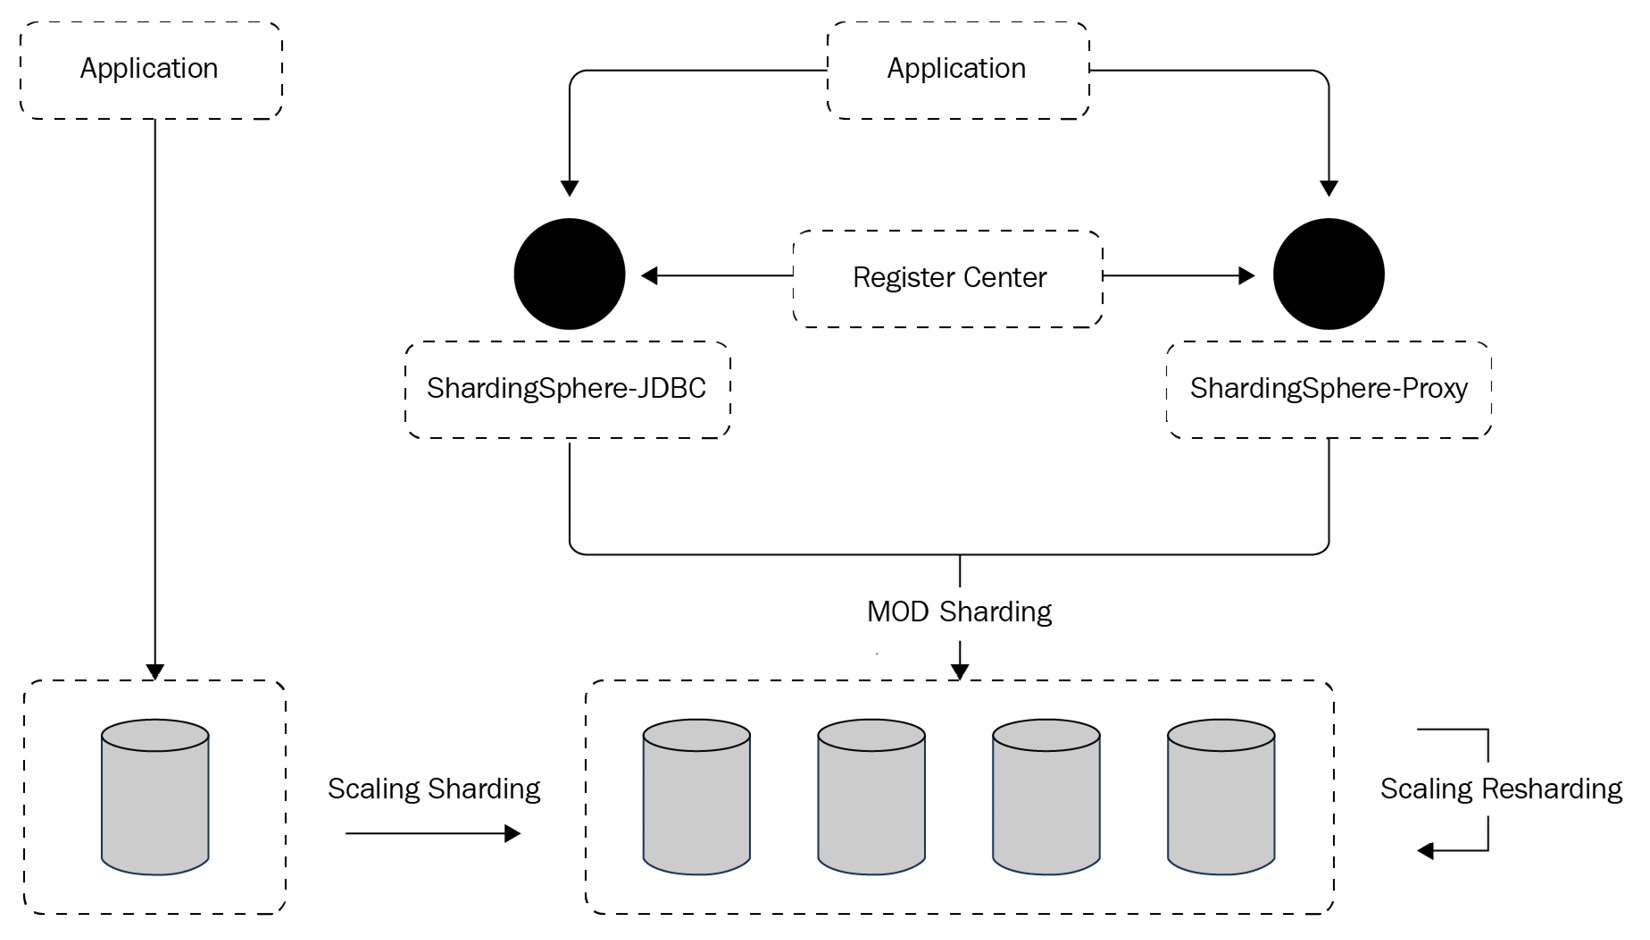
Figure 12.1 – Case 1 deployment architecture
Let's now move on to the example configuration in the next section.
The example configuration
ShardingSphere-Proxy server.yaml should be configured as follows. The operating mode is Cluster, and ZooKeeper is the coordinator service used to notify each proxy instance in the cluster to make metadata changes. The XA transaction manager manages transactions, and Atomikos is the distributed transaction management solution:
YAML
mode:
type: Cluster
repository:
type: ZooKeeper
props:
overwrite: true
The rules are as follows:
rules:
- !AUTHORITY
users:
- root@%:root
- sharding@:sharding
- !TRANSACTION
defaultType: XA
providerType: Atomikos
The config-sharding.yaml configuration file is as follows. The configuration file defines the sharding_db logical library and two database resources, ds_0 and ds_1. The sharding rules define the t_order table, which uses the HASH_MOD automatic sharding algorithm to split the data into four pieces:
YAML
schemaName: sharding_db
dataSources:
ds_0:
#omitted data source config
ds_1:
#omitted data source config
As for the ShardingSphere-JDBC access terminal, the operating mode is configured as Cluster, and a unified configuration center is used to manage sharding rules. The metadata of the configuration center is referenced through schemaName. The specific configuration is as follows:
YAML
schemaName: sharding_db
mode:
type: Cluster
repository:
type: ZooKeeper
props:
namespace: governance_ds
server-lists: localhost:2181
overwrite: false
The preceding code completes your distributed database solution preparation for both the proxy and JDBC. The following sections introduce you to starting and testing the configuration.
The recommended cloud/on-premise server
The recommended configuration for the distributed database solution is fairly straightforward. You can refer to the following technical requirements:
- Server configuration:
- CPU: 8-core
- Memory: 16 GB
- Hard disk: 500 GB
- Applications:
- ShardingSphere-Proxy: 5.0.0
- PostgreSQL: 14.2
- ZooKeeper: 3.6.3
Starting and testing the distributed database solution
Follow the next code snippet examples to test your distributed database solution after setting it up, and before starting to use it:
- Use ShardingSphere-Proxy to create a sharding table rule with "sharding-count"=4:
SQL
psql -U root -d sharding_db -h 127.0.0.1 -p 3307
CREATE SHARDING TABLE RULE t_user (
RESOURCES(ds_0, ds_1),
SHARDING_COLUMN=id,TYPE(NAME=MOD,PROPERTIES("sharding-count"=4))
);
- Create tables and insert data through ShardingSphere-Proxy:
SQL
CREATE TABLE `t_user` (
`id` INT(8) NOT NULL,
`mobile` CHAR(20) NOT NULL,
`idcard` VARCHAR(18) NOT NULL,
PRIMARY KEY (`id`)
);
Once you've successfully created the tables, you can insert data with the following code:
INSERT INTO t_user (`id`, `mobile`, `idcard`) VALUES
(1,18236***857, 220605*******08170),
(2,15686***114, 360222*******88804),
-- omitted some values
(12,13983***809, 430204*******42092);
Now, you are ready to get started in testing to ensure that your configuration is correct. The steps in the next section will guide you through your configuration verification.
Verification testing
Let's get started:
- Log in to the ds_0 instance and query the results:
SQL
psql -U root -d demo_ds_0 -h 127.0.0.1 -p 5432
USE demo_ds_0;
SELECT * FROM t_user_0;
SELECT * FROM t_user_2;
The following screenshot shows an example of the output you will see on your screen after querying the results:
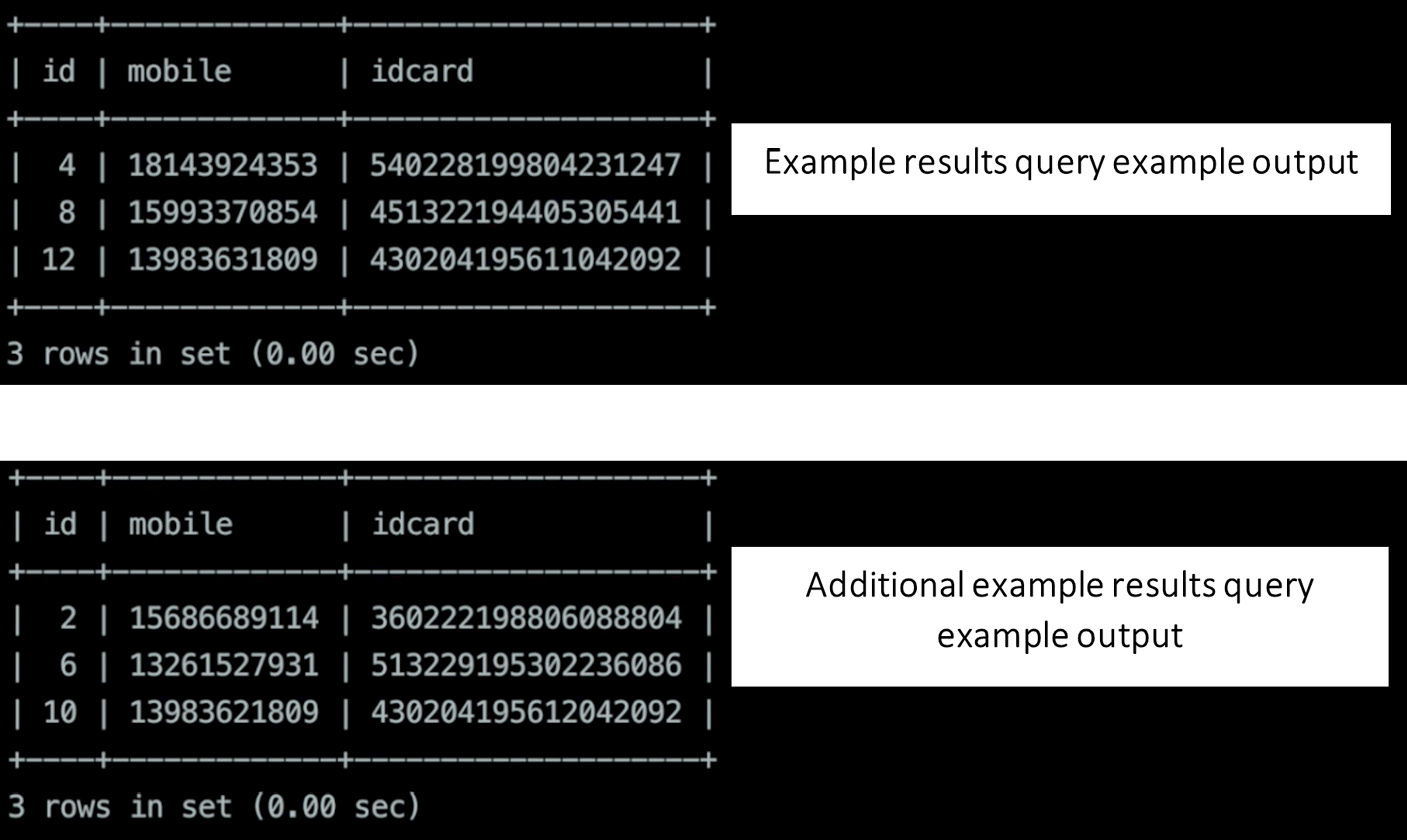
Figure 12.2 – Examples of results query output
- Log in to the ds_1 instance, query the results, and view the output, as shown in Figure 12.3:
SQL
psql -U root -d demo_ds_1 -h 127.0.0.1 -p 5432
USE demo_ds_1;
SELECT * FROM t_user_1;
SELECT * FROM t_user_3;
The outputs are as follows:
Example output for step 2
Figure 12.3 – Examples of output for step 2
By executing the query, we can see that the inserted twelve pieces of data are evenly distributed among four shards.
- Execute RQL statements to validate routing rules and view the outputs, as shown in Figure 12.4:
SQL
SHOW SHARDING TABLE RULES
SHOW SHARDING TABLE NODES
The outputs are as follows:
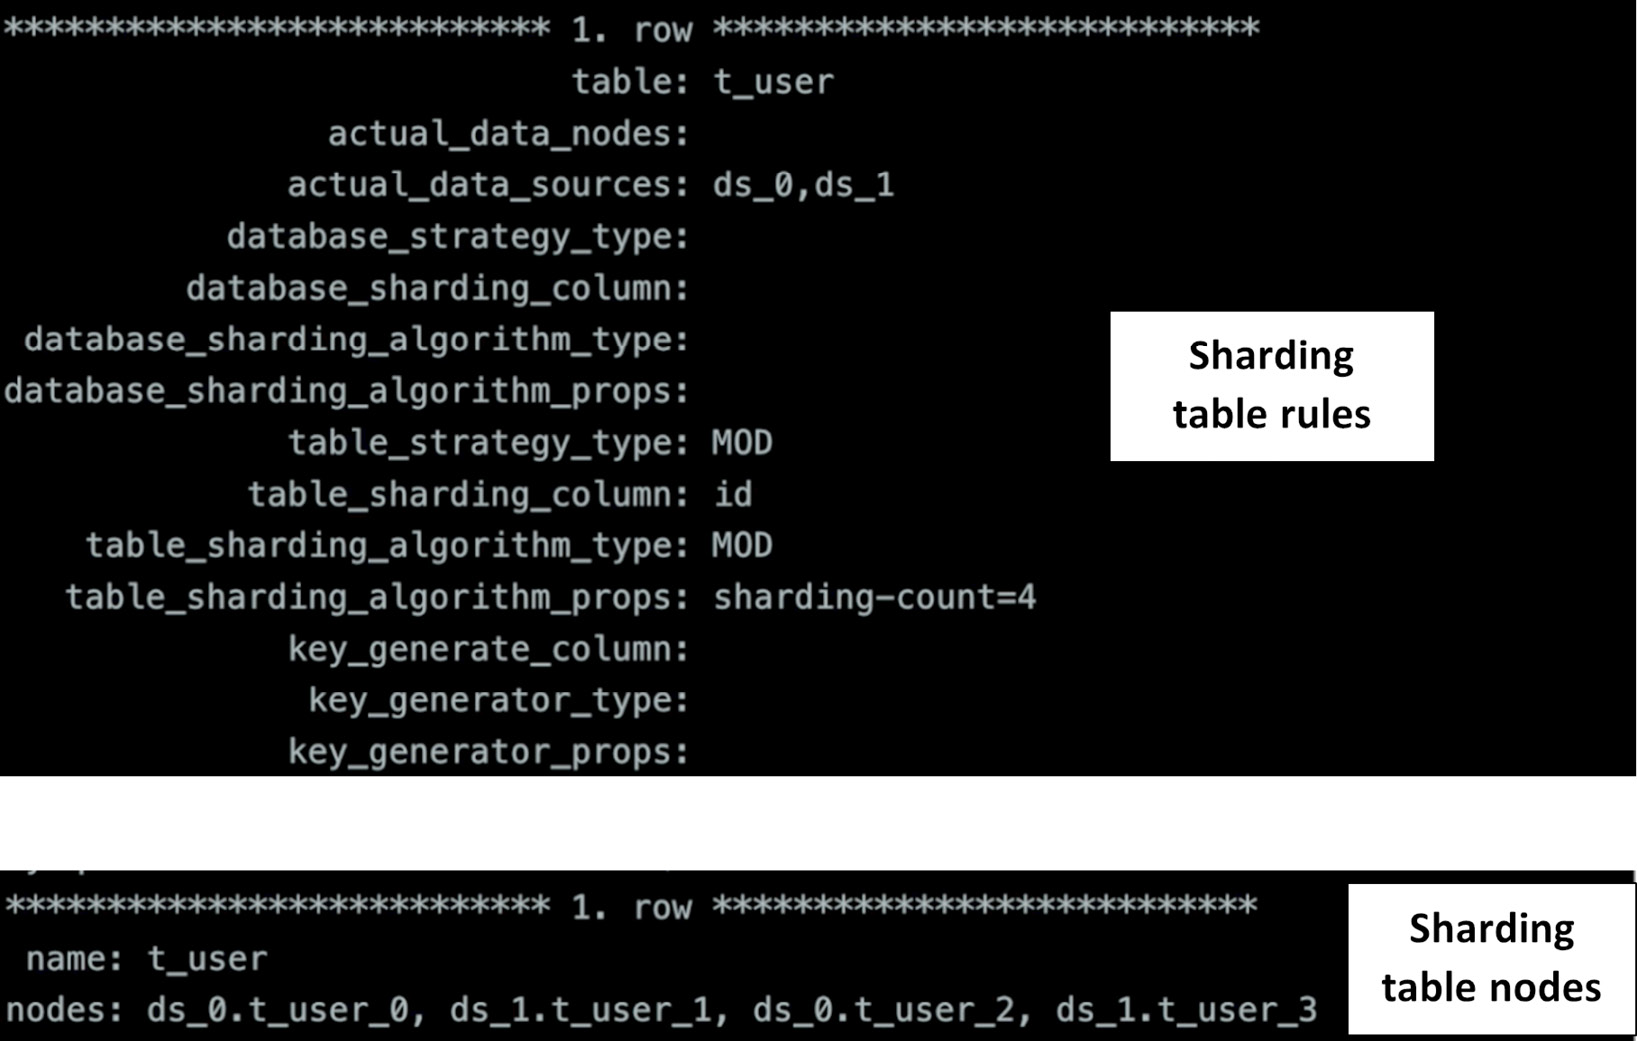
Figure 12.4 – RQL statements example – sharding table rules and nodes
In this section, we have learned how to carry out the verification test for sharding.
Case 2 – ShardingSphere-Proxy + MySQL + read/write splitting + cluster mode + HA + RANGE sharding algorithm + scaling
The second case we have prepared for you is one that you are bound to encounter if you are considering including Apache ShardingSphere in your system.
The deployment architecture
In terms of Apache ShardingSphere's distributed database solution, ShardingSphere-Proxy is deployed in the Cluster mode, which centrally manages sharding rules through a unified configuration center and synchronizes to multiple ShardingSphere-Proxy instances.
The underlying storage engine of the distributed database is the MySQL database and the high-availability (HA) function based on MySQL MGR together with the read/write splitting function can implement dynamic read/write splitting to ensure the HA of the distributed database storage engine. The sharding algorithm is the range-based automatic sharding algorithm, BOUNDARY_RANGE. You do not need to worry about the actual data distribution, and the automatic sharding algorithm and scaling can help manage it.
The deployment architecture of Case 2 is shown in Figure 12.5:
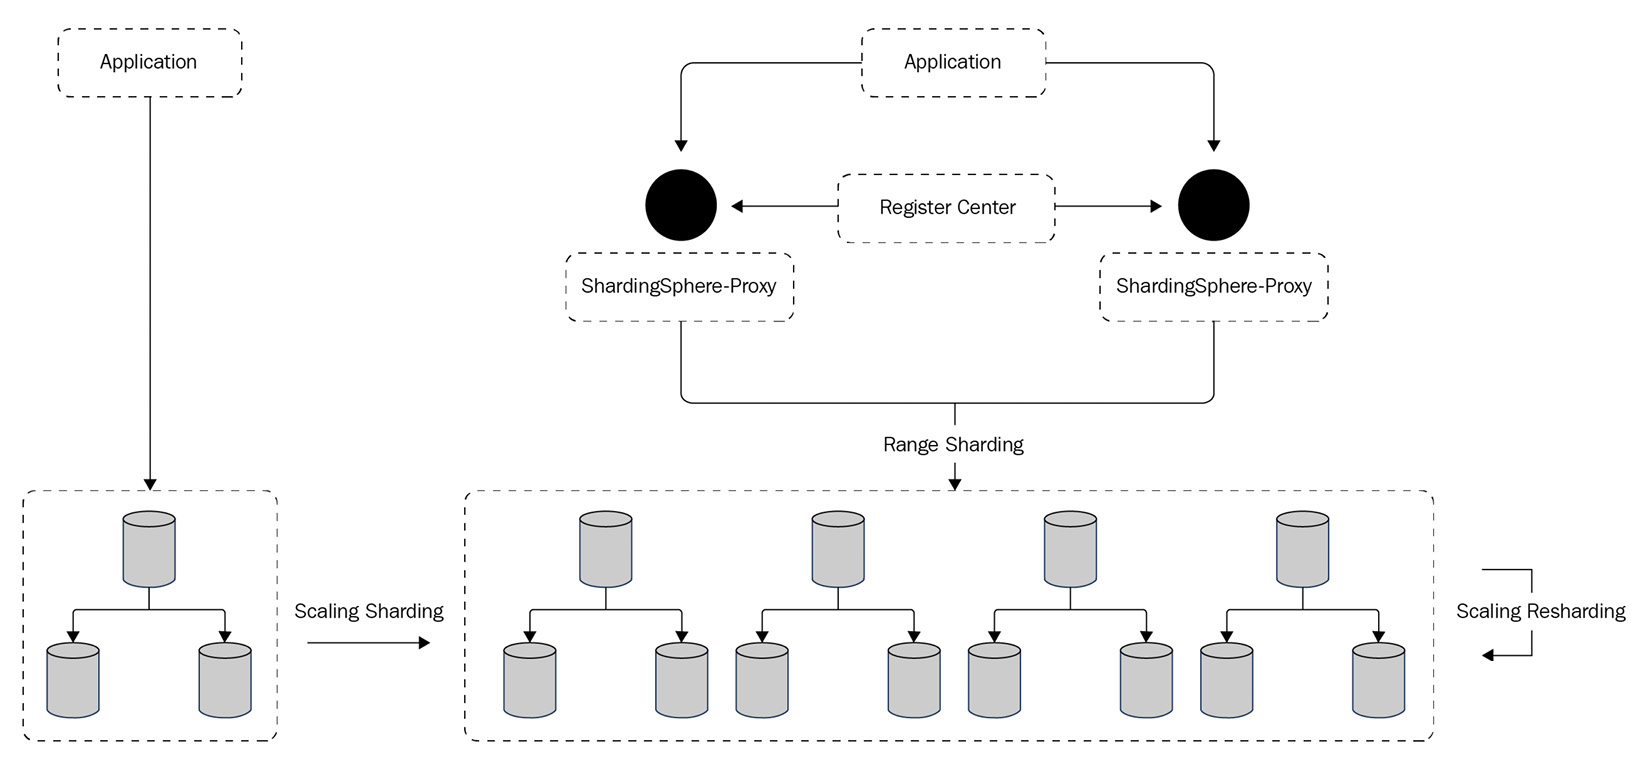
Figure 12.5 – Case 2 deployment architecture
The example configuration
The configuration of ShardingSphere-Proxy server.yaml file is shown as follows. The ShardingSphere operating mode is Cluster mode, and ZooKeeper is the coordinator service used to notify each proxy instance in the cluster to make metadata changes. The transaction manager is the XA transaction manager, while Atomikos provides the distributed transaction management scheme:
YAML
scaling:
blockQueueSize: 10000
workerThread: 40
clusterAutoSwitchAlgorithm:
type: IDLE
props:
incremental-task-idle-minute-threshold: 30
dataConsistencyCheckAlgorithm:
type: DEFAULT
One other part of this configuration file is mode:
mode:
type: Cluster
repository:
type: ZooKeeper
props:
namespace: governance_ds
overwrite: true
Then, we have the rules as follows:
rules:
- !AUTHORITY
users:
- root@%:root
- sharding@:sharding
- !TRANSACTION
defaultType: XA
providerType: Atomikos
The config-sharding-rwsplit-ha.yaml configuration file is as follows. Two sets of MGR clusters are configured in the data source. Auto-discovery of the HA function can automatically identify the primary-secondary relationship. The sharding rule can aggregate two sets of data sources based on the read/write splitting rule and execute the BOUNDARY_RANGE sharding. The sharding algorithm splits the data according to the boundary that you specify. For example, the boundaries 10000000, 20000000, and 30000000 can split the data into four shards.
Now that you understand the components of a ShardingSphere-Proxy server.yaml configuration file, let us understand what a config-sharding-rwsplit-ha.yaml configuration file comprises. Considering the importance that data sharding has within the ShardingSphere ecosystem, as well as its numerous advantages, it is important that you fully master all possible sharding cases.
The config-sharding-rwsplit-ha.yaml configuration file is as follows:
YAML
schemaName: sharding_db
dataSources:
# omitted datasource config
primary_ds_0:
primary_ds_0_replica_0:
primary_ds_0_replica_1:
primary_ds_1:
primary_ds_1_replica_0:
primary_ds_1_replica_1:
Two sets of MGR clusters are configured in the data source. Auto-discovery of the HA function can automatically identify the primary-secondary relationship:
- !DB_DISCOVERY
dataSources:
pr_ds_0:
dataSourceNames:
- primary_ds_0
- primary_ds_0_replica_0
- primary_ds_0_replica_1
discoveryHeartbeatName: mgr-heartbeat
discoveryTypeName: mgr
Then, we have pr_ds_1:
pr_ds_1:
dataSourceNames:
- primary_ds_1
- primary_ds_1_replica_0
- primary_ds_1_replica_1
discoveryHeartbeatName: mgr-heartbeat
discoveryTypeName: mgr
For discovery heartbeats:
discoveryHeartbeats:
mgr-heartbeat:
props:
keep-alive-cron: '0/5 * * * * ?'
For discovery type:
discoveryTypes:
mgr:
type: MGR
props:
group-name: 92504d5b-6dec-11e8-91ea-246e9612aaf1
The sharding rule can aggregate two sets of data sources based on the read/write splitting rule and execute the BOUNDARY_RANGE sharding:
!READWRITE_SPLITTING
dataSources:
rw_ds_0:
autoAwareDataSourceName: pr_ds_0
rw_ds_1:
autoAwareDataSourceName: pr_ds_1
Sharding t_order:
- !SHARDING
tables:
t_order:
actualDataNodes: rw_ds_${0..1}.t_order_${0..3}tableStrategy:
standard:
shardingColumn: order_id
shardingAlgorithmName: t_order_range
Sharding t_order_item:
t_order_item:
actualDataNodes: rw_ds_${0..1}.t_order_item_${0..3}tableStrategy:
standard:
shardingColumn: order_id
shardingAlgorithmName: t_order_item_range
Sharding the algorithms database:
shardingAlgorithms:
database_inline:
type: INLINE
props:
algorithm-expression: rw_ds_${user_id % 2}Sharding the algorithms table:
t_order_range:
type: BOUNDARY_RANGE
props:
sharding-ranges: 10000000,20000000,30000000
t_order_item_range:
type: BOUNDARY_RANGE
props:
sharding-ranges: 10000000,20000000,30000000
After completing the preceding configuration and starting ShardingSphere-Proxy, you can trigger the scaling job through the following steps:
- Add a new database instance and add a new data source in ShardingSphere.
- Modify the table sharding rules.
After triggering the scaling job, you can manage the elastic scaling process through DistSQL. If you're using an automated process, just check the job's progress and wait until it's complete.
For the detailed process, please refer to the official documentation of ShardingSphere.
The recommended cloud/on-premises server
The recommended configuration for this case is simple. You can refer to the following technical requirements:
- Server configuration:
- CPU – 8 Cores
- Memory – 16 GB
- Disk – 500 GB
- Application information:
- ShardingSphere-Proxy 5.0.0
- MySQL 8.0
- JDBC-Demo
- Zookeeper 3.6.3
Starting and testing your case configuration
Follow the next code snippets as an example to test the configuration for the second case we have prepared for you:
- When ShardingSphere-Proxy is started, log in to ShardingSphere-Proxy to create a table and insert the following data:
SQL
mysql -uroot -h127.0.0.1 -P3307 -proot
use sharding_db;
DROP TABLE IF EXISTS t_user;
CREATE TABLE `t_user` (
`id` int(8) not null,
`mobile` char(20) NOT NULL,
`idcard` varchar(18) NOT NULL,
PRIMARY KEY (`id`)
);
INSERT INTO t_user (id, mobile, idcard) VALUES
(1,18236***857, 220605******308170),
(2,15686***114, 360222******088804),
(3,14523***225, 411601******098107),
(4,18143***353, 540228******231247),
(5,15523***333, 360924******103360),
(6,13261***931, 513229******236086),
(7,13921***133, 500108******107214),
(8,15993***854, 451322******305441),
(9,18044***924, 411329******285772),
(10,1398***1809, 430203******042092);
- Start the JDBC program to deliver query results in real time, as shown in the following screenshot:
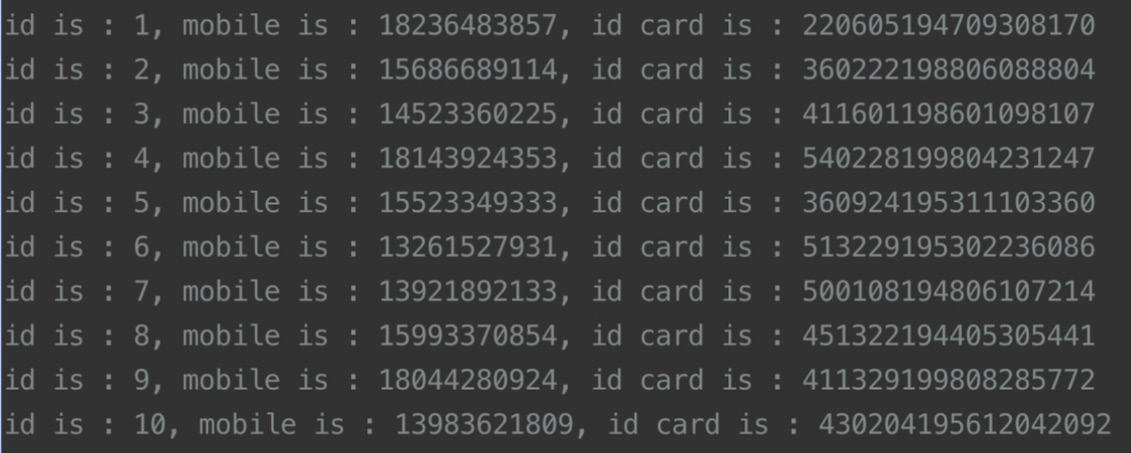
Figure 12.6 – JDBC query results example
- View the current relationship between the active and standby nodes through DistSQL:
SQL
SHOW DB_DISCOVERY RULESG
-- View the standby node state
SHOW READWRITE_SPLITTING READ RESOURCES;
Figure 12.7 shows you an example output result when querying the system for the current database discovery rules and read/write splitting read resources:
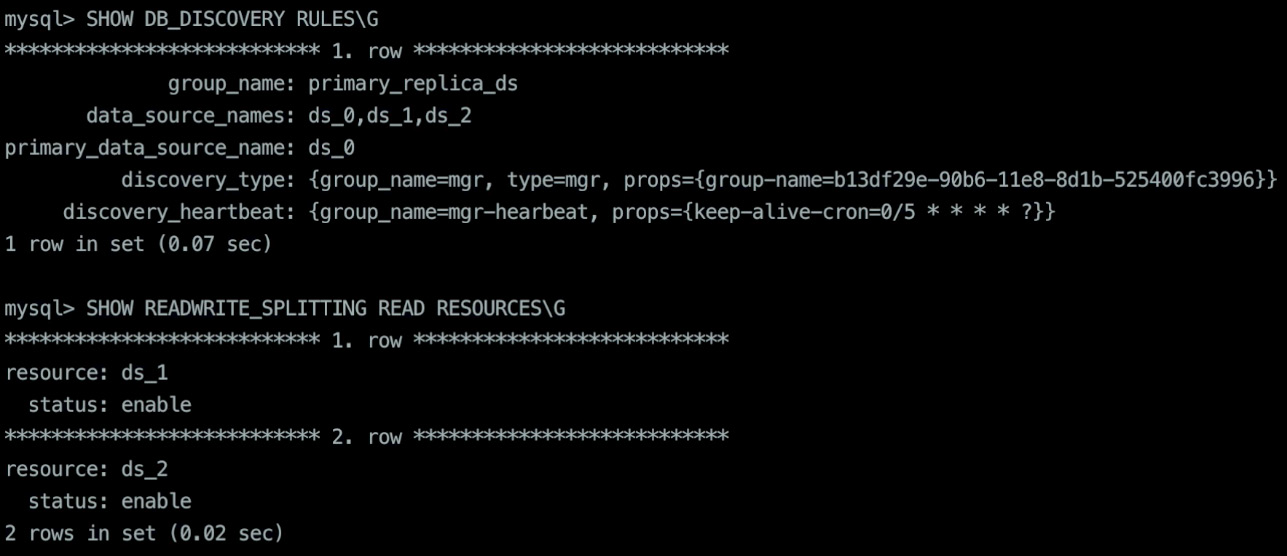
Figure 12.7 – Database discovery and read/write splitting read resources
Shut down the secondary nodes of one set of MGR:
SQL
mysql -uroot -hprimary_ds_0_replica_0.db -P3306 -p
SHUTDOWN;
- When viewing the node status through proxy, the status of the secondary node that is shut down is disabled:
SQL
SHOW READWRITE_SPLITTING READ RESOURCES;
Once you query your system to show the read resources, you will receive a result as shown in the following figure:
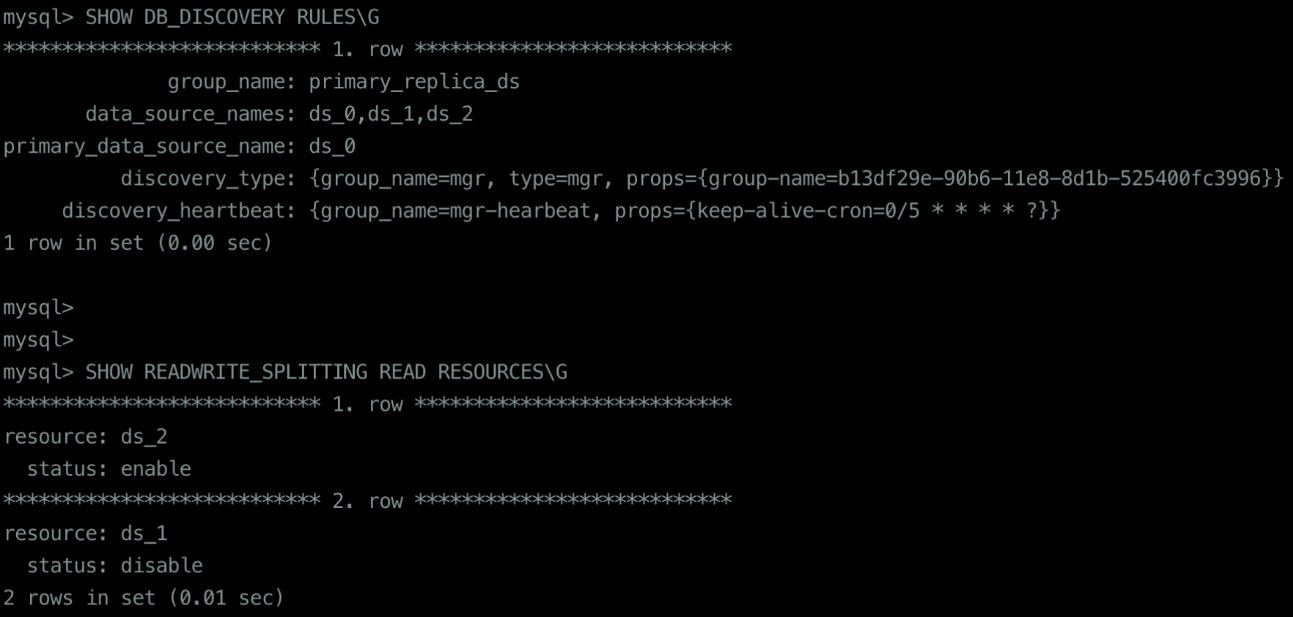
Figure 12.8 – Read/write splitting example output
- JDBC still queries and delivers the results in real time, as you can see from the screenshot in the following figure:
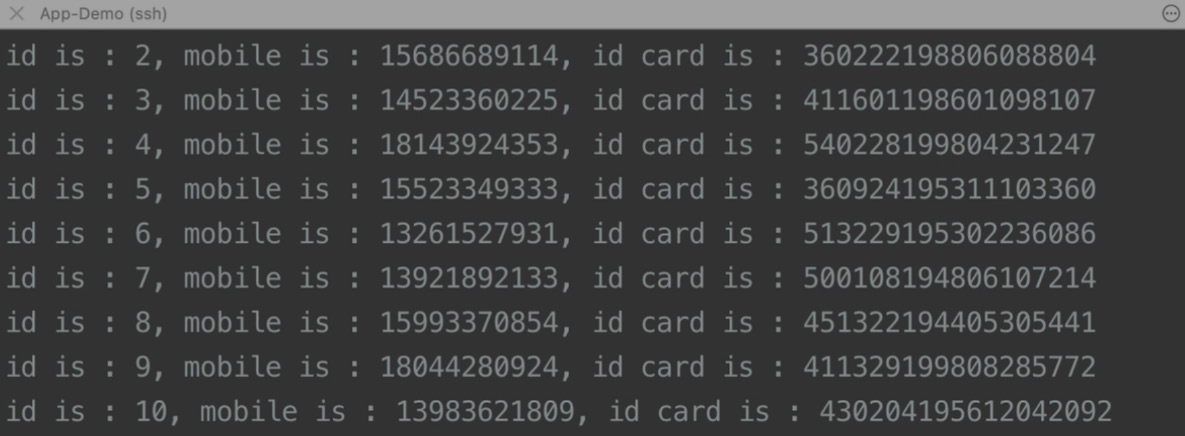
Figure 12.9 – JDBC real-time query results
- To shut down the primary node of MGR, we will first insert some data through proxy:
SQL
INSERT INTO t_user (id, mobile, idcard) VALUES
(11,1392***2134, 500108*******07211),
(12,1599***0855, 451322*******05442),
(13,1804***0926, 411329*******85773),
(14,1398***1807, 430204*******42094),
(15,1804***0928, 411329*******85775),
(16,1398***1800, 130204*******42096),
(17,1398***1800, 230204*******42093),
(18,1398***1800, 330204*******42091),
(19,1398***1800, 230204*******42095),
(20,1398***1811, 230204*******42092);
Then, shut down the primary node:
SQL
mysql -uroot -hprimary_ds_0.db -P3306 -p
SHUTDOWN;
We can tell from the JDBC program that when the primary node SHUTDOWN is queried later and affected by the SQL insertion of the previous code block, the newly inserted data is also queried. As you can see from the screenshot in the following figure, the SQL insertion that the data has successfully been inserted into is t_user:
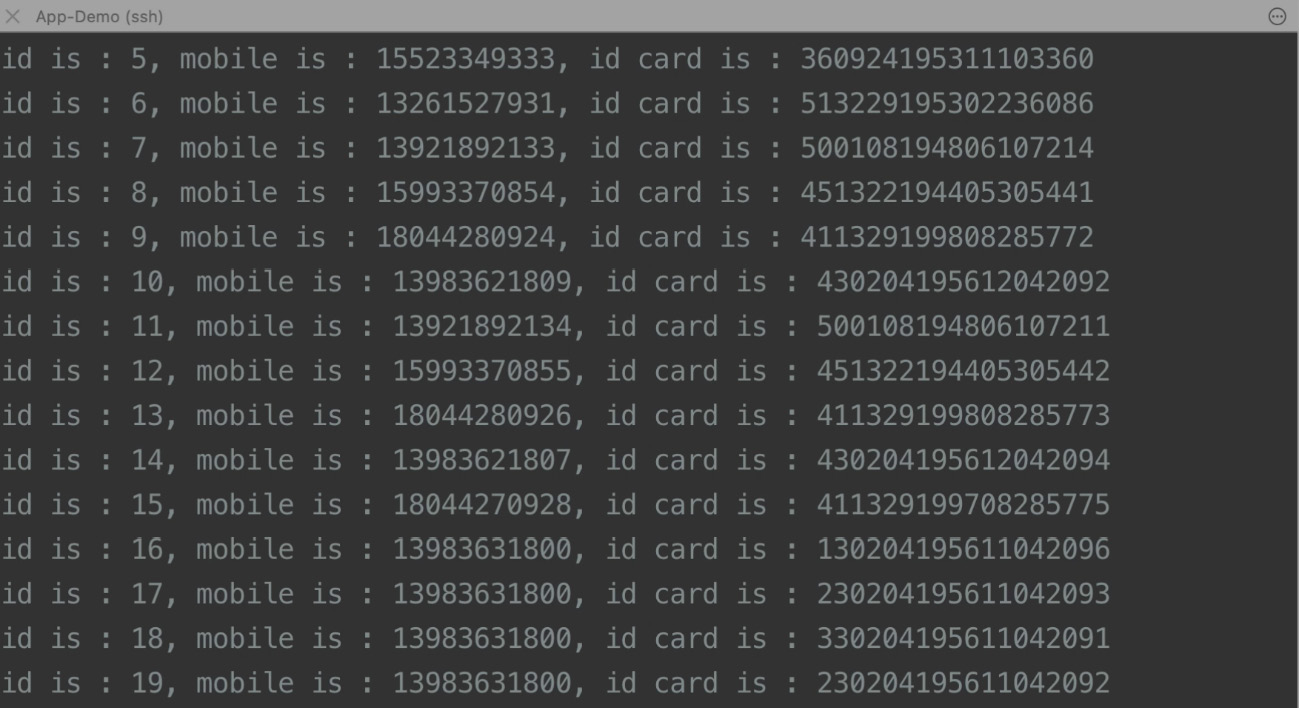
Figure 12.10 – SQL insertion screenshot
This is a test of applicable HA scenarios.
Database security
After covering some distributed database real-world examples that will come in handy, let's now move on to some database security examples.
Case 3 – ShardingSphere-Proxy + ShardingSphere-JDBC + PostgreSQL + data encryption
In this section, the first case will get you started with data encryption, while the following case will cover checking privileges.
The deployment architecture
This case demonstrates how to use ShardingSphere-Proxy to dynamically manage rule configuration, connecting PostgreSQL to ShardingSphere-JDBC and implementing a data encryption application.
To understand what the deployment would look like, you can refer to Figure 12.11:
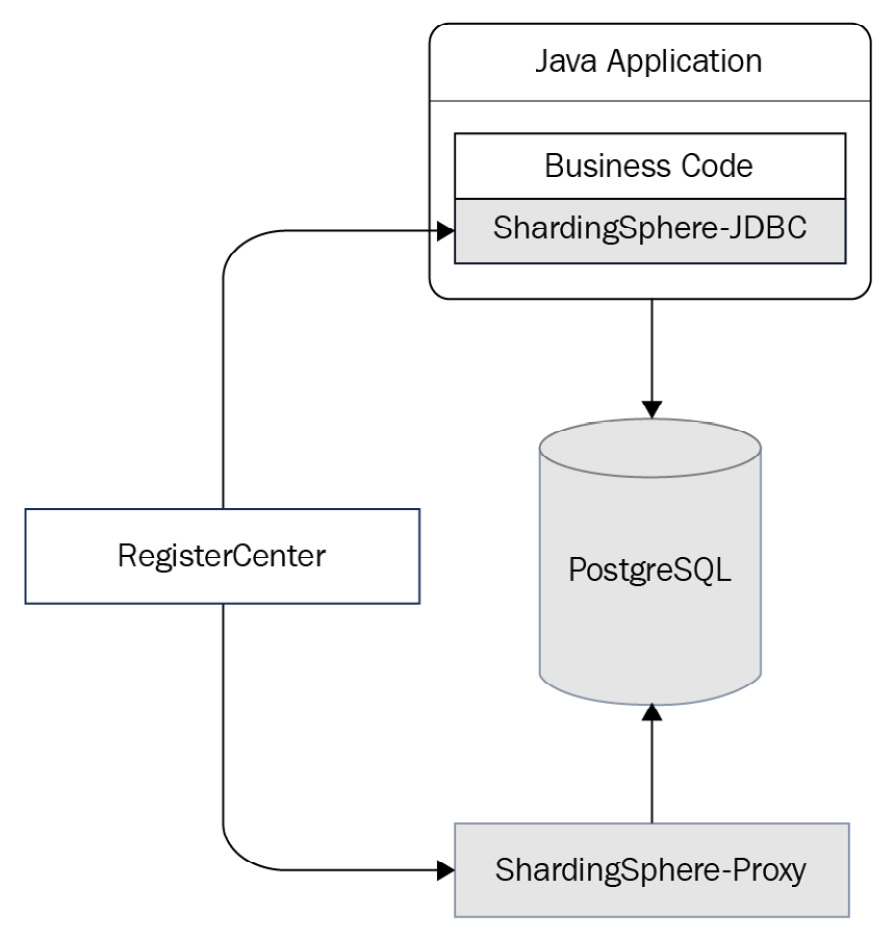
Figure 12.11 – Case 3 deployment architecture
The example configuration
For this case, you can use either ShardingSphere-Proxy or JDBC, and therefore, in the following sections, you will find an example configuration for both clients.
ShardingSphere-Proxy
The operation mode of ShardingSphere-Proxy is configured as Cluster, and the content of server.yaml is as follows:
YAML
mode:
type: Cluster
repository:
type: ZooKeeper
props:
namespace: governance_ds
server-lists: localhost:2181
overwrite: true
rules:
- !AUTHORITY
users:
- root@%:root
Use config-encrypt.yaml to create a logic database and add the storage resource as in the following script:
YAML
schemaName: encrypt_db
dataSources:
ds_0:
url: jdbc:postgresql://127.0.0.1:5432/demo_ds_0
username: postgres
password: postgres
When ShardingSphere-Proxy is started, connect to encrypt_db using the psql command and create the required encryption rules through DistSQL:
SQL
CREATE ENCRYPT RULE t_encrypt (
COLUMNS(
(NAME=password,CIPHER=password_cipher,TYPE(NAME=AES,PROPERTIES('aes-key-value'='123456abc')))));
As such, the configuration of proxy is done.
ShardingSphere-JDBC
Since unified configuration through ShardingSphere-Proxy is done, we only need to configure the information of the governance center when connecting to ShardingSphere-JDBC applications. Here is an example:
YAML
schemaName: encrypt_db
mode:
type: Cluster
repository:
type: ZooKeeper
props:
namespace: governance_ds
server-lists: localhost:2181
overwrite: false
Great, the configuration is done! After JDBC is started, we can also dynamically add or modify encryption rules by executing DistSQL through proxy, avoiding the need to restart the application when modifying its configuration, and providing a flexible management solution.
The recommended cloud/on-premises server
The following list presents you with an example server configuration and application information:
- Server configuration:
- CPU: 8-core
- Memory: 16 GB
- Disk: 500 GB
- Application information:
- ShardingSphere: 5.0.0
- PostgreSQL: 14.2
- ZooKeeper: 3.6.3
Starting and testing your database security solution
Testing your secure database solution will involve a four-step procedure. You can find it with the following code:
- Start ShardingSphere-Proxy and execute the prepared DistSQL.
- View the resource and encryption rules on the proxy side:
SQL
SHOW SCHEMA RESOURCES FROM encrypt_db;
SHOW ENCRYPT RULES FROM encrypt_db;
- Execute data definition language (DDL) on the proxy side to create a data table:
SQL
DROP TABLE IF EXISTS t_encrypt;
CREATE TABLE t_encrypt (
id int NOT NULL,
name varchar DEFAULT NULL,
password varchar DEFAULT NULL,
PRIMARY KEY (id)
);
- Start and connect to ShardingSphere-JDBC to read and write data and observe the results of data encryption and decryption.
Successfully completing the fourth step will conclude your testing for your secure database solution. The next section will guide you through more security-related testing.
Case 4 – ShardingSphere-Proxy + MySQL + data masking + authentication + checking privileges
We follow the same pattern here by first introducing you to the deployment architecture, then an example configuration, and finally the testing procedure.
The deployment architecture
This case shows you how to create two different data encryption schemas and how to entitle their access to different users. As you can see in Figure 12.12, we use ShardingSphere-Proxy and MySQL for data masking, authentication, and checking privileges:
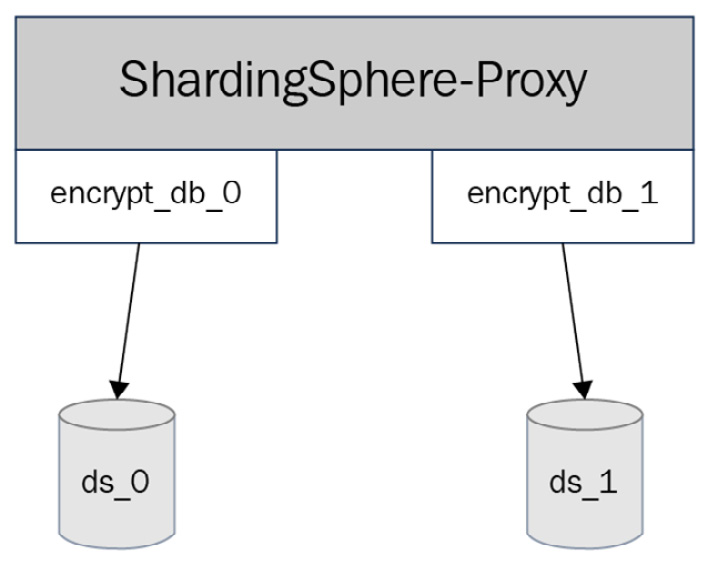
Figure 12.12 – Case 4 deployment architecture
The example configuration
In this example, we use YAML to configure resource and data encryption rules. The configuration is as follows:
- For data source 0 (ds_0), let's look at the config-encrypt-0.yaml file and its components:
YAML
schemaName: encrypt_db_0
dataSources:
ds_0:
url: jdbc:mysql://127.0.0.1:3306/demo_ds_0?useSSL=false
username: root
password: 123456
rules:
- !ENCRYPT
tables:
t_encrypt_0:
columns:
password:
cipherColumn: password_cipher
encryptorName: password_encryptor
encryptors:
password_encryptor:
type: AES
props:
aes-key-value: 123456abc
The file will have encryptors as shown in the following snippet:
encryptors:
password_encryptor:
type: AES
props:
aes-key-value: 123456abc
- For data source 1 (ds_1), let's look at the config-encrypt-1.yaml file and its components as well:
YAML
schemaName: encrypt_db_1
dataSources:
ds_1:
url: jdbc:mysql://127.0.0.1:3306/demo_ds_1?useSSL=false
username: root
password: 123456
rules:
- !ENCRYPT
tables:
t_encrypt_1:
columns:
password:
cipherColumn: password_cipher
encryptorName: password_encryptor
encryptors:
password_encryptor:
type: AES
props:
aes-key-value: 123456abc
It will have rules, as shown in the following code:
rules:
- !ENCRYPT
tables:
t_encrypt_1:
columns:
password:
cipherColumn: password_cipher
encryptorName: password_encryptor
encryptors:
password_encryptor:
type: AES
props:
aes-key-value: 123456abc
And it will have encryptors as well:
encryptors:
password_encryptor:
type: AES
props:
aes-key-value: 123456abc
Three users are defined in this configuration, among which, for our example, user0 and user1 are banned from logging in as hosts and are given different schema accesses:
YAML
rules:
- !AUTHORITY
users:
- root@%:root
- [email protected]:password0
- [email protected]:password1
props:
user-schema-mappings: root@%=encrypt_db_0,root@%=encrypt_db_1,[email protected]=encrypt_db_0,[email protected]=encrypt_db_1
According to the rule, user0 can only access logic database encrypt_db_0 when connecting from 127.0.0.1. Similarly, user1 can only access encrypt_db_1 when connecting from 127.0.0.1. Otherwise, they cannot see any database. On the contrary, the root user is not limited by the host and has access to both encrypt_db_0 and encrypt_db_1.
The recommended cloud/on-premises server
You can refer to the following list for an example of server configuration and application information:
- Server configuration:
- CPU: 8-core
- Memory: 16 GB
- Disk: 500 GB
- Application information:
- ShardingSphere: 5.0.0
- MySQL: 8.0
Start and test it!
Thanks to ShardingSphere-Proxy, you will find that the procedure for testing your authentication and encryption is very simple. You can follow the next steps as an example and you will find that you can repurpose them in your environment:
- Start ShardingSphere-Proxy.
- Connect proxy by root user and view the resource and encryption rules:
SQL
SHOW SCHEMA RESOURCES FROM encrypt_db_0;
SHOW ENCRYPT RULES FROM encrypt_db_0;
SHOW SCHEMA RESOURCES FROM encrypt_db_1;
SHOW ENCRYPT RULES FROM encrypt_db_1;
- Use the root user to execute DDL, and create the t_encrypt_0 data table in encrypt_db_0:
SQL
USE encrypt_db_0;
DROP TABLE IF EXISTS t_encrypt_0;
CREATE TABLE t_encrypt_0 (
`id` int(11) NOT NULL,
`name` varchar(32) DEFAULT NULL,
`password` varchar(64) DEFAULT NULL,
PRIMARY KEY (`id`)
) ENGINE=InnoDB DEFAULT CHARSET=utf8mb4;
In the same way, create the t_encrypt_1 data table in encrypt_db_1:
SQL
USE encrypt_db_1;
DROP TABLE IF EXISTS t_encrypt_1;
CREATE TABLE t_encrypt_1 (
`id` int(11) NOT NULL,
`name` varchar(32) DEFAULT NULL,
`password` varchar(64) DEFAULT NULL,
PRIMARY KEY (`id`)
) ENGINE=InnoDB DEFAULT CHARSET=utf8mb4;
- Use user0 to log into proxy to try different logic databases and see whether the result is up to expectations:
SQL
USE encrypt_db_0; # succeed
USE encrypt_db_1; # fail
Use user1 to log into proxy and perform the same test:
SQL
USE encrypt_db_0; # fail
USE encrypt_db_1; # succeed
- The test is done. Now, user0 and user1 can use their respective logic database to read and write.
This concludes our cases on database security testing. We will now move on to testing your synthetic monitoring.
Synthetic monitoring
Having covered both distributed database and database security cases, we thought you might need a good example on how to implement synthetic monitoring. This would help you have a clear overview of how your system is running. We provide you with one case here, as it is easily generalizable to cover all possible scenarios.
Case 5 – Synthetic monitoring
If you are interested in the synthetic monitoring feature we introduced in Chapter 4, Key Features and Use Cases – Focusing on Performance and Security, you can refer to the following sections for a complete guide to be able to test your own solution.
The deployment architecture
For our synthetic monitoring case, let's consider a scenario where you can deploy ShardingSphere-JDBC or ShardingSphere-Proxy alternatively. The underlying storage is PostgreSQL, with a database gateway, a default test strategy, and tracing visualization features. Figure 12.13 presents you with the example deployment architecture:
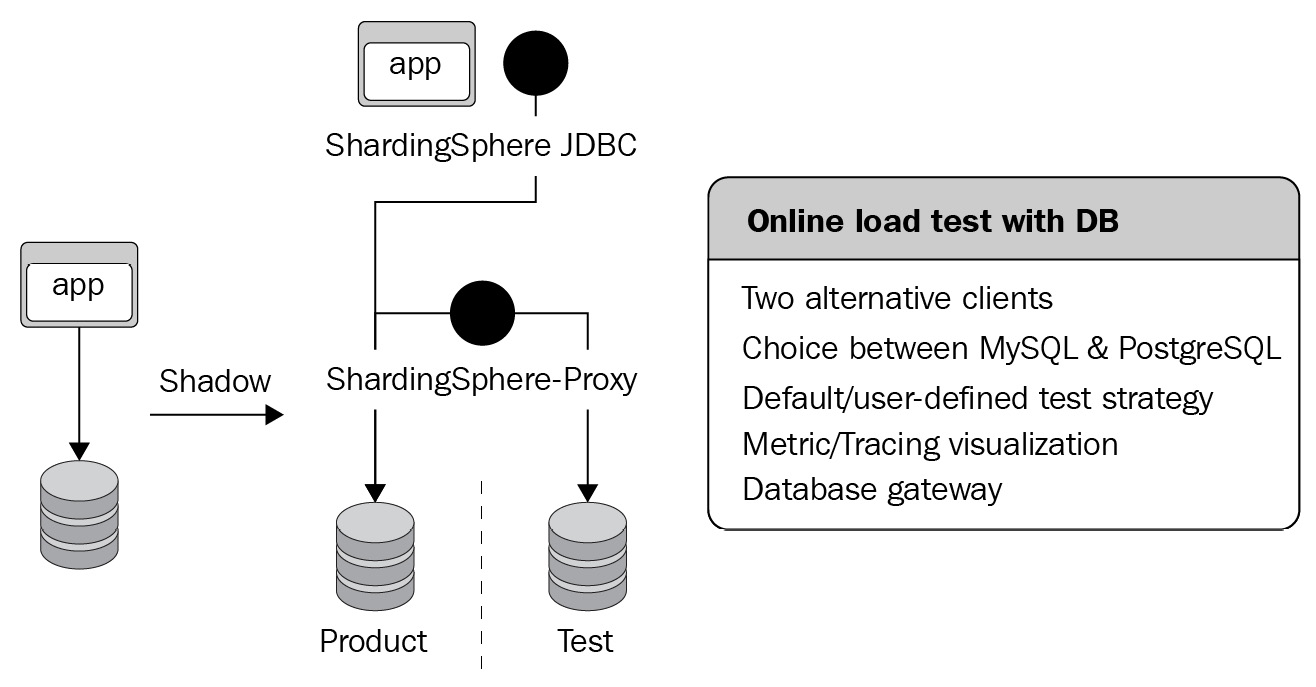
Figure 12.13 – Case 5 deployment architecture
Now that you have visualized the deployment architecture thanks to the previous figure, let's jump into the configuration steps.
The example configuration
As an out-of-the-box, full-link, and online stress testing solution, CyborgFlow can be quickly integrated into your projects. Currently, version 0.1.0 has been released.
Here is an example of a cyborg-database-shadow configuration showing its components:
- The following code shows the server.yaml configuration:
YAML
rules:
- !AUTHORITY
users:
- root@%:root
- sharding@:sharding
props:
sql-comment-parse-enabled: true
- Here is the config-shadow.yaml configuration:
YAML
schemaName: cyborg-database-shadow
dataSources:
ds:
url: jdbc:mysql://127.0.0.1:3306/ds?serverTimezone=UTC&useSSL=false
username: root
password:
connectionTimeoutMilliseconds: 30000
idleTimeoutMilliseconds: 60000
maxLifetimeMilliseconds: 1800000
maxPoolSize: 50
minPoolSize: 1
ds_shadow:
url: jdbc:mysql://127.0.0.1:3306/ds_shadow?serverTimezone=UTC&useSSL=false
username: root
password:
connectionTimeoutMilliseconds: 30000
idleTimeoutMilliseconds: 60000
maxLifetimeMilliseconds: 1800000
maxPoolSize: 50
minPoolSize: 1
We also have the following rules:
rules:
- !SHADOW
enable: true
dataSources:
shadowDataSource:
sourceDataSourceName: ds
shadowDataSourceName: ds_shadow
defaultShadowAlgorithmName: simple-note-algorithm
shadowAlgorithms:
simple-note-algorithm:
type: SIMPLE_NOTE
props:
cyborg-flow: true
Another example of the cyborg-flow-gateway configuration is as follows:
- To start, you should note that we use config.yaml here:
YAML
apisix:
config_center: yaml
enable_admin: false
plugins:
- proxy-rewrite
- skywalking
plugin_attr:
skywalking:
service_name: APISIX
service_instance_name: "cyborg-dashboard"
endpoint_addr: http://127.0.0.1:12800
- Let's see the configuration for apisix.yaml:
YAML
routes:
-
uri: /order
plugins:
proxy-rewrite:
headers:
sw8-correlation: Y3lib3JnLWZsb3c=:dHJ1ZQ==
skywalking:
sample_ratio: 1
upstream:
nodes:
"httpbin.org:80": 1
type: roundrobin
In this example, proxy-rewrite add-on was used to inject sw8-correlation: Y3lib3JnLWZsb3c=:dHJ1ZQ== into the requested headers. Y3lib3JnLWZsb3c= is the Base64 encoding of cyborg-flow, and dHJ1ZQ== is the Base64 encoding of true.
The recommended cloud/on-premises server
In the following list, we provide you with a recommended configuration for cases, whether you are interested in cyborg-database-shadow or cyborg-dashboard:
- cyborg-database-shadow:
- CPU – 48-core
- Memory – 96 GB
- Disk – SSD 820 GB
- cyborg-database-shadow – 0.1.0
- MySQL – 8.0
- JDBC-Demo – N/A
- ZooKeeper – 3.6.3
- cyborg-dashboard:
- CPU – 8-core
- Memory – 16 GB
- Disk – SSD 40 GB
- cyborg-dashboard – 0.1.0
- cyborg-flow-gateway
- CPU – 8-core
- Memory – 16 GB
- Disk – SSD 40 GB
- cyborg-flow-gateway – 0.1.0
Starting and testing it
To start, quickly deploy CyborgFlow in a CentOS 7 environment as introduced in Chapter 4, Key Features and Use Cases – Focusing on Performance and Security, and activate the default stress testing marker in /*cyborg-flow: true*/.
Download related components from https://github.com/SphereEx/cyborg-flow/releases/tag/v0.1.0.
Let's first start by preparing the shadow database. To do so, you can refer to the following steps:
- Prepare the shadow database:
- Unzip cyborg-database-shadow.tar.gz.
- Configure the business database and shadow database in the conf/config-shadow.yaml file as the configuration of your business.
- Start the cyborg-database-shadow service. The start script is in bin/start.sh.
- Now that you have prepared the shadow database, let's now deploy cyborg-dashboard.
Unzip cyborg-dashboard.tar.gz. Start the cyborg-dashboard backend and UI interface service for link data monitoring. The start script is in bin/startup.sh.
- Once the dashboard is successfully set up, you can now deploy the stress testing application by cyborg-agent with the following three steps:
- Unzip cyborg-agent.tar.gz.
- Modify collector.backend_service in config/agent.config as the backend address (default access: 11800) in cyborg-dashboard for reporting monitoring data to cyborg-dashboard.
- When starting the program, add the -jar {path}/to/cyborg-agent/skywalking-agent.jar parameter to the start demand.
Deploying cyborg-flow-gateway
After completion, you can finally deploy cyborg-flow-gateway, as follows:
- Install OpenResty and Apache APISIX's RPM package:
Bash
sudo yum install -y https://repos.apiseven.com/packages/centos/apache-apisix-repo-1.0-1.noarch.rpm
- Install Apache APISIX and all dependencies through the RPM package:
Bash
sudo yum install -y https://repos.apiseven.com/packages/centos/7/x86_64/apisix-2.10.1-0.el7.x86_64.rpm
- Modify the conf/config.yaml configuration as in the example we provided earlier, which you can find here:
YAML
apisix:
config_center: yaml
enable_admin: false
plugins:
- proxy-rewrite
- skywalking
plugin_attr:
skywalking:
service_name: APISIX
service_instance_name: "cyborg-dashboard"
endpoint_addr: http://127.0.0.1:12800
- Modify the conf/apisix.yaml configuration as in the example we provided earlier in this chapter, which you can find here:
YAML
routes:
-
uri: /order
plugins:
proxy-rewrite:
headers:
sw8-correlation: Y3lib3JnLWZsb3c=:dHJ1ZQ==
skywalking:
sample_ratio: 1
upstream:
nodes:
"httpbin.org:80": 1
type: roundrobin
Let's assume that an e-commerce website needs to perform online stress testing for its order placement business. Let's also assume that the table related to stress testing is the t_order order table and the test user ID is 0. The data generated by the test user is executed to the ds_shadow shadow database while the production data is executed to the production database, ds.
Let's look at the order table:
SQL
CREATE TABLE `t_order` (
`id` INT(11) AUTO_INCREMENT,
`user_id` VARCHAR(32) NOT NULL,
`sku` VARCHAR(32) NOT NULL,
PRIMARY KEY (`id`)
)ENGINE = InnoDB;
You can use Postman to simulate a request.
- Directly request the order service to simulate production data:
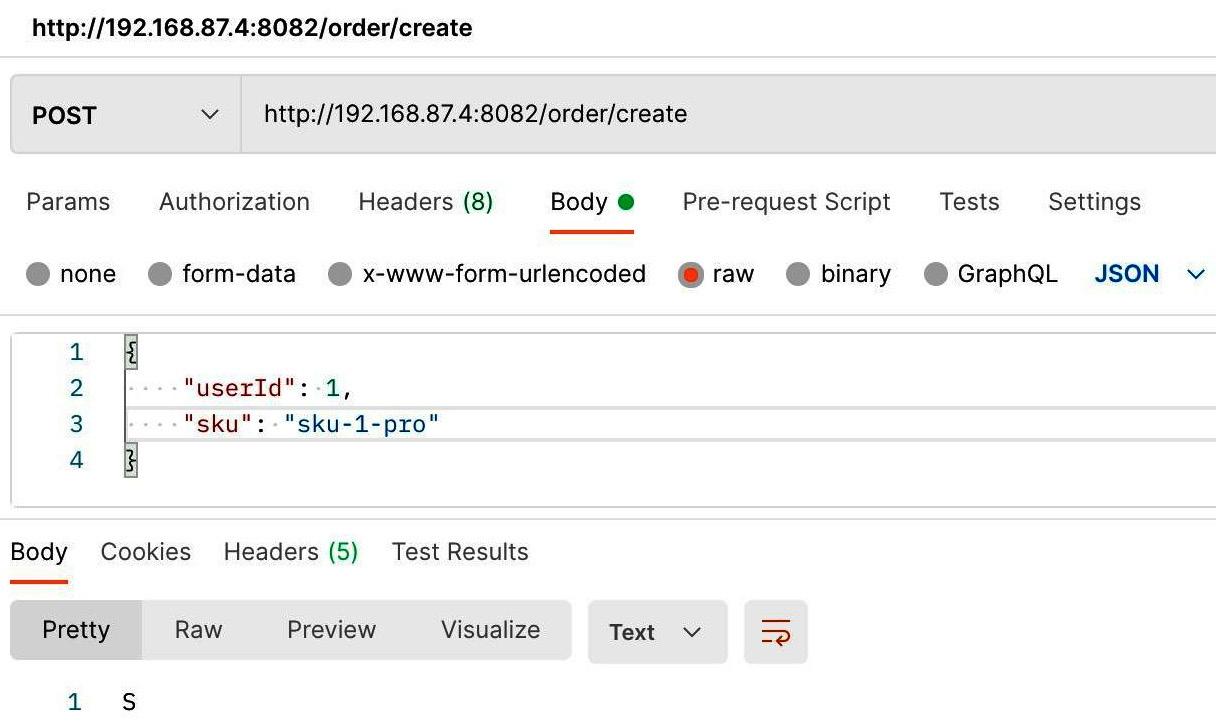
Figure 12.14 – Simulation request using Postman
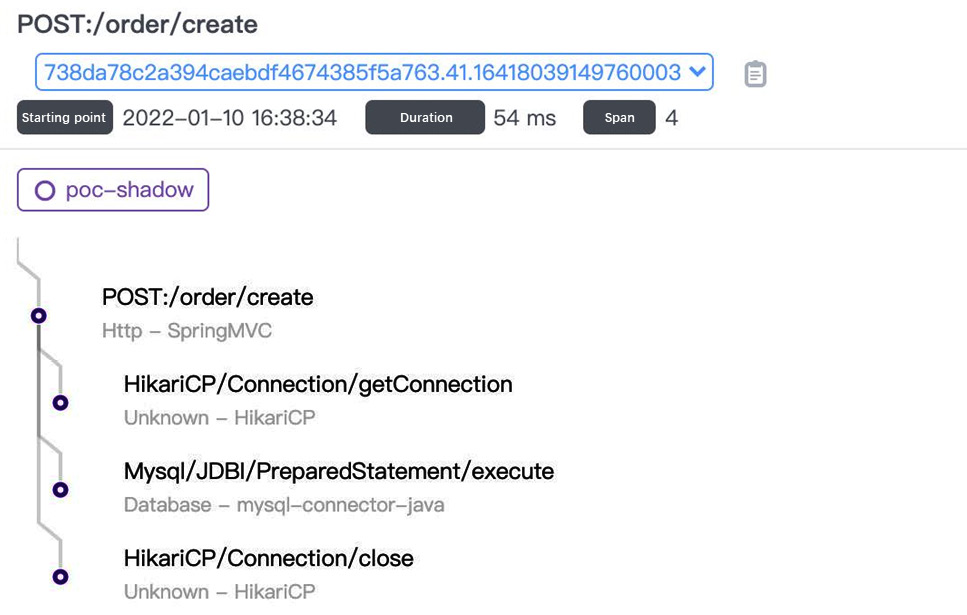
Figure 12.15 – CyborgFlow dashboard link
- View the data in the production database with the following code:
Bash
mysql> select * from t_order;
+----+-----------+---------------+
| id | user_id | sku |
+----+-----------+---------------+
| 1 | 1 | suk-1-pro |
+----+-----------+---------------+
1 rows in set (0.00 sec)
As you can see from the resulting output, the production data is present with suk-1-pro.
- Request the cyborg-flow-gateway gateway service to simulate testing data:
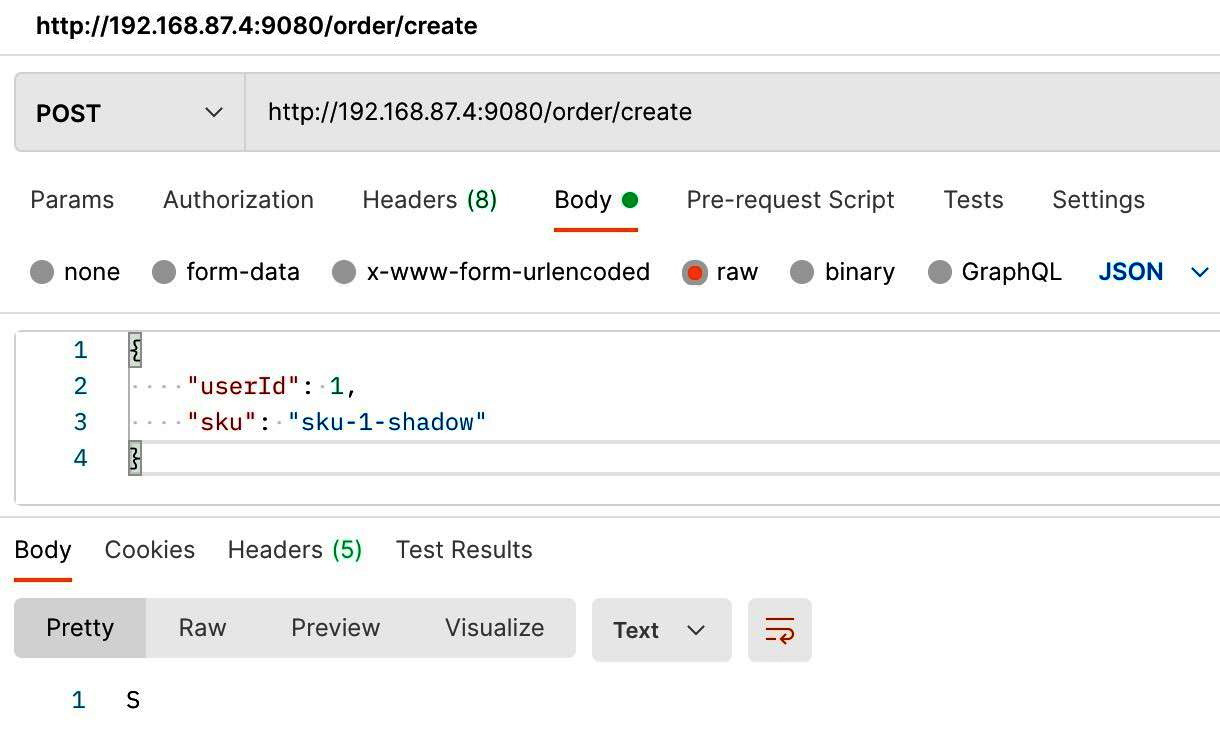
Figure 12.16 – Testing data simulation request in CyborgFlow
- View the request link and execute SQL in cyborg-dashboard:
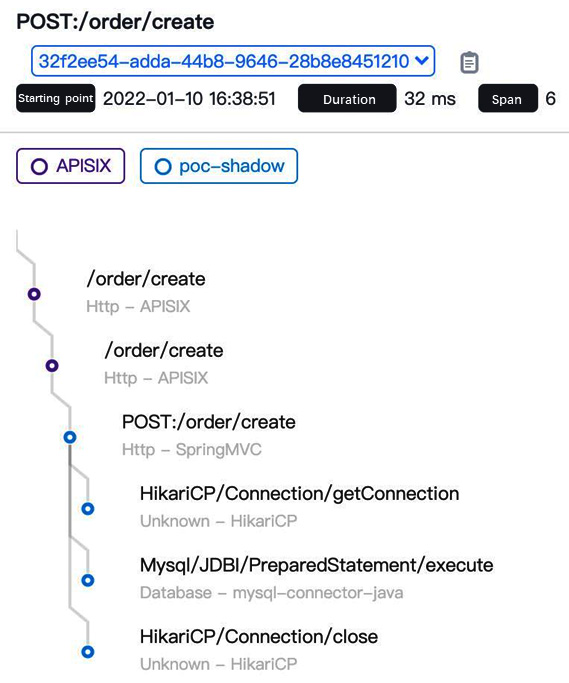
Figure 12.17 – Simulation link and request data test in CyborgFlow
- View the test data in the cyborg-database-shadow database with the following code example:
Bash
mysql> select * from t_order;
+----+-----------+---------------+
| id | user_id | sku |
+----+-----------+---------------+
| 1 | 1 | suk-1-shadow |
+----+-----------+---------------+
1 rows in set (0.00 sec)
As you can see from the output result of the query, the data is present with suk-1-shadow. The next section will introduce examples including ShardingSphere's database gateway feature.
Database gateway
In this section, we will go through real real-world examples featuring database gateway. We will first start by reviewing the deployment architecture, followed by the configuration and testing for both of ShardingSphere's clients – Proxy and JDBC.
The deployment architecture
In this case, the underlying database adopts PostgreSQL, deployed with the read/write splitting architecture of one host and two secondaries. The upper database layer adopts a hybrid deployment solution of ShardingSphere-Proxy and ShardingSphere-JDBC. Based on the distributed governing capabilities provided by Cluster mode, you can easily modify cluster metadata online and synchronize the data to proxy and JDBC. Proxy can use the ShardingSphere built-in DistSQL to achieve traffic control operations (including circuit breaker) and disable the secondary database.
Figure 12.18 illustrates the typical deployment architecture, including both proxy and JDBC, and primary and secondary databases.
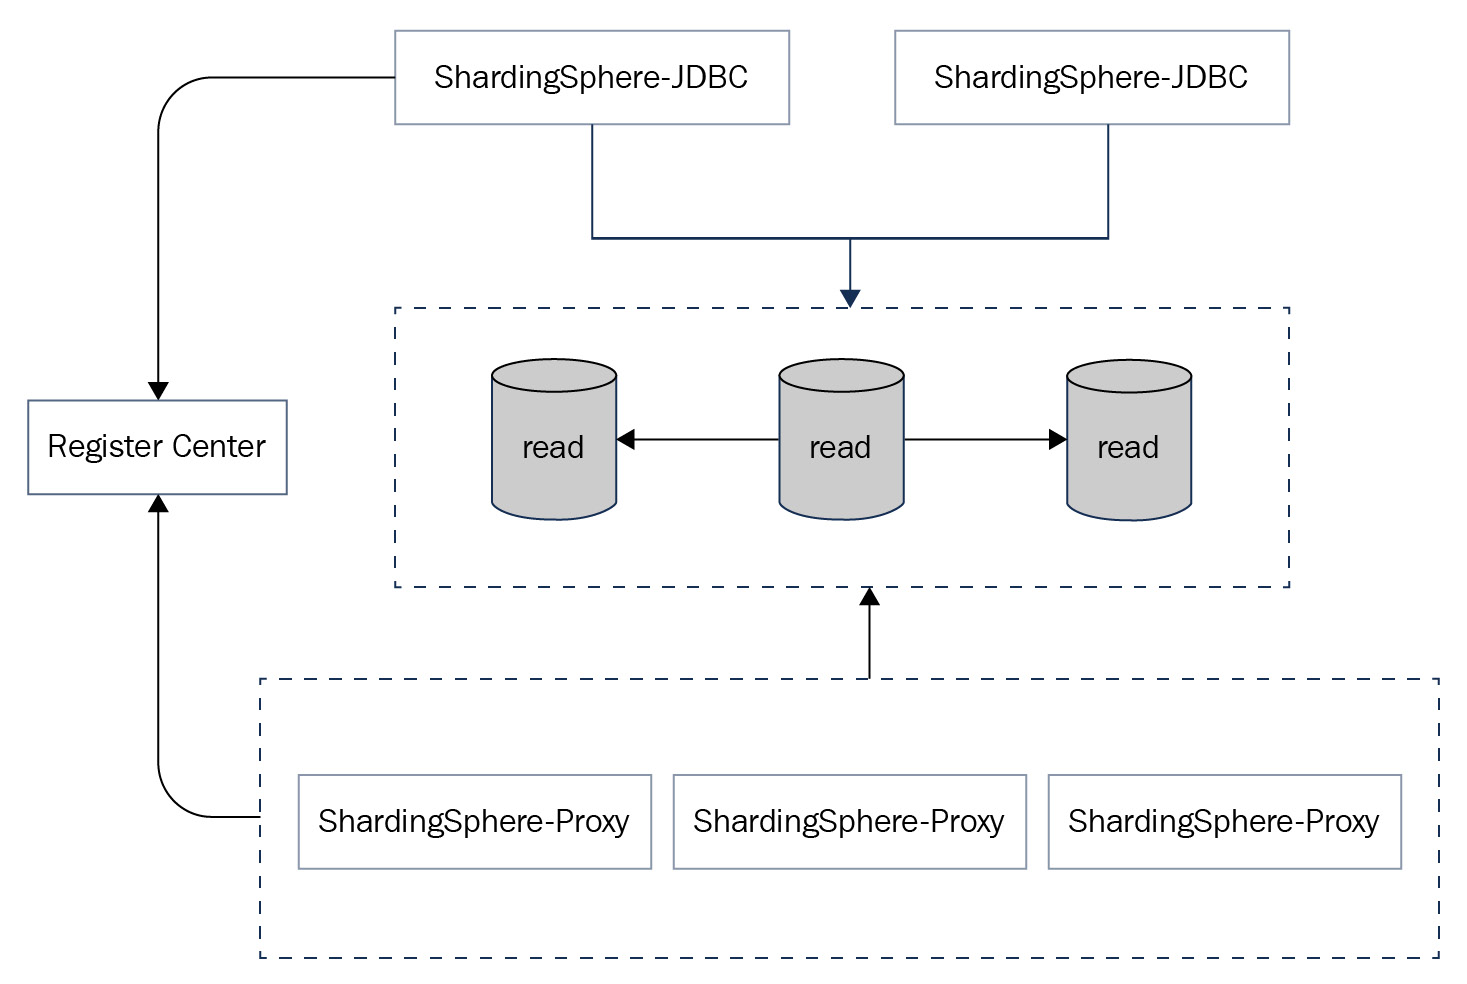
Figure 12.18 – Database gateway deployment architecture
The example configuration
ShardingSphere-Proxy and ShardingSphere-JDBC have to be configured respectively. In actual application scenarios, you can achieve dynamic configuration with DistSQL. This case adopts the YAML configuration to make the configuration easier to understand.
We will first look at how to configure the database gateway with ShardingSphere-Proxy:
- We first choose the Cluster mode in server.yaml. Proxies in the same cluster share the same configurations:
YAML
mode:
type: Cluster
repository:
type: ZooKeeper
props:
namespace: governance_ds
server-lists: localhost:2181
retryIntervalMilliseconds: 500
timeToLiveSeconds: 60
maxRetries: 3
operationTimeoutMilliseconds: 500
overwrite: true
props:
sql-show: true
- Then, configure the read/write splitting rules in config-readwrite-splitting.yaml. Proxies in the same cluster need to be configured only once since other proxies will synchronize the configuration from the registry center when initiated:
YAML
schemaName: readwrite_splitting_db
dataSources: # omitted data source config
primary_ds:
replica_ds_0:
replica_ds_1:
- With the data source, we should also input the rules for the implementation, as presented in the following code:
rules:
- !READWRITE_SPLITTING
dataSources:
pr_ds:
writeDataSourceName: primary_ds
readDataSourceNames:
- replica_ds_0
- replica_ds_1
We can now look at how to configure the database gateway with ShardingSphere-JDBC. ShardingSphere-JDBC should keep the same Cluster mode as ShardingSphere-Proxy. It doesn't require a local configuration of rules but will synchronize the ShardingSphere-Proxy configuration from the registry center when initiated:
YAML
schemaName: readwrite_splitting_db
mode:
type: Cluster
repository:
type: ZooKeeper
props:
namespace: governance_ds
server-lists: localhost:2181
retryIntervalMilliseconds: 500
timeToLiveSeconds: 60
maxRetries: 3
operationTimeoutMilliseconds: 500
overwrite: false
ShardingSphere-JDBC should configure schemaName to ensure the same cluster as ShardingSphere-Proxy.
The recommended cloud/on-premises server
You can refer to the following list for an example of server configuration and application information:
- Server configuration:
- CPU – 8-core
- Storage – 16 GB
- Hard Drive – 500 GB
- Application information:
- ShardingSphere-Proxy – 5.0.0
- PostgreSQL – 14.2
- ZooKeeper – 3.6.3
Start and test it!
If you have followed the preceding steps to configure your database gateway with both ShardingSphere Proxy and JDBC, you should start it and make sure that it is running properly. The following section gives you a walkthrough to successfully start and test your database gateway with ShardingSphere.
Step 1 – Read/write splitting
In this case, we are going to create a read/write splitting strategy by inserting data into two replica databases, and then watermark the data in each database so that you can know which replica database the data comes from.
We will do so by inserting SQL first into each replica database one by one, and then query the system to confirm the routing node. For this procedure, you can base your procedure on the following code:
- Here is the SQL script:
SQL
c demo_primary_ds;
CREATE TABLE t_order (
order_id INT PRIMARY KEY NOT NULL,
user_id INT NOT NULL,
status CHAR(10) NOT NULL
);
- First, insert the data into the primary database as follows:
SQL
INSERT INTO t_order (order_id, user_id, status)
VALUES (1, 10001, 'write'),
(2, 10002, 'write'),
(3, 10003, 'write'),
(4, 10004, 'write'),
(5, 10005, 'write'),
(6, 10006, 'write'),
(7, 10007, 'write'),
(8, 10008, 'write'),
(9, 10009, 'write'),
(10, 10010, 'write');
- Once done, you can create a replica database called demo_replica_ds_0:
c demo_replica_ds_0;
CREATE TABLE t_order (
order_id INT PRIMARY KEY NOT NULL,
user_id INT NOT NULL,
status CHAR(10) NOT NULL
);
- Now that a replica database is created, you can insert the data in the demonstration replica database as well:
INSERT INTO t_order (order_id, user_id, status)
VALUES (1, 20001, 'read_0'),
(2, 20002, 'read_0'),
(3, 20003, 'read_0'),
(4, 20004, 'read_0'),
(5, 20005, 'read_0'),
(6, 20006, 'read_0'),
(7, 20007, 'read_0'),
(8, 20008, 'read_0'),
(9, 20009, 'read_0'),
(10, 20010, 'read_0');
- Next, we create a second replica database called Demo_replica_ds_1 as follows:
c demo_replica_ds_1;
CREATE TABLE t_order (
order_id INT PRIMARY KEY NOT NULL,
user_id INT NOT NULL,
status CHAR(10) NOT NULL
);
- We again insert the data into the newly created replica database:
INSERT INTO t_order (order_id, user_id, status)
VALUES (1, 30001, 'read_1'),
(2, 30002, 'read_1'),
(3, 30003, 'read_1'),
(4, 30004, 'read_1'),
(5, 30005, 'read_1'),
(6, 30006, 'read_1'),
(7, 30007, 'read_1'),
(8, 30008, 'read_1'),
(9, 30009, 'read_1'),
(10, 30010, 'read_1');
Now, initiate ShardingSphere-proxy, log in, and execute the following SQL statements:
SQL
readwrite_splitting_db=> SELECT order_id, user_id, status FROM t_order;
readwrite_splitting_db=> SELECT order_id, user_id, status FROM t_order;
Check the ShardingSphere log to confirm whether the routing node is replica_ds_0 or replica_ds_1.
Step 2 – Replica disable
With the completion of step 1, ShardingSphere-Proxy now has the read/ write splitting capabilities. We will move on to the next step, where we will use DistSQL to check the status of the primary and replica databases:
SQL
readwrite_splitting_db=> SHOW READWRITE_SPLITTING READ RESOURCES;
resource | status
---------------+----------
replica_ds_0 | enabled
replica_ds_1 | enabled
(2 rows)
You can disable replica_ds_1:
SQL
readwrite_splitting_db=> DISABLE READWRITE_SPLITTING READ replica_ds_1;
Here is the status after disabling:
SQL
readwrite_splitting_db=> SHOW READWRITE_SPLITTING READ RESOURCES;
resource | status
---------------+----------
replica_ds_0 | enabled
replica_ds_1 | disabled
(2 rows)
Now, execute SQL to verify that ShardingSphere routing is correct. Check the ShardingSphere log to confirm that the routing node is replica_ds_0:
SQL
readwrite_splitting_db=> SELECT order_id, user_id, status FROM t_order;
Step 3 – Circuit breaker
If you'd like to implement the circuit breaker feature in addition to the read/write splitting feature, as configured in the previous two steps, you can refer to the following steps. You should note that the circuit breaker feature can be configured independently of whether you implement read/write splitting or not.
To configure the circuit breaker, start by initiating two ShardingSphere-Proxies: ShardingSphere-Proxy-3307 and ShardingSphere-Proxy-3308. Log in to ShardingSphere-Proxy-3307 and check the current instance list:
SQL
readwrite_splitting_db=> SHOW INSTANCE LIST;
instance_id | host | port | status | labels
---------------------+---------------+------+---------+--------
192.168.2.184@3308 | 192.168.2.184 | 3308 | enabled |
192.168.2.184@3307 | 192.168.2.184 | 3307 | enabled |
(2 rows)
Disable ShardingSphere-Proxy-3308 proxy instances through ShardingSphere-Proxy-3307:
SQL
readwrite_splitting_db=> DISABLE INSTANCE 192.168.2.184@3308;
Check the instance list after disabling the instance:
SQL
readwrite_splitting_db=> SHOW INSTANCE LIST;
instance_id | host | port | status | labels
---------------------+---------------+------+---------+--------
192.168.2.184@3308 | 192.168.2.184 | 3308 | disabled|
192.168.2.184@3307 | 192.168.2.184 | 3307 | enabled |
(2 rows)
Log in to ShardingSphere-Proxy-3308 and verify that the current instance has been disabled:
SQL
readwrite_splitting_db=> SHOW INSTANCE LIST;
ERROR 1000 (C1000): Circuit break mode is ON.
You are now familiar with ShardingSphere's database gateway feature. Consider saving the examples you found in this section and coming back to them whenever you are having trouble or need to set up a database gateway in the future.
Summary
In this chapter, through carefully selected cases, you got a complete overview of some real-world ShardingSphere application scenarios. These cases have been chosen based on our experience and Apache ShardingSphere's community-rich experience in working closely with stock market-listed enterprises handling billions of rows of often highly-sensitive data.
Not only do you now possess knowledge accrued thanks to the experience of large enterprises, but you are also reaching the conclusion of this book – and becoming an Apache ShardingSphere master. We suggest trying to implement the knowledge you have learned so far in your environment. If you encounter any difficulties, we recommend connecting with our community, which means you'll probably get to know us, as well.
Communities are key for us. The community has been the key to building the Apache ShardingSphere ecosystem, and a key to getting market-leading enterprises to adopt ShardingSphere. The next chapter will give a more comprehensive understanding of our community, its history, and future direction.