
11
Tracing Dapr Applications
In this chapter, you will learn about observability options in Dapr by exploring how traces, logs, and metrics are emitted and can be collected in Dapr using Zipkin, Prometheus, and Grafana. These are the main topics of the chapter:
- Observing applications in Dapr
- Tracing with Zipkin
- Analyzing metrics with Prometheus and Grafana
With Dapr in self-hosted mode, which we used during the development of our Dapr applications, we had an option to directly access the logs from the Dapr sidecar processes and applications as console output, in addition to the ability to debug our service code with Visual Studio Code (VS Code).
In the Kubernetes mode of Dapr, however, the approach is going to be different because of the complexity of a multi-node cluster and the constraints imposed on a production environment.
Technical requirements
The code for this sample can be found on GitHub at https://github.com/PacktPublishing/Practical-Microservices-with-Dapr-and-.NET-Second-Edition/tree/main/chapter11.
In this chapter, the working area for scripts and code is expected to be <repository path>chapter11. In my local environment, it is C:Reposdapr-sampleschapter11.
Please refer to the Setting up Dapr section in Chapter 1, Introducing Dapr, for a complete guide to the tools needed to develop with Dapr and work with the samples.
This chapter builds upon the Kubernetes cluster we set up and configured in Chapter 9, Deploying to Kubernetes; refer to this chapter to reach the same configuration.
Observing applications in Dapr
In a monolithic application made up of a few components running on a limited number of nodes, understanding how the application is behaving is a relatively simple task. In such a context, there is an expectation that by monitoring the activity of some processes on one or maybe two nodes to get higher availability, and their usage of the nodes’ central processing unit (CPU) and memory over time, we can get a good perspective on the application’s behavior. Log files would be available on the nodes, and the collection of those files could be arranged with any classic monitoring solution.
Once the number of working components increases dramatically, however, when we leverage the advantages coming from building microservices around business capabilities, the level of complexity grows along with it. We have more processes to monitor, and it is also likely that these are related to each other and might even have dependencies on external components; as we learned throughout this book, microservices often collaborate via a service-to-service invocation or publish/subscribe (pub/sub) and rely on state stores.
The growth of complexity does not stop here. The life cycle of the microservices composing our solution is shorter; maybe we are able to scale out microservice instances by reacting to the current load.
Our microservice solution will not necessarily need more nodes to run; being more expensive is not an objective! On the other hand, our solution might gain a significant benefit by operating on an infrastructure composed of many self-repairing nodes.
Moreover, the development and deployment practices we learned with Docker give us more flexibility but add an abstraction layer between the node and our code.
We will not understand much of our application’s behavior by looking at metrics from any of the nodes.
From this increased (but, alas, necessary and welcome) complexity comes the need for observability of microservices: the ability to instrument new and existing applications to collect metrics, logs, and traces from a diverse set of processes, running on a variable number of hosts (nodes and containers), with the primary objective of correlating each signal with others to offer a complete view of a client request or job.
Let’s consider the following simplified representation of the saga pattern, introduced in Chapter 6, Publish and Subscribe:

Figure 11.1 – Request traces in a microservice solution
As depicted in Figure 11.1, when our solution processes many requests by splitting the work among many microservices, how can we understand which requests are taking more time to execute? How do we account for the interaction between microservices and the state store? To simplify, the goal with observability is to gain a clear view of which request (among 1, 2, or 3) is consuming the most resources.
Dapr supports distributed tracing by automatically correlating traces of a request as it crosses boundaries between the Dapr runtime, our service code, and the Dapr services and components.
As Dapr is a runtime, you only need to configure tracing and decide where to export traces to, nothing more- no frameworks or packages to install and maintain.
Dapr also exposes metrics of the overall Dapr infrastructure, from runtimes in sidecar containers to system services, offering full visibility on how Dapr operates on a Kubernetes (or self-hosted) environment.
Important note – OpenTelemetry
Dapr adopts OpenTelemetry (see https://opentelemetry.io/ to learn more), a Cloud Native Computing Foundation (CNCF) project with the goal to facilitate integration with frameworks and tools for tracing, metrics, and logs.
With the OpenTelemetry Collector, Dapr can export traces to any OpenTelemetry-integrated backend and platforms. The OpenTelemetry Collector offers a vendor-agnostic implementation of how to receive, process, and export telemetry data. You can find more details at https://docs.dapr.io/operations/monitoring/tracing/open-telemetry-collector/.
In the next section, we will set up Zipkin to see how distributed tracing can help us understand how our Dapr applications are performing.
Tracing with Zipkin
Zipkin is an open source distributed tracing system. It offers the ability to search for traces by identifier (ID), service, operation, or tags, and shows the dependencies between services. You can learn more at https://zipkin.io/.
These are the steps we will follow to set up Zipkin in Dapr on Kubernetes:
- Setting up Zipkin
- Configuring tracing with Zipkin
- Enabling tracing in Dapr
- Investigating with Zipkin
Let’s start by installing Zipkin in the cluster we prepared in Chapter 9, Deploying to Kubernetes.
Setting up Zipkin
Zipkin is distributed as a Docker container. You probably already have it on your local development environment, as it has been installed by default with Dapr.
We can deploy it to Kubernetes with the following Deploydeploy-zipkin.yaml file:
apiVersion:  apps/v1
kind:  Deployment
metadata:
    name:  zipkin
    labels:
        app:  zipkin
spec:
    replicas:  1
    selector:
        matchLabels:
            app:  zipkin
    template:
        metadata:
            labels:
                app:  zipkin
        spec:
            containers:
            -  name:  zipkin
                image:  openzipkin/zipkin
                ports:
                -  containerPort:  9411
---
apiVersion:  v1
kind:  Service
metadata:
    name:  zipkin
    namespace:  default
    labels:
        app:  zipkin
spec:
    type:  ClusterIP
    ports:
    -  protocol:  TCP
        port:  9411
        targetPort:  9411
    selector:
        app:  zipkin
In the preceding code snippet, Zipkin is deployed with the openzipkin/zipkin container exposed at port 9411, and a service endpoint is created with the same port. This is necessary to make it reachable by service name from other Pods.
We can apply the configuration to Kubernetes with the following command:
PS C:Repospractical-daprchapter11> kubectl apply -f .
Deployzipkin.yaml
To access Zipkin on Kubernetes, we have two options: as we have an NGINX ingress controller already configured in our cluster, we could create an ingress to the Zipkin service and restrict access to the path from our client Internet Protocol (IP) address. Alternatively, we could use the port-forwarding command of kubectl, as in the following command:
PS C:Repospractical-daprchapter11> kubectl port-forward svc/
zipkin 9412:9411
Forwarding from 127.0.0.1:9412 -> 9411Forwarding from
[::1]:9412 -> 9411
With the kubectl port-forward command (see documentation at https://kubernetes.io/docs/tasks/access-application-cluster/port-forward-access-application-cluster/), a local port on our development environment is mapped to a service (this could also be a Pod) on Kubernetes. As I already have Zipkin locally, I mapped the local port 9412 to port 9411 on the service named zipkin in Kubernetes.
If we access the Zipkin portal at http://localhost:9412/, we should be able to see the portal for Zipkin running in the AKS cluster even though there is no data, as we still need to configure tracing; we’ll do this in the next step.
Configuring tracing with Zipkin
As we have installed Zipkin, we must now configure Dapr to send all distributed traces to it.
The Deployconfiguration-zipkin.yaml file has a Dapr configuration named tracing suitable for our needs, as illustrated in the following code snippet:
apiVersion: dapr.io/v1alpha1
kind: Configuration
metadata:
    name: tracing
    namespace: default
spec:
    tracing:
        samplingRate: "1"
        zipkin:
            endpointAddress: "http://zipkin.default.svc.
               cluster.local:9411/api/v2/spans"
    mtls:
        enabled: true
        workloadCertTTL: 24h
        allowedClockSkew: 15m
In the previous snippet, samplingRate in the tracing element is specified; as the value is > 0, Dapr tracing is enabled, and with value = 1, all traces get sampled. You can check the Dapr documentation at https://docs.dapr.io/operations/configuration/configuration-overview/#tracing to learn more.
Furthermore, in zipkin, we configure endpointAddress to point to the Zipkin internal service we previously deployed in our Kubernetes cluster.
We apply the configuration with the following command:
PS C:Repospractical-daprchapter11> kubectl apply -f .
Deployconfiguration-zipkin.yaml
We defined a Dapr configuration with Zipkin as the tracing destination. Next, we will enable this configuration in all of our Dapr applications.
Enabling tracing in Dapr
At this stage, Zipkin is working in Kubernetes, and Dapr is configured to export distributed traces to it. As the last step, we need to start the flow of traces from the Dapr applications.
We now need to update our Dapr applications with the new configuration named tracing, as we do in the following example:
apiVersion: apps/v1
kind: Deployment
metadata:
    name: reservation-service
    namespace: default
    labels:
        app: reservation-service
spec:
    … omitted …
    template:
        metadata:
            labels:
                app: reservation-service
            annotations:
                dapr.io/enabled: "true"
                dapr.io/app-id: "reservation-service"
                dapr.io/app-port: "80"
                dapr.io/config: "tracing"
… omitted …
The change to the dapr.io/config annotation must be replicated on each of our Dapr applications’ .yaml files and then applied, as follows:
kubectl apply -f .Deploysample.microservice.order.yaml
kubectl apply -f .Deploysample.microservice.reservation.yaml
kubectl apply -f .Deploysample.microservice.reservationactor.
yaml
kubectl apply -f .Deploysample.microservice.customization.
yaml
kubectl apply -f .Deploysample.microservice.shipping.yaml
With the previous kubectl commands, we re-apply the deployments of our five Dapr applications in Kubernetes, updated to use the new Dapr configuration.
In Chapter 10, Exposing Dapr Applications, we learned how to enable Dapr on an NGINX ingress controller and how to integrate Dapr with Azure API Management in a self-hosted deployment. Depending on which of these options (or both) you implemented in your environment, the overall solution running in AKS could have one (or two) more Dapr applications on which we should enable the new configuration.
By following the instructions at https://docs.microsoft.com/en-us/azure/aks/kubernetes-portal?tabs=azure-cli#edit-yaml, you can edit the deployment manifest to enable the proper configuration with dapr.io/config annotation. Do not worry if you do not succeed as it will not dramatically change the way you look at Zipkin traces.
In this chapter, all requests and subsequent Zipkin traces start from the nginx-ingress application, representing the Dapr-enabled NGINX ingress controller.
Docker Hub Ready-to-Use Images
As described in Chapter 9, Deploying to Kubernetes, ready-to-use container images for each of the sample applications are available on Docker Hub, and deployment scripts are available in the chapter working area.
Deployment script and configuration files are available to support both options - using your own container images from Azure Container Registry or using the ready-to-use container images. For the latter, files are named with the .dockerhub.yaml or .dockerhub.ps1 suffix.
The Dapr dashboard offers a nice view of the configuration, as shown in the following screenshot:
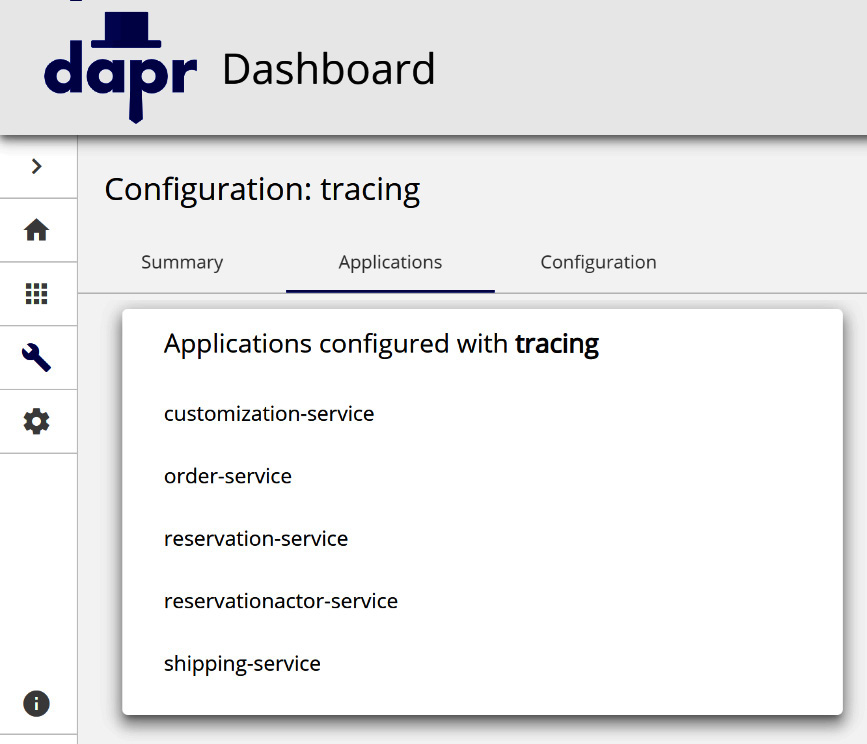
Figure 11.2 – Dapr application adopting tracing
In Figure 11.2, we see a configuration named tracing and the applications configured with it; each of the Dapr applications in the scope of our solution have tracing enabled.
It’s time to learn how Zipkin can help us in understanding our applications’ behavior.
Investigating with Zipkin
We need some data to visualize in Zipkin. The test.http file you can use in VS Code with the RestClient extension is a simple approach to perform sample http requests.
In Chapter 10, Exposing Dapr Applications, we implemented both an NGINX-based ingress and Azure API Management self-hosted gateway; there should be plenty of options for externally reachable routes to choose from.
Considering the available routes in your specific scenario, by requesting GET http://<your AKS cluster>/balance/<sku> and POST http://<your AKS cluster>/order a few times, we should generate enough traces to examine in Zipkin.
Let’s open the Zipkin portal at http://localhost:9412/, or whichever local port we used in the previous section with port forwarding. Let’s take a look at the following screenshot:
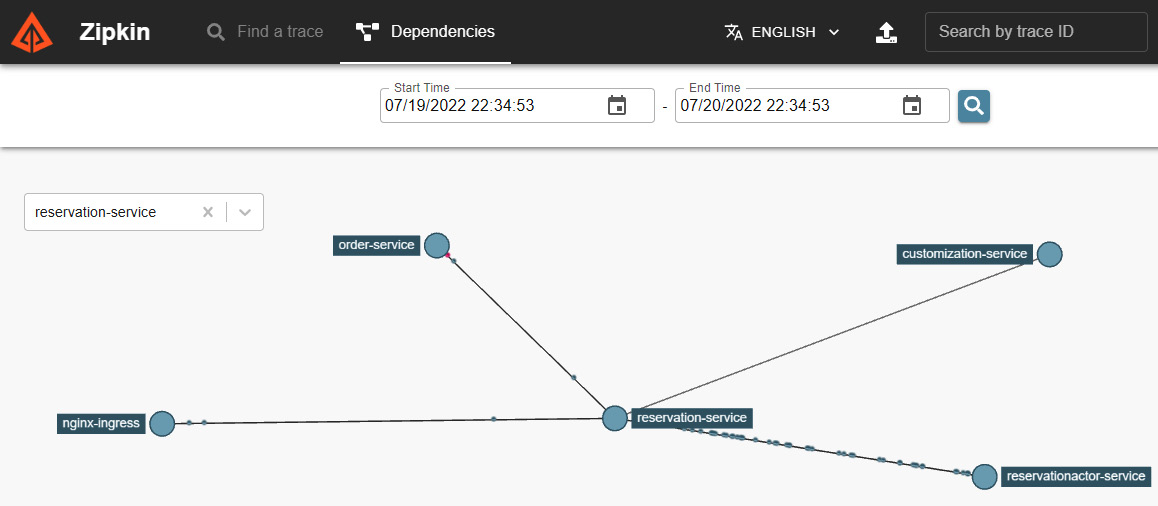
Figure 11.3 – Zipkin dependencies
In Figure 11.3, let’s examine the dependencies by choosing the service named reservation-service, which takes a central position in the flow of interactions in our solution; we should have a similar view with many points (each symbolizing an interaction) from order-service to reservation-service, many more from here to reservationactor-service, and fewer to customization-service. Many of the interactions between reservationactor-service and customization-service are represented with a red color, so it is reasonable to ask: what is going on?
If we used the test.http file to simulate requests to our Dapr solution, we would have been ordering and requesting the customization of the infamous crazycookie cookie with the stock-keeping unit (SKU); in Chapter 6, Publish and Subscribe, we introduced this fixed rule to simulate an unrecoverable error during the customization phase of the saga pattern we implemented.
Before we switch to trace analysis in Zipkin, let’s clarify two concepts: a span is the unit of work executed in a component or service, while a trace is a collection of spans. Take a look at the following screenshot:
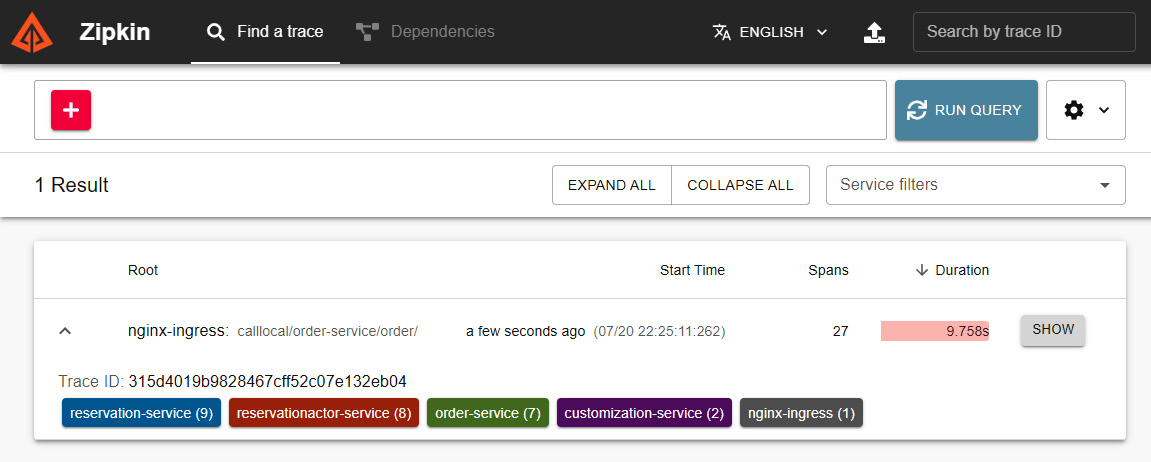
Figure 11.4 – Zipkin traces
In Figure 11.4, I managed to find a trace, originating from nginx-ingress, as it is the Daprized ingress controller in our solution; it then reaches the solution at order-service. If I expand it, I see it includes interactions with all the other Dapr applications; it seems a good candidate for further investigation. By clicking SHOW, the Zipkin portal switches to a detailed view of all the spans in the trace.
We should get a view like the one in the following screenshot:
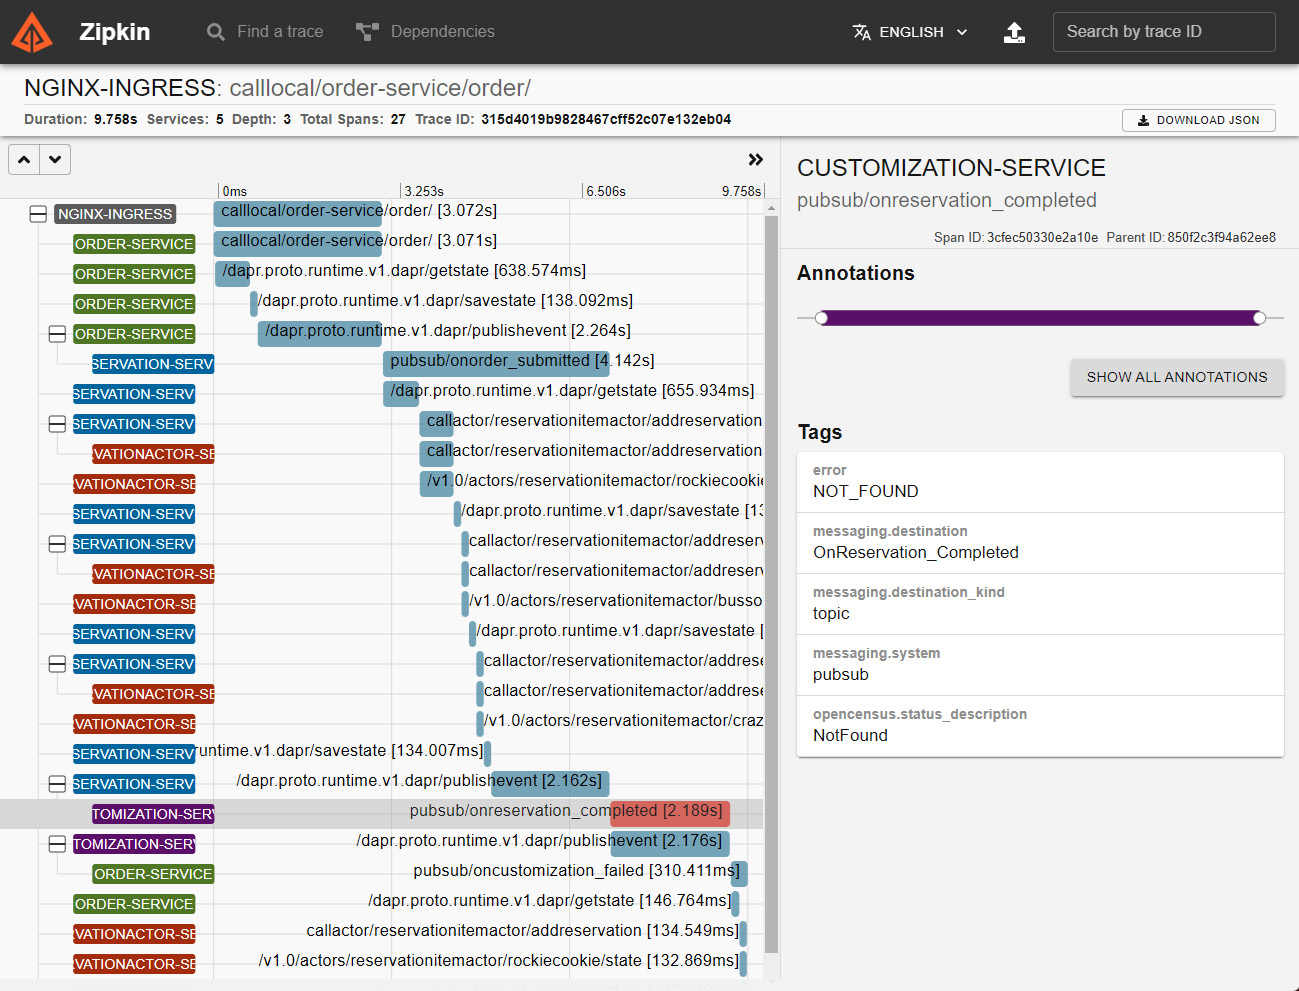
Figure 11.5 – Zipkin trace: NOT_FOUND error in a span
In Figure 11.5, we see the spans displayed in order, showing the service originating the span, the operation, and its execution time.
Let’s focus on a span from customization-service, which is represented in red to indicate failure.
In this span, Dapr reports that an error of type NOT_FOUND has been received while processing a call to pubsub/OnReservation_Completed.
To understand the interaction between Dapr and our code, we need to look at the ASP.NET controller in the project for the customization-service Dapr application—specifically, the sample.microservice.customizationControllersCustomizationController.cs file, which you will find in the chapter09 folder.
Examining the code, we should find the portion in which customization-service simulates an error once customization is requested on a cookie with the crazycookie SKU. If the customization fails, our code does the following:
… omitted …
if (!customizedItem.Succeeded)
{
     await  daprClient.PublishEventAsync<OrderCustomization>
    (PubSub,common.Topics.CustomizationFailedTopicName,  result);
     Console.WriteLine($"Customization in {order.Id} of {SKU}
        for {quantity} failed");
     return  this.NotFound();
}
… omitted …
In the previous code snippet, the ASP.NET controller code is returning a NotFound result to the caller, just after it publishes a message to the OnCustomization_Failed topic via the configured Dapr pub/sub component — in our case, it is the Azure Service Bus (ASB) component.
Our choice in handling the irreversible error that customer-service encountered (or simulated) explains the NotFound error in the span we see in Zipkin. It also explains the next span we see in order, which is the notification of a failure to the next stages of the saga. Take a look at the following screenshot:
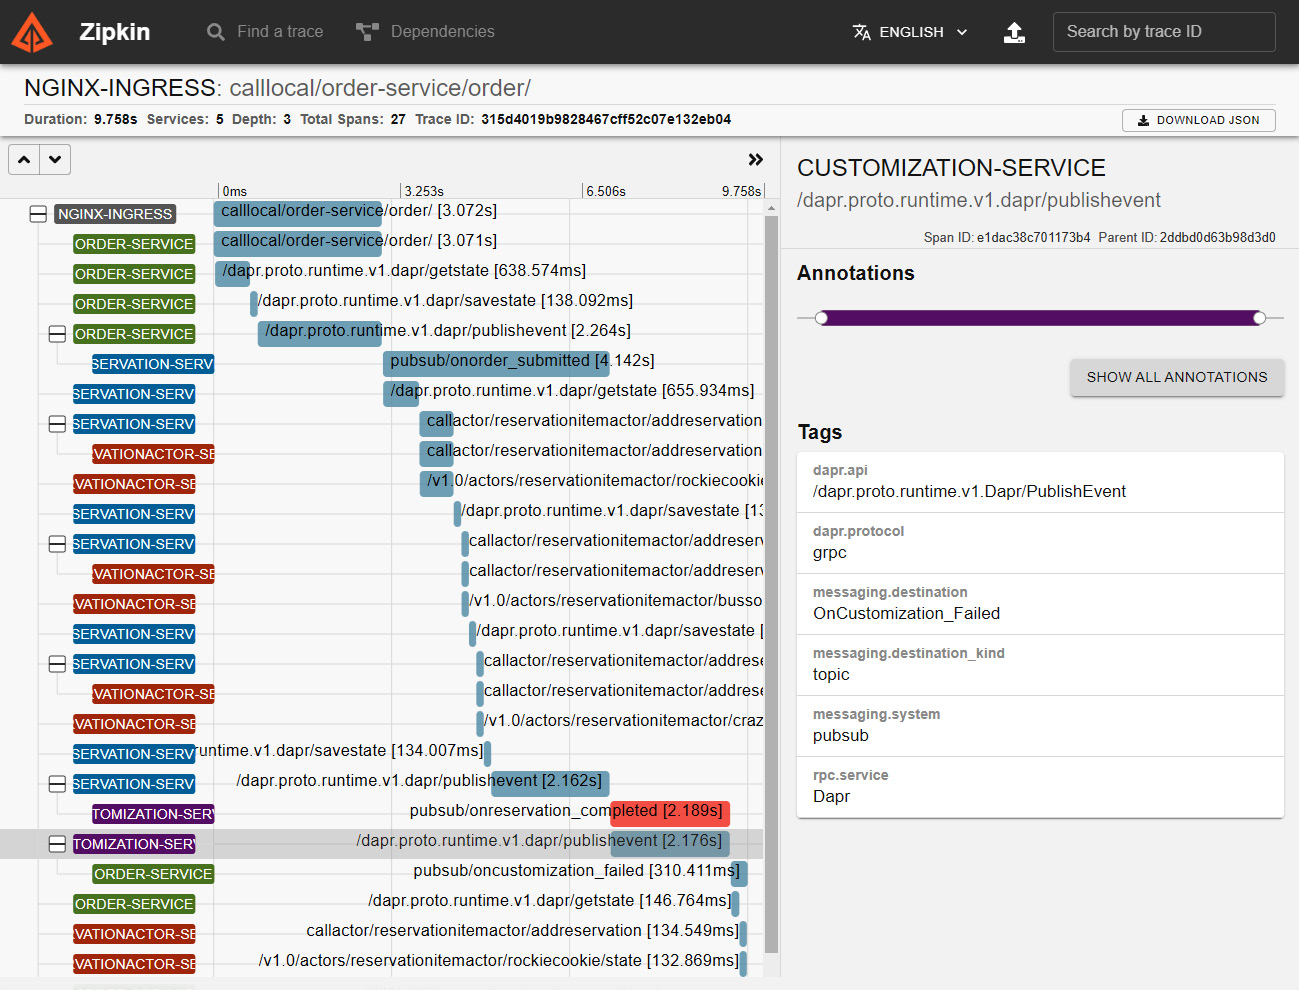
Figure 11.6 – Zipkin trace: span showing a publishevent action
Just to refresh on some of the concepts we learned so far, in Figure 11.6 we see a span with a call to the Dapr application programming interface (API), using the gRPC Remote Procedure Call (gRPC) protocol: it is the Dapr software development kit (SDK) for ASP.NET, which relies on gRPC to interact with the Dapr sidecar container.
We have now learned how to enable distributed tracing in our Dapr applications and how to configure Zipkin to help us understand how our application is handling requests and events in complex interactions, as we saw with the saga example.
In the next part of the chapter, we will learn how to monitor all the elements of Dapr, and how they consume resources in a Kubernetes cluster, with Prometheus and Grafana.
Analyzing metrics with Prometheus and Grafana
Prometheus is an open source system and monitoring toolkit, a project with a long history that started in 2012 and is now part of the CNCF.
In our scenario, we will use Prometheus to scrape the metrics exposed by all Dapr Pods and store them as time series. This will act as the data source for the Grafana dashboards.
Grafana is an open source visualization and analytics tool. We will use it to examine the Dapr metrics by importing the dashboard templates released by the Dapr project as assets from https://github.com/dapr/dapr/releases/.
These are the steps we will follow:
- Installing Prometheus
- Installing Grafana
- Importing dashboards
Let’s start by installing the Prometheus service components.
Installing Prometheus
As described in the Dapr documentation, available at https://docs.dapr.io/operations/monitoring/metrics/prometheus/, we should first create a namespace to be used by Prometheus and Grafana, as follows:
kubectl create namespace dapr-monitoring
We are going to use Helm to install the charts for Prometheus and Grafana in the dapr-monitoring namespace, as illustrated in the following code snippet:
helm repo add prometheus-community https://prometheus-
community.github.io/helm-charts
helm repo update
helm install dapr-prom prometheus-community/prometheus -n dapr-
monitoring
The deployment could take some time, so let’s proceed to the next command after all the Pods are ready, as follows:
kubectl get pods -n dapr-monitoring -w
NAME                                           READY   STATUS
dapr-prom-kube-state-metrics-7b5b859f9b-
sjn5x       1/1     Running
dapr-prom-prometheus-alertmanager-676c85b59-
58n77   2/2     Running
dapr-prom-prometheus-node-exporter-
6tt72            1/1     Running
dapr-prom-prometheus-node-exporter-
9n8xf            1/1     Running
dapr-prom-prometheus-node-exporter-
k6bpm            1/1     Running
dapr-prom-prometheus-pushgateway-d5d9dbb
fc-7cpj6    1/1     Running
dapr-prom-prometheus-server-57fbcb9446-
8r6rv        2/2     Running
The Prometheus Pods are now running; before we move on to Grafana, let’s collect the information of the Prometheus service address, as indicated by running the following command:
kubectl get svc -n dapr-monitoring
NAME                           TYPE
CLUSTER-IP     dapr-prom-kube-state-metrics
ClusterIP   10.0.176.113   dapr-prom-prometheus-alertmanager
    ClusterIP   10.0.122.126   dapr-prom-prometheus-node-
exporter   ClusterIP   None           dapr-prom-
prometheus-pushgateway     ClusterIP   10.0.219.150
dapr-prom-prometheus-server          ClusterIP   10.0.222.218
The service is named dapr-prom-prometheus-server; we will use this information to configure the Grafana data source in the following section.
Installing Grafana
Following the Dapr documentation at https://docs.dapr.io/operations/monitoring/metrics/grafana/, this is the command to install Grafana:
helm repo add grafana https://grafana.github.io/helm-charts
helm repo update
helm install grafana grafana/grafana -n dapr-monitoring
As we are using PowerShell, we can obtain the password, autogenerated for us by Grafana, with the following command:
$base64secret = kubectl get secret --namespace dapr-monitoring
grafana -o jsonpath="{.data.admin-password}"
$password = [System.Text.Encoding]::UTF8.GetString([System.
Convert]::FromBase64String($base64secret))
$password
MIDoEFh8YtnfQLByAvG4vB1N4A…
The last value from the previous output is the password—in my case, to access the Grafana dashboard.
We can now access the Grafana dashboard by port - forwarding to the corresponding Kubernetes service.
Importing dashboards
We can access Grafana from our local development environment with the following command, mapping local port 8090 (as port 8080 is used by the Dapr dashboard by default) to the remote port 80, like this:
kubectl port-forward svc/grafana 8090:80 -n dapr-monitoring
By accessing http://localhost:8090/ and submitting the credentials (the password from the previous section and the default username admin), we can log in to Grafana.
Once we access the Grafana portal user interface (UI), we need to add the Prometheus data source first, selecting the Configuration dial from the sidebar and Data Sources, as illustrated in the following screenshot:
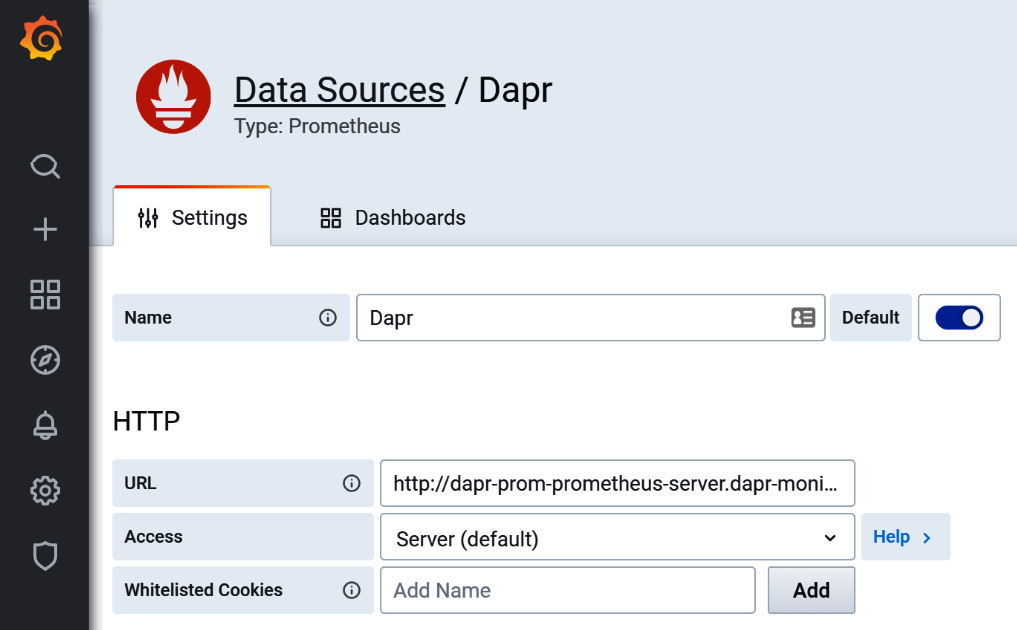
Figure 11.7 – Dapr data source in Grafana
As in Figure 11.7, we added the http://dapr-prom-prometheus-server.dapr-monitoring Prometheus service as a data source in Grafana, making it the default one.
We can import the following three ready-to-use dashboards provided by Dapr:
- grafana-system-services-dashboard.json
- grafana-sidecar-dashboard.json
- grafana-actor-dashboard.json
Each Dapr release (https://github.com/dapr/dapr/releases) has these dashboards as version-specific assets, and we can find these at https://github.com/dapr/dapr/tree/master/grafana.
We can import each one by adding it from the Create dial from the sidebar, selecting Import, and using the link in the URL setting to dashboard it as the source.
The following screenshot shows the Dapr System Services Dashboard screen in Grafana:
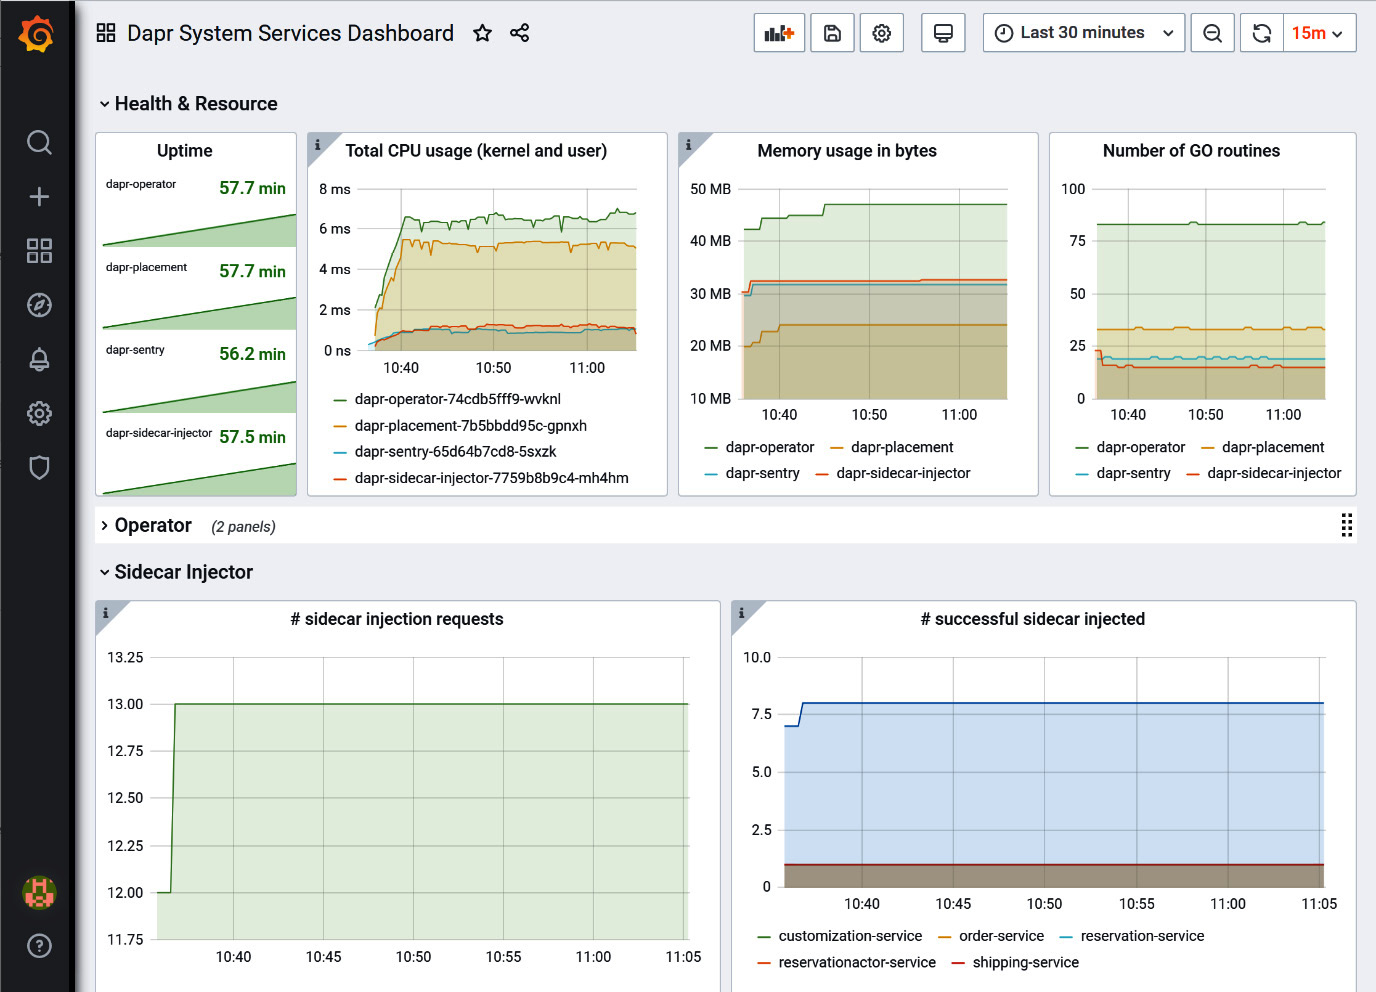
Figure 11.8 – Dapr System Services Dashboard in Grafana
At this stage, with Prometheus and Grafana running, we can start exploring the metrics exposed by Dapr. In Figure 11.8, we see the system services, with the total CPU and memory used by all Dapr services spread over the various nodes. Similar views are offered for actors and sidecars.
As our solution is not used by external users yet, there is not much activity, other than the one we can simulate by ourselves by sending a few requests to the API. In the next chapter, Chapter 12, Load Testing and Scaling Dapr, we will simulate more activity with load-testing tools.
With Prometheus and Grafana, we gained full visibility on how Dapr, from the runtime running in the sidecar of our applications’ Pods to the system services, is behaving on Kubernetes.
Summary
In this chapter, we learned how observability, as provided by Dapr, brings order to the chaotic way a modern cloud-native application could look, if approached with classic tools.
By understanding how Zipkin can help us analyze how our Dapr applications behave in a complex environment such as Kubernetes, we now have the confidence we need to face the brave new world of cloud-native applications.
With Prometheus and Grafana, we learned how Dapr informs developers and operators on how an application is performing on Kubernetes, whether this is a cloud implementation, on-premises, or on the edge.
In the next chapter, we will leverage these abilities to observe how Dapr and our applications react to a heavy user load.