12
Load Testing and Scaling Dapr
In this chapter, we will learn how to scale Dapr applications in a Kubernetes environment. After that, we will learn how to load-test a Dapr solution by simulating user behavior with the Locust testing tool.
In this chapter, we will cover the following topics:
- Scaling Dapr in Kubernetes
- Load testing with Locust
- Load testing Dapr
- Autoscaling with KEDA
Load testing is an important practice in software development. It offers developers and operators a scientific approach, guided by practices and tools, to finding the best possible answer to various questions, such as how this application will react to an increase in requests. At which point will the application’s response start degrading in terms of success rate and response time? Will the infrastructure be able to sustain a specific rate of requests with a certain level of performance with the allocated resources?
These questions explore both the technical and economic sides of our architecture; in a cloud-native architecture, the operational cost is a factor that can and should influence the design.
Technical requirements
The code for this chapter’s examples can be found in this book’s GitHub repository at https://github.com/PacktPublishing/Practical-Microservices-with-Dapr-and-.NET-Second-Edition/tree/main/chapter12.
In this chapter, the working area for scripts and code is <repository path>chapter12. In my local environment, it is C:Reposdapr-sampleschapter12.
Please refer to the Setting up Dapr section in Chapter 1, Introducing Dapr, for a complete guide to the tools needed to develop with Dapr and work with the samples.
This chapter builds upon the Kubernetes cluster we set up and configured in Chapter 9, Deploying to Kubernetes; refer to this chapter to reach the same configuration.
There are some additional requirements you will need to accomplish the goals of this chapter. Let’s take a look.
Bash
In this chapter, we are going to deploy Azure resources using a shell script.
One option is to install and use Windows Subsystem for Linux (WSL2) on Windows 10, by following the instructions at https://docs.microsoft.com/en-us/windows/wsl/install-win10.
An alternative to installing WSL2 locally is to rely on Azure Cloud Shell, as described in https://docs.microsoft.com/en-us/azure/cloud-shell/quickstart, and launch the deployment from the context of Azure Cloud Shell.
Python
Python version 3.7 or later is required if you intend to install and try out Locust on your local development machine.
If this version is not already installed in your environment, you can follow the instructions for Python 3 on Windows at https://docs.python-guide.org/starting/installation/.
A quick way to verify whether you have Python 3 installed is to input the following in a Windows terminal:
PS C:Reposdapr-sampleschapter12> python --version
Python 3.9.0
If you decide to use Python from WSL2, you should follow the instructions for Python 3 on Linux at https://docs.python-guide.org/starting/installation/. A quick way to verify whether you have Python 3 installed is to input the following in a Windows terminal:
master@XYZ:/c/Repos/dapr-samples/chapter12$ python3 --version
Python 3.9.0
As shown in the preceding output, the version of Python 3 that’s been installed on your version of Windows could be different than the one that’s available in WSL2.
Locust
I suggest that you install Locust on your local development machine to verify the tests before publishing them to a Locust swarm.
The installation guide for Locust is available at https://docs.locust.io/en/stable/installation.html.
If you decided to use Python from Windows, use the following command to install Locust from a Windows terminal:
PS C:Reposdapr-sampleschapter12> pip3 install locust
To verify the installation and version of Locust, you can use the following command:
PS C:Reposdapr-sampleschapter12> locust -V
locust 2.10.1
If you decide to use Python from WSL2, the same context applies to installing Locust:
master@XYZ:/c/Repos/dapr-samples/chapter11$ pip3 install locust
Locust should be installed in the same environment. This is how you verify the Locust version in WSL2:
master@XYZ:/c/Repos/dapr-samples/chapter12$ locust -V
locust 2.10.1
Next, let’s have a look at the Kubernetes configuration.
Kubernetes configuration
This chapter builds upon the Kubernetes cluster we set up and configured in Chapter 9, Deploying to Kubernetes, and the ingress routes established in Chapter 10, Exposing Dapr Applications; please refer to this chapter to ensure you have the same configuration.
The monitoring configuration we prepared with Zipkin, Prometheus, and Grafana in Chapter 11, Tracing Dapr Applications, is also useful, even if it’s not necessary to follow the instructions. Please refer to this chapter if you want to benefit from the same configuration.
Scaling Dapr on Kubernetes
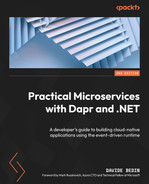
In the world of monolithic architectures, the compute and memory resources that are available to an application are constrained by the hosts that it operates on — that is, VMs or physical nodes. For such applications, it becomes an extraordinary challenge to distribute requests and jobs evenly between multiple hosts. They often resort to an active/passive mode in which only a portion of the allocated resources benefit the application, while the rest are passively sitting idle, waiting for the active environment to fail so that they can switch from their passive role to an active one.
The following diagram depicts the challenges of scaling monolithic applications:
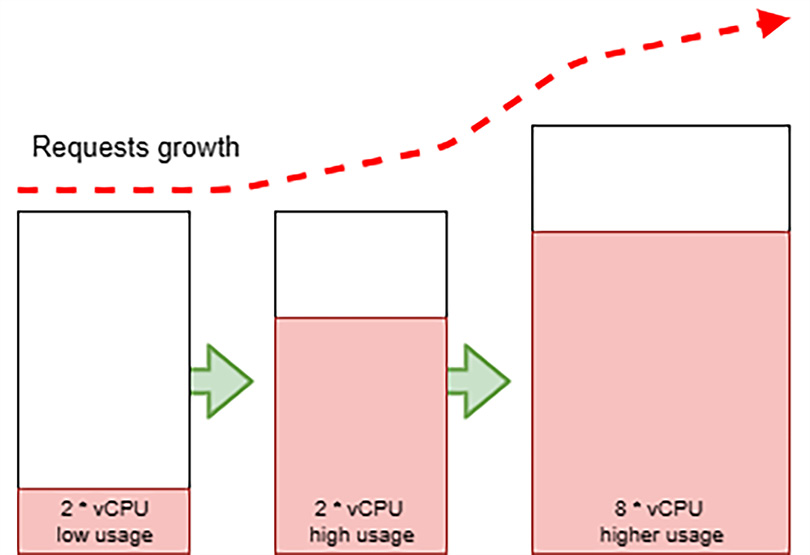
Figure 12.1 – Scaling monolithic applications
Given these factors, to respond to an increase in client requests, which translates to a demand for more computing resources, the response is often to scale up the resources. This can be done by substituting the hosts with more powerful ones, as shown in the preceding diagram. This approach is deemed to inefficiently support workloads with an elastic demand for resources over time.
In the context of microservice architectures, the application is designed with many more components that can be independently deployed and scaled. At any time, there could be multiple instances of a microservice running on different hosts.
For an application based on microservices, scaling means reacting to an increase or decrease in resource demand by adding or removing instances of the involved microservices. There is an expectation that the underlying hosting platform offers an elastic pool of resources, as depicted in the following diagram:

Figure 12.2 – Scaling microservice applications on Kubernetes
As we can see, our Dapr applications are executed as Pods, the smallest deployable unit of computing in Kubernetes. We will rely on the features of this powerful orchestrator to scale our microservices.
Moving forward, the following are the concepts we can use to control scaling in Kubernetes:
Let’s start by exploring the concept of replicas in Kubernetes.
Replicas
In the context of Kubernetes, scaling translates to increasing the number of Pod instances. Each Dapr application (or any application meant to be deployed on Kubernetes) is configured as a Deployment with several replicas: this influences the number of Pods that get created, each with an instance of a container of the application and, in terms of Dapr, a sidecar.
One of the benefits of Kubernetes is that you can quickly recover in case of application errors or availability issues with the hosts. We would want to keep our application responsive, even while its components are being recovered. So, in a production-ready environment, we will have more than one replica of each of our microservices; if one fails, the other replica will continue to respond to requests.
The Deployments we’ve used so far have a replica value of 1; only one Pod per Dapr application has been created. This simplifies the initial setup and configuration of any application on Kubernetes, but it is unlikely to stay at 1 once the solution is ready to enter production.
The following is an extract from the Deploysample.microservice.order.dockerhub.yaml development file for the order-service application:
apiVersion: apps/v1
kind: Deployment
metadata:
  name: order-service
  namespace: default
  labels:
    app: order-service
spec:
  replicas: 1
…omitted…
Notice that the replica value is 1. This might seem contradictory, but let’s leave this value as we found it; we will affect it by enabling the autoscale mechanisms offered by Kubernetes.
Autoscale
In Kubernetes, we can manually change the replicas of a Deployment by updating its configuration or by changing the number of nodes that support the cluster.
Kubernetes can automatically scale up and down the number of replicas of a Deployment, based on the resource usage metrics of its Pods, with the Horizontal Pod Autoscaler (HPA).
Kubernetes can also add or remove cluster nodes, depending on the overall resource’s capacity and demand. If there are more Pods to spin up than the available CPUs, the Cluster Autoscaler (CA) can sense it and accommodate the request by adding a new node.
The two Kubernetes autoscalers often operate in tandem: the first by requesting more replicas for a Deployment under increasing load, and the second by adapting the cluster size to the overall resource demands by Pods.
You can find more information about these Kubernetes features at https://kubernetes.io/docs/tasks/run-application/horizontal-pod-autoscale/, and from an Azure Kubernetes Service (AKS) perspective at https://docs.microsoft.com/en-us/azure/aks/concepts-scale.
To avoid introducing too much complexity all at once, we will focus on the HPA. There is a valid walk - through available at https://docs.microsoft.com/en-us/azure/aks/tutorial-kubernetes-scale#autoscale-pods.
The following are the changes we intend to apply to each of our Dapr application Deployments, starting with Deployhpa.sample.microservice.order.dockerhub.yaml for order-service:
… omitted …
apiVersion: autoscaling/v1
kind: HorizontalPodAutoscaler
metadata:
  name: order-service-hpa
  namespace: default
spec:
  maxReplicas: 4
  minReplicas: 1
  scaleTargetRef:
    apiVersion: apps/v1
    kind: Deployment
    name: order-service
  targetCPUUtilizationPercentage: 50
In the previous configuration snippet, we configured a HorizontalPodAutoscaler resource so that it scales the replica of Deployment, named order-service, from a minReplicas value of 1 to a maxReplicas value of 4, one replica at a time, if the deployment’s resource usage exceeds the targetCPUUtilizationPercentage metric of 50%.
However, we are missing an important configuration element of our Dapr application’s Deployment: we must specify the resource requests and limits of our Pods.
Resource requests and limits
Specifying requests and limits for CPU and memory usage is a good practice to allow for proper resource planning in Kubernetes. This prevents your Pods from consuming all the resources that are available on the nodes, which subsequently impacts other Pods in your solution or other systems running in the same cluster. However, this results in instability issues being created for your available nodes and workloads.
By setting resource requests and limits, we inform the Kubernetes cluster of how to properly handle our workload and the basis on which to scale it.
The Pods of our Dapr application have two containers: the Dapr sidecar and our service code, which is based on the ASP.NET container image.
For the CPU and memory requests and limits of our ASP.NET service code, we need to make some initial assumptions that are suitable for a sample we must assess.
The Dapr documentation at https://docs.dapr.io/operations/hosting/kubernetes/kubernetes-production/#sidecar-resource-requirements suggests having a configuration that’s suitable for the Dapr sidecar container in a production environment.
These settings can be applied to a Dapr application Deployment as annotations. The following Deploysample.microservice.order.dockerhub.yaml file for order-service shows the intended changes:
apiVersion: apps/v1
kind: Deployment
metadata:
  name: order-service
  namespace: default
  labels:
    app: order-service
spec:
  replicas: 1
  selector:
    matchLabels:
      app: order-service
  template:
    metadata:
      labels:
        app: order-service
      annotations:
        dapr.io/enabled: "true"
        dapr.io/app-id: "order-service"
        dapr.io/app-port: "80"
        dapr.io/config: "tracing"
        dapr.io/log-level: "info"
        dapr.io/sidecar-memory-request: "250Mi"
        dapr.io/sidecar-cpu-request: "100m"
        dapr.io/sidecar-memory-limit: "4000Mi"
        dapr.io/sidecar-cpu-limit: "1"
        … omitted …
    spec:
      containers:
      - name: order-service
        image: davidebedin/sample.microservice.order:2.0
        ports:
        - containerPort: 80
        imagePullPolicy: Always
        resources:
          limits:
            memory: "800Mi"
            cpu: "400m"
          requests:
            memory: "200Mi"
            cpu: "100m"
… omitted …
With dapr.io/sidecar-memory-request and dapr.io/sidecar-cpu-request, we are specifying that the Dapr sidecar in a Pod for order-service should start by requesting 250 MiB of memory and 100 m of CPU (0.1 vCPU).
The container that contains our service code (which is using the <your ACR registry name>.azurecr.io/sample.microservice.order:2.0 image or davidebedin/sample.microservice.order:2.0) is requesting 100 MiB of memory and 100 m of CPU.
Docker Hub Ready-to-Use Images
As described in Chapter 9, Deploying to Kubernetes, ready-to-use container images for each of the sample applications are available on Docker Hub, and their deployment scripts are available in this chapter’s working area.
Deployment scripts and configuration files are available to support both options — using your own container images from Azure Container Registry or using the ready-to-use container images. For the latter, files are named with the .dockerhub.yaml or .dockerhub.ps1 suffixes.
In this chapter, it is assumed you will prefer to leverage the ready-to-use images in Docker Hub.
The Dapr sidecar has much higher resource limits than our service code since it’s going to handle most of the I/O for our application.
See https://kubernetes.io/docs/concepts/configuration/manage-resources-containers/#resource-units-in-kubernetes for more information on the units of measure that are used in Kubernetes.
Once we are done, we can apply the configuration, as described in the Deploydeploy-solution.dockerhub.ps1 file:
kubectl apply -f .Deploysample.microservice.order.dockerhub.
yaml
kubectl apply -f .Deploysample.microservice.reservation.
dockerhub.yaml
kubectl apply -f .Deploysample.microservice.reservationactor.
dockerhub.yaml
kubectl apply -f .Deploysample.microservice.customization.
dockerhub.yaml
kubectl apply -f .Deploysample.microservice.shipping.
dockerhub.yaml
With the preceding commands, we applied the aforementioned changes to all our application deployments.
With the following command, we can verify that the HPAs for our Dapr application have been configured:
C:Repospractical-daprchapter12> kubectl get hpa
NAME                     REFERENCE
TARGETS   MINPODS   MAXPODS   REPLICAS   AGE
customization-service-hpa      Deployment/customization-service
      13%/50%   1         4         1          2m21s
order-service-hpa              Deployment/order-service
              15%/50%   1       4         1          2m28s
reservation-service-hpa        Deployment/reservation-service
        14%/50%   1       4         1          2m25s
reservationactor-service-hpa   Deployment/reservationactor-service
   20%/50%   1         4         1       2m23s
shipping-service-hpa      Deployment/shipping-service
       3%/50%    1         4       1        2m18s
An HPA analyzes the metrics of the resources that are used by the Pods in a Deployment. Once it detects an increase in CPU usage that’s beyond the configured threshold, it triggers an increase in replicas.
The load test we will set up in the next configuration will trigger this mechanism.
Load testing with Locust
Load testing is a practice in software development that’s used to determine the performance of a complex system under load. This is generated by simulating the concurrent access of users. Load testing web resources, such as an API, usually requires multiple agents to be orchestrated, each with enough internet bandwidth and compute resources to simulate the activity of many users.
In our scenario, we plan to verify the performance and capabilities of our Biscotti Brutti Ma Buoni sample backend, implemented with Dapr and running on Kubernetes.
Locust is a popular open source load-testing tool. It allows you to define a user’s behavior with simple Python scripts and distribute these on as many worker nodes as needed, orchestrated by a master node. More information is available at https://locust.io/.
Important note
I learned about Locust from a GitHub repository (https://github.com/yorek/locust-on-azure) that was created by my colleague Davide Mauri, PM of the Azure SQL team at Microsoft. This repository offers deployment scripts that allow you to use Azure Container Instances (ACI) as a compute option for Locust masters and workers. I personally contributed to the repository with a virtual network - integrated deployment option.
The Locust on Azure repository has already been copied to this chapter’s base directory. You can clone it by using the following command:
PS C:Reposdapr-sampleschapter12> git clone https://github.
com/yorek/locust-on-azure.git
Once the repository has been cloned, copy the Locust test file, prepared for our scenario, over the default test file provided in the repository we just cloned in the previous step:
PS C:Reposdapr-sampleschapter12> copy .loadtest
locustfile.py .locust-on-azurelocust
Let’s open the locust-on-azurelocustlocustfile.py file to examine the Locust test for our scenario:
from locust import HttpUser, TaskSet, task, between
… omitted …
class APIUser(HttpUser):
    wait_time = between(0.1, 1)
    @task(50)
    def getbalance(self):
        SKU = RandomSKU()
        with self.client.get("/balance/%s" % SKU,
        name="balance", catch_response=True) as response:
           if (not(response.status_code == 201 or 200)):
                    response.failure("Error balance: %s" %
                response.text)
    @task(1)
    def postorder(self):
        http_headers = {'content-type': 'application/json'}
        payload = RandomOrder()
        with self.client.post("/order", json=payload,
          headers=http_headers, name="order",
            catch_response=True) as
            response:
            if (not(response.status_code == 201 or 200)):
                response.failure("Error order: %s" % response.
            text)
From the preceding Python snippet, we can see a class arbitrarily named APIUser; Locust will use each class to represent user behavior. In our test, we have only one, which, with a delay between 100 ms and 1 second, as expressed by wait_time = between(0.1, 1), executes the methods decorated with @task. There are two methods, each with a different weight: getbalance, for reading the balance of a product by its SKU, and @task(50), which has a 50 times higher chance of being executed than postorder, a method used to simulate an order submission.
As we saw previously, a Locust test is a simple .py Python file. For further information on this, it is worth looking at the quickstart presented at https://docs.locust.io/en/stable/quickstart.html.
In Chapter 10, Exposing Dapr Applications, we both implemented an NGINX-based ingress and Azure API Management self-hosted gateway; the Locust test presented earlier relies on the GET http://<your AKS cluster>/balance/<sku> and POST http://<your AKS cluster>/order routes, but you can change the test file to leverage the Azure API Management supported routes.
Now that we’ve looked at the Locust test definition and have a suitable example ready, we can launch it to assess the performance of our Dapr applications.
Load testing Dapr
Before we activate a more complex test infrastructure for Locust on ACI, it is best to first check, and eventually debug, the Locust test locally.
The following steps take us through preparing the data to enabling autoscaling on a running load test:
- Preparing the data via port-forwarding
- Testing Locust locally
- Locust on ACI
- Configuring the HPA
First, we need to make sure the data in our environment can support our scenario. This is what we’ll do in the next section.
Preparing the data via port-forwarding
Before we launch the test, which is readily available at locust-on-azurelocustlocustfile.py, let’s focus on an aspect we oversaw; the SKU for the cookies is randomly composed from cookie001 to cookie999, with the addition of the infamous crazycookie, the main actor (pun intended) of the saga from Chapter 6, Publish and Subscribe.
The code that’s being used for our sample Dapr applications is extremely permissive; you could order an item with a negative balance without an issue. You can also add both validation and business logic to it if you are interested.
Nevertheless, all the getbalance test requests will fail since the items that have been created by these SKUs are unknown by the Dapr applications. We can prepare the data by launching the C:Reposdapr-sampleschapter12loadergeneratedata.py Python file.
There is nothing special in this data generator script, other than that it relies on reaching ReservationItemActor, which is not exposed via an ingress controller, at the standard Dapr API URL of http://locahost:5001/v1.0/actors/ReservationItemActor/{id}/method/AddReservation, with {id} being the random cookie SKU.
To use the script, we need to use port-forwarding to locally map port 5001 to the Dapr sidecar on port 3500 in any of the Pods containing our Dapr applications in Kubernetes.
With the following command, you can obtain the name of a Pod in Dapr:
PS C:Reposdapr-sampleschapter12> kubectl get pods -l
app=order-service
NAME                            READY  STATUS  RESTARTS AGE
order-service-75d666989c-zpggg  2/2    Running 0        23h
With the previous command, I searched for Pods with a specific label assigned to order-service Dapr applications.
PS C:Reposdapr-sampleschapter12> kubectl port-forward order-
service-75d666989c-zpggg    5001:3500
Forwarding from 127.0.0.1:5001 -> 3500
Forwarding from [::1]:5001 -> 3500
In the previous command snippet, with port-forwarding, we can gain access to a Dapr sidecar running inside Kubernetes. We can launch the C:Reposdapr-sampleschapter12loadergeneratedata.py script from VS Code or a Windows terminal session with the following command:
PS C:Reposdapr-sampleschapter12loader> python .
generatedata.py
Once all 1,000 instances of ReservationItemActor have been created, we can proceed with the Locust tests.
Testing Locust locally
To launch the locust-on-azurelocustlocustfile.py test file with Locust, use the following command:
PS C:Reposdapr-sampleschapter12locust-on-azurelocust>
locust -H http://<ingress>.<aks url>
The -H parameter sets the host address. Since the tests invoke /balance and /order, the host should contain the base path, including the domain name that’s been defined for the ingress controller.
For our first run, which will tell us whether the tests are correct, let’s simulate a few users with a slow spawning rate. If we do not face any unexpected exceptions, meaning that there are no bugs in our test code, we can increase the number of users.
Let’s ramp up the test to 1,000 users!
In the following screenshot, you can start to see why executing a load test from a single node is not a good idea:
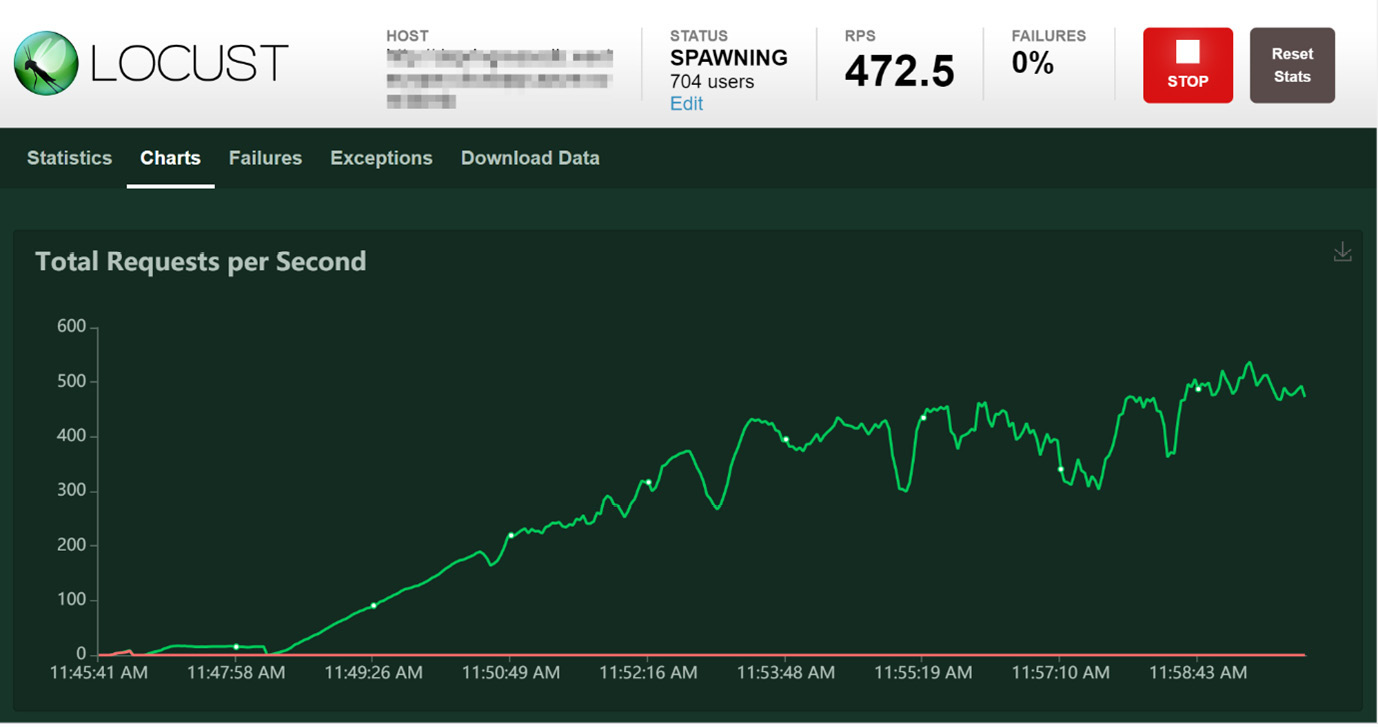
Figure 12.3 – Locust RPS encountering high CPU usage
In the preceding screenshot, you can see the Locust dashboard. It shows how the requests per second (RPS) have reached a plateau of 400 RPS and that they are not moving from there. From a Kubernetes perspective, I did not see any high CPU utilization.
Once I looked at the Windows terminal session running Locust, I saw the following output:
PS C:Reposdapr-sampleschapter12locust-on-azurelocust>
locust -H http://<ingress>.<aks url>/bbmb
[2020-10-31 11:46:56,730] XYZ/INFO/locust.main: Starting web
interface at http://0.0.0.0:8089 (accepting connections from
all network interfaces)
[2020-10-31 11:46:56,746] XYZ/INFO/locust.main: Starting Locust
1.3.1
[2020-10-31 11:48:21,076] XYZ/INFO/locust.runners: Spawning
1000 users at the rate 1 users/s (0 users already running)...
[2020-10-31 11:51:57,393] XYZ/WARNING/root: CPU usage above
90%! This may constrain your throughput and may even give
inconsistent response time measurements! See https://docs.
locust.io/en/stable/running-locust-distributed.html for how to
distribute the load over multiple CPU cores or machines
I’m running Locust from my local development machine to check the quality of the tests. However, as reported in the output, I already encountered a CPU with high-stress conditions.
Considering the high CPU usage warning, in conjunction with the time series shown in the preceding screenshot, this could well be a factor that’s negatively impacting the validity of the overall test.
Now that we’ve stopped the load test, let’s focus on the metrics presented by Locust:
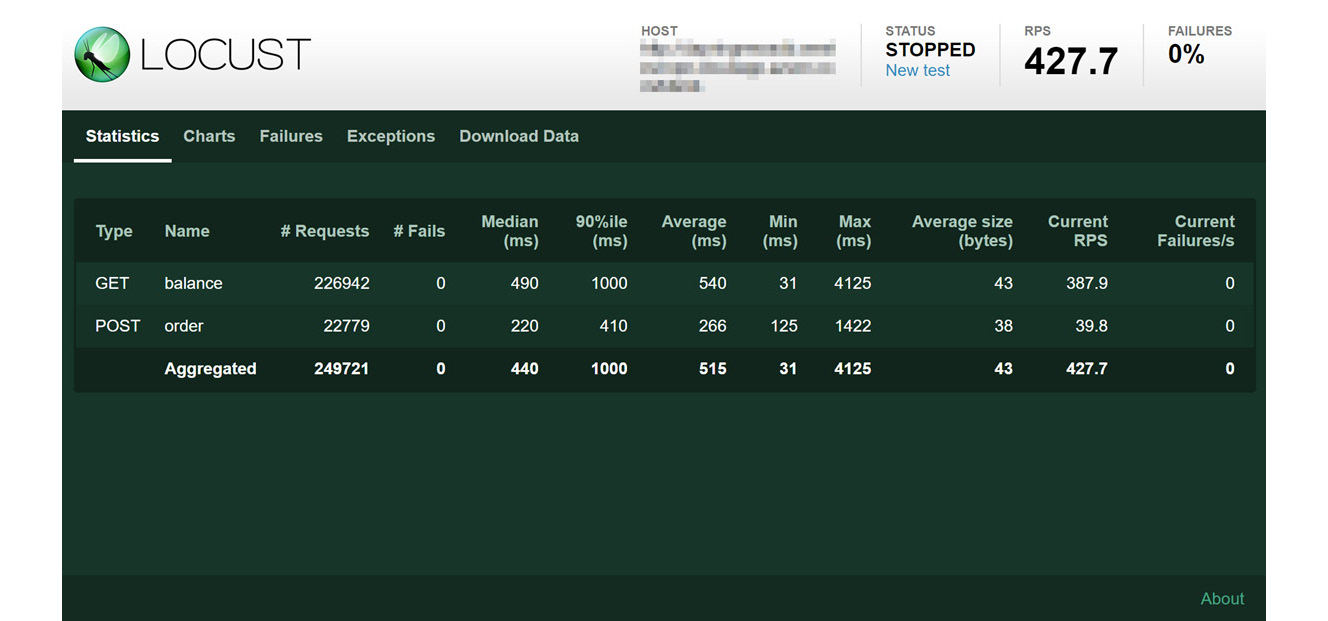
Figure 12.4 – Locust test statistics
In the preceding screenshot, you can appreciate the data presented by Locust on the Statistics pane, which is where the performance of each task is presented. This information, including Exceptions and Failures reports, is also available as CSV files that you can download.
Your experience may change, depending on the CPU and network bandwidth of the local machine you are using for Locust, as well as the network capacity of your site.
In this section, we learned how to write a Locust test, how to test it locally, how to interpret the Locust metrics, and, most importantly, why an Azure-based deployment of a Locust swarm is a good approach so that we have an effective load testing environment.
Locust on Azure Container Instances
The Locust on Azure implementation offered at https://github.com/yorek/locust-on-azure leverages the ACI resource to execute Locust in distributed mode, along with master and worker nodes.
While AKS offers containers orchestrated by Kubernetes, ACI allows us to execute individual containers without the need for an orchestrator.
The following diagram shows how this solution is composed:

Figure 12.5 – Locust on ACI
The template is activated by executing the locust-on-azureazure-deploy.sh script, which can be found in this chapter’s base directory. The script uploads the Python files present in the locust-on-azurelocust directory to a newly created Azure Files storage. This storage option in Azure is mounted on all ACI instances. Finally, Locust is activated on the ACI, with the worker nodes interacting with the master node. This is the one exposing the Locust portal to the users, as shown in the preceding diagram.
Locust on Azure is a shell script; therefore, we need to shift to WSL, as described in the Technical requirements section. We also need to access our Azure subscription from this context with az login. Once we’ve done this, we can launch the azure-deploy.sh script:
master@XYZ:/c/Repos/dapr-samples/chapter12/locust-on-azure$ ./
azure-deploy.sh
Environment file not detected.
Please configure values for your environment in the created
.env file and run the script again.
TEST_CLIENTS: Number of locust client to create
USERS_PER_CLIENT: Number of users that each locust client will
simulate
SPAWN_RATE: How many new users will be created per second per
locust client
HOST: REST Endpoint to test
RESOURCE_GROUP: Resource group where Locust will be deployed
AZURE_STORAGE_ACCOUNT: Storage account name that will be
created to host the locust file
As described in the first execution, we need to specify a few variables in order to describe the destination environment. Once we’ve specified those in the .env files in the same locust-on-azurelocust directory, the setup will be complete, and the resources will be successfully deployed to Azure:
master@XYZ:/c/Repos/dapr-samples/chapter12/locust-on-azure$ ./
azure-deploy.sh
loading from .env
starting
creating storage account: daprlocustsharedstorage
retrieving storage connection string
creating file share
uploading simulator scripts
uploading /c/Repos/dapr-samples/chapter12/locust-on-azure/
locust/locustfile.py
Finished[###################################]  100.0000%
deploying locust (10 clients)...
locust: endpoint: http://<omitted>:8089
locust: starting ...
locust: users: 1000, spawn rate: 10
Once we’ve deployed the script, we receive the endpoint of our Locust portal.
Now that we have a proper testing platform for a Locust swarm running on Azure, unbridled from the CPU and bandwidth constraints of a single workstation, we are ready to launch a new test.
Observing the Horizontal Pod Autoscaler
In this chapter, we learned how an HPA operates, and we accordingly configured our Dapr applications with autoscalers. Now, it is time to see it in action.
Let’s launch the Locust test from the portal. This time, it can be reached at the public IP of the master ACI, as printed in the output shown in the previous section.
Since we are aiming to apply a load of 1,000 concurrent users to our API, let’s examine the behavior of the HPA with the kubectl get hpa -w command while the Locust swarm starts executing requests:
PS C:Reposdapr-sampleschapter12> kubectl get hpa -w
NAME                           TARGETS    REPLICAS   AGE
customization-service-hpa      78%/50%    1          14m
order-service-hpa              139%/50%   1          14m
reservation-service-hpa        185%/50%   4          14m
reservationactor-service-hpa   147%/50%   1          14m
shipping-service-hpa           2%/50%     1          14m
reservation-service-hpa        255%/50%   1          14m
customization-service-hpa      78%/50%    2          14m
order-service-hpa              139%/50%   3          15m
reservationactor-service-hpa   142%/50%   4          14m
reservation-service-hpa        255%/50%   4          15m
customization-service-hpa      10%/50%    2          15m
order-service-hpa              29%/50%    3          15m
reservationactor-service-hpa   66%/50%    8          15m
shipping-service-hpa           2%/50%     1          15m
reservation-service-hpa        142%/50%   8          15m
reservationactor-service-hpa   66%/50%    10         15m
reservation-service-hpa        142%/50%   10         15m
A few columns have been removed from the preceding output to evidence the growth in replicas enforced by the HPAs. This was triggered by an increase in CPU usage by the reservation-service and reservationactor-service applications. These Dapr applications perform most of the operations in the overall solution, so this behavior was expected.
Let’s examine the same data, but plotted on a chart:
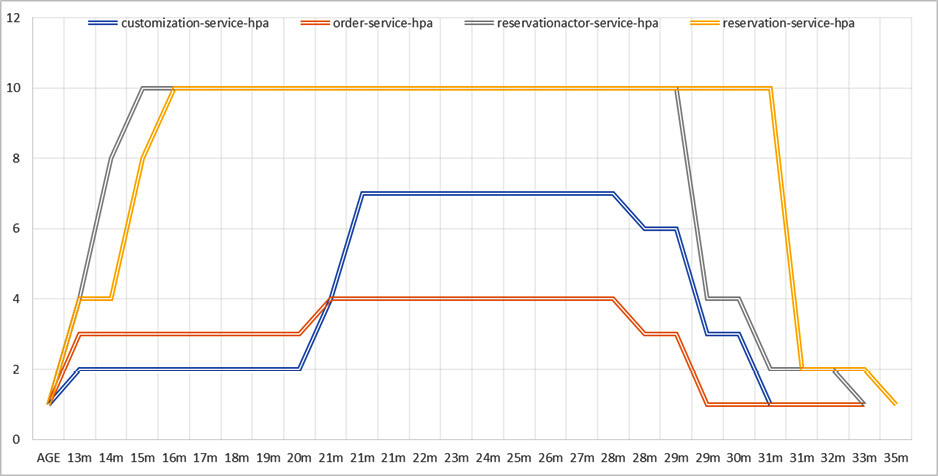
Figure 12.6 – HPA scaling up and down
As we can see, the HPA for the reservation-service and reservationactor-service applications scaled up quickly to 10 Pod instances and was kept at the maximum limit imposed by the HPA for the duration of the test. Once they had done this, they scaled down during the cooling period to the minimum number of Pods — that is, 1:

Figure 12.7 – Locust load test
There are several other aspects to account for during a load test: the impact on the Dapr state store and publish/subscribe is extremely relevant. In the preceding screenshot, we can see a few spikes in the response time that should be investigated.
Resiliency in Dapr
As we explored the resiliency feature throughout the book, we learned how it can be applied to the building blocks used in our solution: service-to-service invocation, state component, publish and subscribe component, and actor.
What happens if a Dapr application scale based on demand publishes messages another Dapr application subscribes to, but the latter application experiences transient errors from the state management because of excessive load on the external database? How do we want to handle it?
Resiliency applies the end-to-end scenario as an issue in one Dapr application, while it could leave other ones apparently unaffected, and might increase the time needed to complete the operation, having a cascading effect on the number of operations completed in a unit of time. A load test with lots of positive results might not tell the whole story; by providing sophisticated policies to influence how Dapr and our application recover from errors, we gain the ability to handle complex scenarios.
By looking at the Locust portal, we can see that setting a higher number of Pods could have had a positive impact.
If our load test was aiming to allow 1,000 concurrent users to interact with our Dapr application’s API with an end-to-end response time of about half a second, having nearly 1,200 requests per second could be a satisfactory result.
Before we complete our load testing journey, let’s consider another autoscaling option.
Autoscaling with KEDA
So far, we’ve learned that the HPA is triggered by the CPU and memory metrics of the Pods in a Deployment.
Kubernetes-Based Event-Driven Autoscaling (KEDA) is a Cloud-Native Computing Foundation (CNCF) project, with the objective of extending the capabilities of the Kubernetes HPA so that it reacts to the metrics of resources that are external to the Kubernetes cluster.
You can learn more about KEDA (https://keda.sh/) in the context of Dapr at https://docs.dapr.io/developing-applications/integrations/autoscale-keda/.
Considering the vast adoption of the publish/subscribe Dapr building block in our example, it would be smart to increase (and decrease) the number of Pods based on the messages accumulating in the underlying messaging system, which is Azure Service Bus in our case. If the number of enqueued messages grows, we could add more Pods so that Dapr dequeues the messages and our ASP.NET code processes the requests.
In more general terms, reacting to the metrics of the incoming messages is useful if we wish to anticipate a load other than the stress that occurs in processing.
KEDA offers scalers for most of the publish/subscribe components supported by Dapr, which makes it a powerful tool at our disposal.
We will see KEDA scalers in action in Chapter 13, Leveraging Serverless Containers with Dapr.
Summary
In this chapter, we learned how to scale the Kubernetes resources of our Dapr applications with the Deployment configuration, as well as how to automatically adapt the number of replicas to CPU and memory usage with the HPA.
The concepts we explored in this chapter gave us a more solid approach to testing Dapr applications under specific conditions; is our overall solution, starting with the nodes of the Kubernetes cluster and including the database (state store) and message bus (publish/subscribe), capable of sustaining a specific load?
Even if we had to venture outside the land of C# and .NET to leverage Locust, I think the advantages of learning a popular, developer-oriented load-testing framework justify the effort. Python is also supported in Dapr with an SDK for services and actors, so maybe this could be the next stage of our learning experience with Dapr.