
4
The Information Systems Territory
4.1. The territory
The concept of territory is important, because the history of information systems is linked to the issue of representation. In this section, we present different visions of the concept of the organizational territory and the information systems territory.
The word “territory” is polysemous, with meanings that differ depending on the angle of approach, the disciplines studying it and the era. In the social sciences, territory can be defined as “an arrangement of material and symbolic resources capable of structuring the physical conditions of existence of an individual or a social group and in return making this individual or group aware of their own identity” [LEV 13]. This definition highlights the presence of material resources and cultural or symbolic resources. Material resources cover the physical world: earth, air, water, buildings, etc. Cultural resources include economic, social and cultural components, such as the value of pure water, relationships between neighbors and the historical significance of a monument. Thus, territory is not only the physical space represented by a physical map, but also a symbolic value to the individuals and groups who built it. In fact, in social terms, the appropriation of territory mostly happens cognitively and symbolically. This appropriation of territory is often done through the transformation of space by human labor, thus opening up space for organizations to use in a dynamic process of transformation. Territory entails the existence of borders that are regularly subject to revision due to changes in the territory itself and the neighboring territories. Finally, the spatiality of territory is conceived in general as an interlocking of a multitude of scales.

Figure 4.1. A territory consisting of physical resources such as water, plastic signs and people. In addition, symbolic resources such as the relationships between people, the meaning of the information on the plastic signs and the cultural aspect of ritual bathing in these waters. The fence marks the territorial boundary1
4.2. Organizational and microeconomic territory
In every organization, there are also territories, with their material and symbolic resources, their borders and their transformation dynamics. However, achieving a degree of materialization and stabilization of the territories and their boundaries is a key managerial imperative in order to ensure that the organization’s common objective is pursued. This imperative runs up against the issue related to the question of power over the territories [BID 06].

Figure 4.2. Representation of an organization’s territory with its boundary (perimeters)
4.2.1. The hierarchical-functional territory
First, the executive establishes a hierarchy within the organization and imposes subordination on the workers through structuring the organization in a pyramid form, with a handful of business-critical decision-makers at the top and a mass of action-takers at the bottom.
Table 4.1. Hierarchical levels (adapted from Anthony [ANT 65])
| Activities | Timescale | Hierarchical level | Activity structure type |
| Strategic | Long term | Board (Executive Officers and Directors) | Loosely structured |
| Tactical | Mid term | Middle management | Moderately structured |
| Operational | Short term | Administrative and shop floor staff | Highly structured |
The hierarchical perspective recognizes that different types of activities are performed at different levels of the organization by members with specific responsibilities. From the hierarchical point of view, three levels can be clearly defined.
The operational level deals principally with ongoing business activities, impacting directly on the business in the short term. These activities are tightly structured, by procedures that leave the workforce little room for leeway or interpretation. The vital goal is efficient in the execution of the various operational tasks. The operational level tends to encompass the majority of the workforce who often have office-based and shop-floor qualifications.
The management level of an organization is principally concerned with decisions on medium-term impact for each business function. Activities performed by these managers tend to be partially structured, with a certain amount of uncertainty, potential to interpret events and significant leeway for freedom of action. These managers tend to seek to meet management expectations in terms of results achieved by the department for which they are responsible, as per the strategic objectives defined by management.
The organization’s Board tends to be involved in strategic decisions, impacting the organization as a whole in the long term. These decisions are often loosely structured, with very heterogeneous data equally drawn from internal and external sources, and partial information. In general, the Board must evaluate current trends in order to identify the best upcoming opportunities.

Figure 4.3. Organizational territory seen through its functional silos
Complementary to this, the organizational territory is envisioned as a set of business activities split into core functions, corresponding to the principal business activities of any firm, irrespective of size and complexity: sales and marketing, production, accounting and HR management [FAY 99]. Each different function operates with its own business logic, which leads intrinsically to the formation of functional silos that are relatively independent of each other. In this model, the firm’s optimum is reckoned to be achieved by maximizing the performance of each of the functions seen as autonomous.
The combination of the hierarchical pyramid with functional silos has encouraged territory to be considered in the hierarchical-functional form.

4.2.2. Business process territory
A different analysis of organizational territory puts the focus on the importance of processes and the inclusion of the various functions and levels in organizational processes. A process-driven logic minimizes the divisions between functions and hierarchical levels, because each and every one has its role in the organization’s business processes.


Figure 4.7. M-form (multi-divisional) organizational structure
4.2.3. Organizational structures
In the wake of this original proposition of organizational territory, the focus came onto other propositions and this earliest vision was classified as U-form (or unitary form) to distinguish it from other conceptualized forms, such as M-form (multi-divisional form), where each operational division is organized internally in U-form.
In this scenario, the organizational chart is the firm’s preferred method of territorial mapping to depict all the functional territories within which the relationships between stakeholders, their responsibilities, their legitimacies and their skills are set out. Through the organizational chart, we can understand the posts, responsibilities, functions and respective skills of the stakeholders [BID 06].
Thus, different representations of the organization’s actual territory have emerged in attempts to create a representation of organizational territory that is as close as possible to reality, while also simplifying it.
However, none of these representations is objective and impartial; furthermore, they, in return, influence the territories they represent.
To this complexity of reciprocal influences between the actual territory and the territory as represented, we must add the territorial dynamics. Territories develop over time, in parallel with economic, societal and technological transformation.

Figure 4.8. The organization’s territory and its representations

Figure 4.9. Reciprocal influence between the organizational territory and its representations
Representations of a developing territory must follow the development of the actual territory to seek alignment between representation and reality.
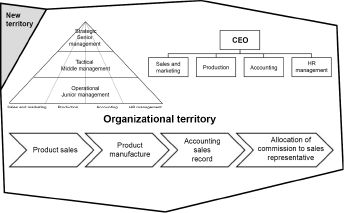
Figure 4.10. The new actual territory must be integrated into the territorial representations
4.3. Organizational territory and mesoeconomics
The mesoeconomic approach expands the view of an organization by including the environment external to the organization with the aim of analyzing reality through economic sub-sets midway between macro- and micro-economics.
The justification for the organization’s form will depend on quasi-automatic controls, linked to transaction costs for the firm in relation to its environment [WIL 75].

Figure 4.11. According to mesoeconomics, organizational form is linked to transaction costs for the firm in relation to its environment. In the illustrated scenario, the company has outsourced payroll to one company and subcontracted part of its manufacture to a second company
An organization would opt to outsource if, by doing so, it could reduce these costs. To do this, the firm builds strategic market relationships with its environment using a rational approach that can be the result of an economic calculation.

Figure 4.12. Strategic relationships of a pharmaceutical company
These theoretical approaches to management support the relevance and coherence of a mesoeconomic analysis of the business, its territory and, as we will see later, its information system. For an organization, territory is thus the substrate of specific assets and the arrangement of material and cultural resources capable of structuring the conditions for the organization’s existence and informing the organization about its own identity. Dynamically, the territory puts each organization in a position of ongoing development in line with the changes in its specific assets, transaction costs and skills. The temporal dynamic becomes an essential element, with the constant need to decide between short-term effectiveness and long-term efficiency.
Territory can play a strategic role in the organization thanks to learning processes and can promote the development of specialized and specific skills [JOF 99]. Learning and skills development are crucial, because an organization’s workforce is less mobile than other resources available within the territory. Therefore, learning and skills development require special attention in order to find a balance between building for the long term and use in the short term.
Conversely, the organization can also have a major impact on the territory. A company, via its business activities, becomes (voluntarily or involuntarily) part of a process of territorialization [AME 88, GAF 90]. This process shapes the territory, builds and destroys resources, and plays a part in defining the territorial trajectories. The successive territorial choices of a firm involve an element of commitment, which can make them irreversible. Every choice made by a business impacts on its territory and these choices are cumulative. In the same way as there are technological trajectories, [DOS 84], there are also territorial trajectories. From the management point of view, it becomes important to understand the risks of an organization becoming entrapped within a given territory by its territorial trajectory. This entrapment would weaken the company, because its destiny would be inextricably linked to its territory. Whereas preserving a certain openness and flexibility towards other territories would make it possible to avoid these pitfalls and keep the balance in the firm–territory relationship [VEL 93].
4.4. The information systems territory
The territory of the information system can be extended to four separate levels: the informational content of the IS, the functions of the IS, the software structure of the IS and the technical structure of the IS.
The informational content refers to the elementary descriptions of the realities recorded, in the broad sense, by the organization and available to it. Information about the organization’s workforce, orders placed by customers, its list of suppliers, production volumes, accounts transactions, etc., all of these things, whether recorded on computer or on paper, are part of the information systems territory.
Example of an organization’s informational content:
- – sales: order number 0028, product name Delta, quantity 10, price €1,000, sales rep Paul Dupont, etc.;
- – production: production date 21/05/2018, Batch 34, product name Delta, etc.;
- – accounting record: date of sale 10/05/2018, customer Pierre Roux, VAT charged €200, merchandise sales €800, etc.;
- – sales commission: name of rep Paul Dupont, amount of commission €10, payment month June 2018, etc.
The word “function” refers to activities possible via the information system. The words “IS function” refer to functions of the organization. Thus, the business operations are split into functional areas. Each area is divided into functional divisions. A functional division is a homogeneous group of business functions (e.g. the divisions of a bank’s branch will include, among others, “customer reception” and “customer affairs management”). Each division is divided into function blocks. Each function can only belong to one block. The blocks interact with each other through functional flows.
An example of information systems functions with its areas, divisions and blocks:
- – Sales & Marketing area:
- - marketing division (market research block, marketing campaign management block, etc.);
- - sales division;
- – Production area.
The software structure refers to the applications installed on the technical structure and each application’s incoming/outgoing informational flows. The territory of the information system thus consists of software that receives incoming data, processes it and produces different outgoing information.
An example of an information system’s software structure with the processed data flows:
- – customer relationship management (CRM) software:
- - sales recording;
- - sending sales information to accounts;
- - sending sales information to production;
- – computer-aided manufacturing software:
- - start production;
- – accounting software:
- - sales accounting;
- - calculation of commission;
- – HR software:
- - allocating commission;
- - sending commission data to accounts.
The technical structure combines the hardware components supporting the software applications: the technological platform and the infrastructure.
An example of an information system’s technical structure with its hardware components:
- – laptop for sales reps;
- – desktop for production management team;
- – desktop for accountants;
- – desktop for HR department;
- – server to host the CRM software with remote access for sales reps;
- – intranet.
4.5. The information systems territory and the organization’s territory
Given that the representation of the organizational territory in return influences the organization’s actual territory, the territory of the organization’s information system is also influenced by this, given that it is part of the actual organizational territory.
4.5.1. The information systems territory and the hierarchical pyramid
If the organizational territory is charted by its hierarchical levels, the organization’s information system will tend to be structured on the same hierarchical levels, with specific informational content, functions, applications and hardware components at each hierarchical level.
Thus, the information will be structured into three levels: strategic planning, management control and operational management [ANT 65].
The hierarchical perspective recognizes that different types of business activities are performed at different levels of the organization by members with specific responsibilities. From the hierarchical point of view, three levels can be clearly identified:
- – the information system at the operational level integrates processing procedures and records transactions carried out by the workforce. These systems are known as the transactional processing system and focus on transaction automation;
- – the information system supporting the management level is known as the Decision Support System and provides core information to functional managers so that they are able to take mid-term policy decisions;
- – the information system supporting the Executive, known as the executive information system, frequently provides highly synthesized information on the company’s macro-activities, but with the potential to explore specific elements more deeply using aggregated data.

Figure 4.13. The information system supporting each level of the hierarchical pyramid
4.5.2. Information systems territory and functional silos
The functional approach proposes a management information system delivered to the functional manager, by instituting the idea that firms are organized by function, primarily around sales, marketing, production, HR and accounting. This will lead to the development of management information systems in silos, by function and, most often, “hermetically sealed”. From the functional point of view, the four main functions thus each have their own information system.
The sales and marketing information system collects data for the marketing managers from the markets in which the business operates. First of all, the information system collects transactional data linked to product sales to customers, according to the various distribution channels. This data can then help the various sales and marketing managers to understand the revenue and margins for each product, each customer and each distribution channel. The same data can also measure the sales reps’ performance in terms of revenue generated and sales activities of each rep. On a more “as-and-when” basis, this same data enables the company to evaluate the impact of specific one-off events, such as a marketing campaign or a product price increase. Market studies, meanwhile, aim to understand the reaction of potential customers to changes in the company’s offer in terms of marketing mix. Finally, competitive intelligence systematically analyzes the economic, social, demographic, legal and technological context to identify weak signals that give advance warning of possible risks and opportunities in the medium and long term for marketing and sales.
Production information systems support the manufacture of goods and services, the focus of the company’s core activity, through acquisition of raw materials and intermediate goods, setting production targets, production planning, organization of production workers and production plant maintenance. A crucial element in these production information systems is stock control of the components required for each finished product. This is known as material requirement planning (MRP). Extensions of MRP systems integrate the management of other corporate resources, not only components, such as machine production capacity and manpower availability. This means production can be steered more efficiently from sales forecasts. These systems become Manufacturing Resources Planning systems (MRP2 or MRP II).

Figure 4.14. Information systems supporting each functional silo
Accounting information systems track monetary transactions in order to produce accounting and financial statements for the various stakeholders, such as directors, shareholders, banks and tax authorities. Thus, their focus is on the automation of accounting records and the automatic translation of these records into the various output reports. The production of these documents is an essential feature of these information systems, with reports being customized for each type of stakeholder. While configuration work is needed at the outset to define the various reports required, the accounting information system is supposed to automatically produce these reports as per the defined needs (once set up). One-off statements can be produced, but development work is generally necessary. These information systems are also designed for use in connection with audit, governance, risk management and compliance.
HR management information systems handle the management of an organization’s employees. These systems record personal data for each employee, their posting and professional activities, and their performance appraisals. The main short-term objective is to facilitate payment of wages. The payroll function automates the process of collecting data on staff attendance and absence, and calculates the various taxes, social security contributions and other wage deductions in order to calculate the amount payable to each employee as per his employment contract. In the medium and the long terms, these information systems assist with managing the development of human capital in line with the strategic decisions of the organization. Thus, the functions available in the HR management information system include recruitment, staff planning and training.
4.5.3. Information systems territory and the hierarchical-functional pyramid
Studies on business structure have strongly influenced the classic perception of information systems, combining the functional approach with the hierarchical approach and creating from this a system to unite and align one hierarchical-functional territory [MIR 93]. The information system of this “classic” microeconomic model is known as a “management information system” (MIS). The MIS forms the link between the organizational functions and the hierarchical levels.

Figure 4.15. The MIS at the juncture of the theory of classic organizations and microeconomics
4.6. Information systems territory and systems engineering
A systemic vision of the organization allows us to break away from the hierarchical-functional approach and think of the information system as a whole, noting in particular the necessary and beneficial interactions between all stakeholders and all functions. The information system is in this case defined as an organizational information system (OIS) [MOR 99]. The OIS meets the need to model a system of uniting space and timescale. In an OIS, the three hierarchical levels are interconnected by interactional loops via a single operational-decision support information system. In an OIS, corporate timescales are also interrelated. Finally, the OIS can be seen as the information system of a business system integrating a range of processes.
Translating this systemic vision of the organization into an information system often takes the form of an integrated management software (IMS) package, enterprise information system (EIS) or enterprise resource planning (ERP).

Figure 4.16. The OIS as the combination of a range of processes
Historically, ERPs came into being as a gradual extension of the functionalities of MRPs, but nowadays these solutions go beyond the functional boundaries of production and build the OIS around the processes that cover the various organizational functions. In practical terms, an ERP is a modular, integrated software application that crosses organizational functions and hierarchical levels, relying on a single unique database in the logical sense. The modularity allows the organization to choose from the various modules available. Thus, all the company has to do is to activate them and use them to meet its needs. Then, integration enables automatic release of software developments that overlap the various modules and thus various functions and levels. These do, however, stay recorded in the ERP database. For example, the placing of an order by a client automatically triggers the issuing of an invoice, a finished products inventory, start of production, a raw materials order from the suppliers, assignment of commission to the sales rep responsible for that customer, etc. To conclude, the final key characteristic of an ERP, beyond modularity and integration, is its flexibility in configuration. ERPs have customizable settings so that the basic ERP can be adapted to suit each company.

Figure 4.17. The MIS at the juncture of the theory of classic organizations and microeconomics and the OIS at the juncture of systemic organizations and microeconomics
Table 4.2. Putting organizational and information systems territories into perspective (inspired by [BID 06])
| Source system | Organization | Information system | ||
| Territory | Of the firm | Of the information system | ||
| Economic theory | Microeconomics | |||
| Theory of organizational structure | Classic functional | Systemic process-driven | Classic functional | Systemic process-driven |
| Typology | Functional | Systemic | MIS | OIS |
| Elementary block | Function | Process | Business application | Module |
| Architecture | Functional by silo | Transversal by process | Independent applications | Modular |
| Benchmark document | Functional mapping | Business process mapping | Application mapping | Access mapping |
| Formalization | Procedure | Process | Program | Configuration |
| Interunitary distribution mechanisms | Hierarchy | Process manager | Deferred one-way flow interdependence | Real-time one-way flow automation |
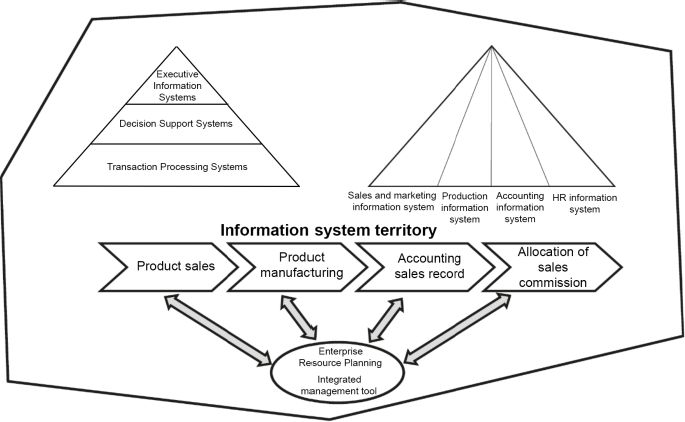
Figure 4.18. Information systems territory and its representations

Figure 4.19. The new actual information system territory must be integrated into the information system territorial representations
Although the systemic vision is often translated into an ERP, complementary initiatives flourish, with a vision of the business as a community of networked stakeholders: enterprise 2.0 [MCA 09]. This new organizational framework makes borders more permeable, and social networks, online communities, Wikis and other collaborative tools are recognized as collaborative spaces vital to the company’s success. This concept should promote greater cooperation between business functions, freer access to information, greater responsiveness and flexibility from the part of the business, more open communication, a more innovative culture and a less authoritarian and more collaborative leadership style.
Like existing influences between the organization’s real territory and the representations of the organizational territory, the information systems territory is influenced by its representations and the representations of the organization’s territory.
We find here the same kind of complexity of reciprocal influences between actual territories and charted territories, identified in relation to organizational territories, and their development in line with economic, societal and technological transformation.
4.7. Alignment between the firm’s territory and the information systems territory
However, the potential benefits of information systems for the organization can only become a reality for the organization if there is an alignment between the territory of the firm and the territory of the information system. Representations of the territories, both of the organization and the information system, are an important step to facilitate their alignment. For example, alignment can be formalized by the superposition of job mapping, according to the organizational chart, and user authorization mapping in the information system. These authorizations relate to permissions to access functionalities and data and the operational responsibility for viewing, modifying, printing, recording, deleting, sharing and validating data. This superposition allows potential areas of conflict to be flagged up. The company can then focus on making these coherent and on ways of resolving potential boundary conflicts [BID 06]. This territorial alignment is quite rare due to the diversity of stakeholders and the complexity of the processes [BID 06].


Figure 4.21. Alignment and influence between actual and charted territories of the organization and the information system
If stakeholders in the business defend a territory of the firm that is not aligned with the territory of the information system, or vice versa, risks emerge in the form of inefficiencies, conflicts and blockages in processes. If an organization, for example, is structured into functional departments (human resources, marketing and sales, production, accounting and finance), the implementation of an ERP can generate a misalignment between the firm’s territory and the information systems territory. The logic, by process, recorded in the ERP is not compatible with the organization’s functional silos, and thus conflicts may emerge at the boundaries between one function and another. This being the case, when a new information system is introduced, it is normally accompanied a project to align the territory of the firm with the new territory of the information system through business process re-engineering (BPR) [SRI 11].
4.8. Mapping the information systems territory
Representing a territory ultimately means mapping it. Mapping aims to represent a structured set of all the elements that contribute to information management. In order for this mapping to remain useful across space, for other interested parties such as project owners and project managers, and time, it is essential to map it in accordance with very specific modeling rules. Modeling allows us to analyze, understand and break down an often complex system in order to confine it to a set of finished objects that are measurable and controllable by all the stakeholders in the organization. The model must be a simplified representation of a real system in a precise perspective and a defined objective. Thus, a number of models are possible for the same reality, depending on the perspective and the objective. Mapping is therefore an element of common language for communication about the information system.
4.8.1. Process modeling
Modeling can be focused on a description of the business processes, in which case it is called process mapping. The term “business process” relates to the sequencing of actions and operations performed by the organization’s stakeholders in carrying out their business activities. Mapping business processes makes it easier to identify the events that trigger them, their progression and their alignment with corporate strategy. Business process modeling makes it possible to start a productive and valuable dialog between project owners and project managers.
4.8.2. Function modeling
Modeling can be focused on a description of the information systems functions, in which case it is a functional mapping of the information system. The word “function” refers to activities that are possible via the information system. Mapping the functions facilitates the identification of information needed to complete each activity and estimate the costs of goods and services carried out by that function. Functional modeling is the intermediate modeling between computing and business activities. The business activities are divided into unvarying areas. Each area is split into divisions. Each division is split into blocks. The blocks interact with each other through functional flows. Ultimately, functional modeling describes the complete set of areas, divisions and functional blocks.
4.8.3. Modeling the software
Modeling can be focused on the description of the information systems structure – focused on the IT system. This is an architectural mapping of the information system. The term “architecture” refers to the hardware and software components, their construction and their behavior within the information system and above all their interaction for the operation of the information system as a whole.
Software components relate to the applications installed on the technical infrastructure, and modeling requires identification of the information systems software applications and the information flow into and out of each application. This layer is the responsibility of the functional architects, and application mapping can in practice be translated by a single ERP-type software package, divided into modules like as many bricks in the information system.
4.8.4. Modeling the hardware
Hardware components relate to the technical infrastructure that supports the software applications. This is the lowest level of technical mapping of the information system. It updates the technological platform and infrastructure. This mapping makes it possible to view the information system’s hardware heritage, age, level of obsolescence and potential for improvement. At the heart of this approach, we have what we call the configuration management database (CMDB). This is a database that makes it possible to unify the components of a computerized information system. As such, it is a fundamental component, managed by the technical architects.
4.8.5. Modeling the informational content
Modeling can be focused on a description of the informational content, in which case it is called data mapping. The data in an informational system are basic descriptions of a reality. Data mapping makes it possible to identify what data exist in the information system, where they are and how they are handled.
4.8.6. Integrative modeling
Finally, some models seek to integrate the five focuses (business-driven, functional, application-driven, technical and informational) in a complementary fashion to achieve greater coherence in the description of the information system and to facilitate communications between the various parties involved.
| Cartographies | |
| Process mapping | Informational mapping of the information system |
| Functional mapping of the information system | |
| Mapping the software of the information system | |
| Mapping the hardware of the information system | |
Several model propositions exist. Some are focused on process modeling (e.g. Business Process Modeling Notation), others on functional modeling (e.g. Functional Flow Block Diagram), others again on architectural modeling (e.g. Acme) and finally, some focus on data modeling (e.g. Entity–Relationship Model). More and more propositions are seeking to include multiple levels of information systems modeling using integrative approaches (e.g. Unified Modeling Language).
Out of the few existing models, Unified Modeling Language, from Object Modeling Group3, is one of the most widely used, with its objective being to cover all information systems modeling requirements and in particular to integrate the five focuses (business-driven, functional, application-focused, technical and informational) in order to achieve greater consistency in the description of the information system and to facilitate communications between the various parties involved.

4.8.6.1. Process modeling
The activity diagram represents, in the form of a flowchart or activity sequencing chart, the behavior of a process, a system or its components. It can meet the needs of business process modeling. An activity diagram includes the following components:
- – a rounded rectangle representing an action;
- – a diamond representing a decision;
- – a bar representing a beginning (separation) or an end (conjunction) of concurrent activities;
- – a black dot representing the beginning of a process;
- – an outlined black dot representing the end of a process;
- – an arrow representing the direction of the link between components.
4.8.6.2. Function modeling
The class diagram represents the classes, the interfaces and the relationships between them. A class is a semantic collection of functions and attributes. In object-oriented programming, a class describes a set of objects called “instances of class”. In other words, classes are instantiated to create objects that contain their own values for each attribute of the class.
A class diagram can meet the requirements of modeling the information systems functions. A class diagram includes the following components:
- – a rectangle represents a class. It is divided into three parts comprising respectively:
- - the name of the class;
- - the attributes of the class;
- - the methods of the class;
- – an arc represents a relationship between two classes. Relationships can be through inheritance or through association. Inheritance is represented by a line linking the two classes, and their origin (parent class) is marked at the other end (subclass) by a triangle. Inheritance is a principle of division by generalization and specialization. Association is represented by a dash linking the two classes, plain in the case of a bidirectional association, with an arrow in the case of a monodirectional association, with a blank diamond in the case of an association of aggregation, with an infilled diamond in the case of an association of composition and with a dotted arrow in the case of an association of dependence. An association is a semantic connection between two classes (logical relationship).
4.8.6.3. Modeling information content
The class diagram can also be used to represent the informational content of an information system. Because a class is a set of functions and data, the class diagram can simultaneously be used to describe the functions and the informational content of an information system. When classes are instantiated to create objects, the objects created contain their own values for each attribute of the class to which they belong. Relationships between data are displayed with links of association.

4.8.6.4. Modeling the software
The component diagram represents the organization of the information system from the point of view of software structure. The software elements forming the information system’s software structure are called “modules”, whether they are packages, source files, libraries, executables, data in files (or databases) or configuration elements (parameters, scripts or batch files). All of these elements are interconnected by interface links explaining who uses what.
A component diagram includes the following components:
- – a rectangle (possibly with a small rectangle in the top right corner with two smaller rectangles extending out on the left) represents a component. A component is an independent unit and must provide a specific service. Its internal behavior is completely hidden in the component diagram and only its interfaces are visible;
- – a circle, linked to a component rectangle, represents an implemented interface;
- – a semi-circle, linked to a component rectangle, represents a required interface.

4.8.6.5. Modeling the hardware
The deployment diagram represents the use of the physical infrastructure for the components of the information system and the relationships between different resources. This deployment diagram is often used to model the technical structure of an information system. A deployment diagram includes the following elements:
- – a cube is a node, i.e. part of the physical infrastructure equipment such as a router, a computer and a personal assistant;
- – a rectangular box with two rectangles extending out of the left side is a component;
- – a plain line is a connection of association between elements;
- – a line with a blank arrowhead is a connection of dependency between components;
- – a rectangle is an artifact, which corresponds to a concrete element existing in the real world: a document, executable, file, database table and script.

4.9. Exercise: Linky and Enedis’ information systems territory
Linky is the name of the new meter developed by the French electricity distribution network administrator, Enedis. The rollout plan anticipates installation in all French households by 2021. This meter is considered to be a communicating or “smart” meter due to its ability to be interrogated and operated remotely. The communication is ensured by Power-Line Communication (PLC) technology, which makes it possible to build a telecommunication network on the power grid. This allows Enedis to replace manual meter readings, taken every six months, by automatic remote interrogation via PLC. Smart meters can also be remotely operated, which means activating a new subscription, changing the power rating, and also cutting off the electricity supply remotely and automatically.
There is a heated debate about Linky for various reasons [FLU 17]. Wikipedia’s discussion page on the Linky meter4 is a testament to this, as is the main page, which has been subjected to an editing war.
Here, what is of interest to us is the information that Linky is capable of transmitting, beyond basic electricity consumption, which makes us question the boundaries of the Enedis information system. In fact, this meter also transmits information on maximum apparent power output and input, and potentially also the load curve. In practical terms, this information gives information on the household’s usage of electrical appliances [SCH 14b]. The following is how members of Pièces et Main d’Oeuvre, a “workshop for the construction of critical thinking in Grenoble” [PIÈ 00], responded to notification of an upcoming Linky meter installation.
“For the attention of the Linky customer service manager:
Dear Sir,
We recently received an advertisement from EDF for the new Linky meter, together with your letter announcing the forthcoming installation of this meter at our premises by your local sub-contractor.
EDF’s customer liaison department sets out the ‘benefits’ of this meter for our electricity contract: remote readings ‘without a visit from the technician from the supplier, EDF’; a ‘fairer billing system’ based on the reading and not on an estimate, advice from EDF to help save energy thanks to ‘e.quilibre, EDF’s digital solution to help you better understand and reduce your electricity consumption’ – ‘if you have registered for this’. Thanks, but no thanks. None of these selling points is an advantage in our view. We prefer to deal with our fellow creatures rather than with machines. We believe that a world with contact is better to live in, more interesting, reassuring, human in a word, than the ‘remote’ world you are trying to impose on us. We have a brain, equipped with functions to sort out the practical details of life without electronic assistance. We have not registered for EDF’s ‘digital solution’, because we know how to reduce our electricity consumption. This is in any case low, and is reducing thanks to measures that we ourselves have decided on, without your so-called ‘smart’ meter. We do not want your service providers to poke their electronic nose into our private space. You do not need to know if we are in, and when, if there are more people here than usual, or any other changes in our habits. We do not want data relating to our private lives to be collected, by you, or anyone else”.
Here, we have a territorial conflict. With the rollout of these meters, Enedis is equipping itself with an information system that meters not only our monthly electricity consumption, but also provides knowledge about our usage patterns and consequently our behavior in our homes. It is as if the Enedis information systems territory now reaches every switch and socket in every home. Individuals see their personal, private territory eroded by Enedis’ potential surveillance of their behavior at home. The tension rises if we consider Enedis’ potential to sell the information gathered to other companies.
This kind of territorial conflict can, for example, be found on social networks, where the boundary between the staff, the public and the salesperson is very often challenged and is very contentious.
Test your skills
- 1) What is the historical boundary of Enedis’ territory towards its clients?
- 2) What changes is Linky bringing in terms of Enedis’ information systems territory?
- 3) What alignment is Enedis pursuing between the firm’s territory and the information systems territory?