The ESB Management Portal consumes data from the ESBExceptionDb database where the faults information is published. This data feeds several features in the portal.
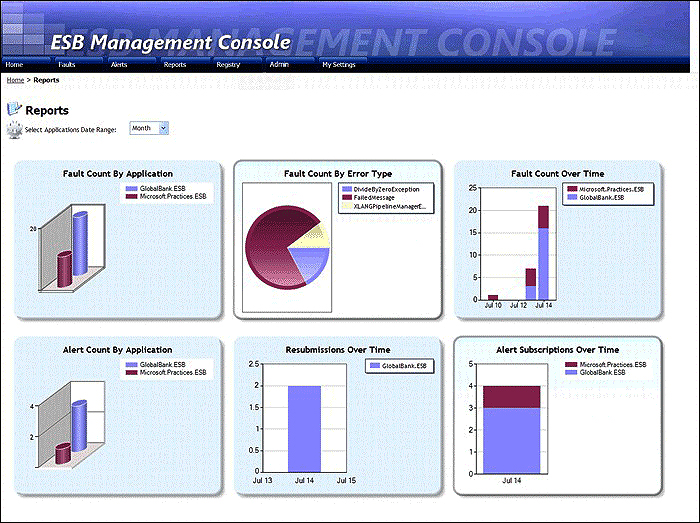
This module within the portal shows different reports about the faults that happened in our ESB. All the reports are accessible through the Reports link on the portal navigation bar, and can be filtered by application and by time range. The following reports listed are shown in the picture from left to right and from top to bottom:
- Fault Count By Application: This report displays an aggregate view of all the faults generated for a specified set of applications over a specified time. This report is also shown in the portal's home page.
- Fault Count By Error Type: This report displays an aggregate view of all faults by specified error type generated for a specified set of applications over a specified time. This report is also shown in the portal's home page.
- Fault Count Over Time: This report displays a count of faults over a specified period for a specified set of applications. You can select an application to display a trend chart showing the number of faults over time for specific services within the application. This report is also shown in the portal's home page.
- Alert Count By Application: This report displays an aggregate view of all the alerts generated for a specified set of applications over a specified time.
- Resubmissions Over Time: This report displays a count of failed message resubmissions over a specified period for a specified set of applications.
- Alert Subscriptions Over Time: This report displays a count of alert subscriptions over a specified period for a specified set of applications.
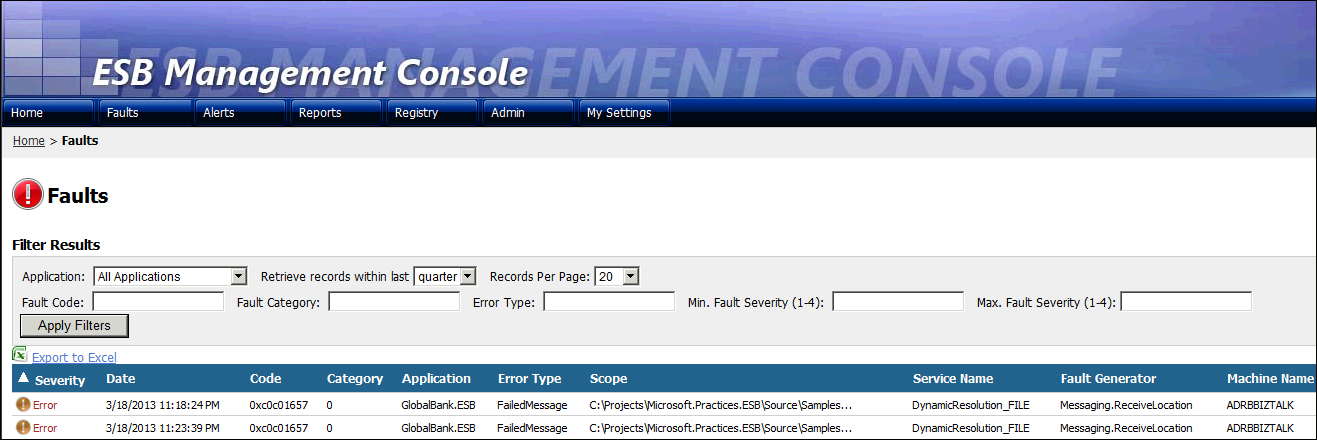
The faults list page shows the list of the faults that happened in our ESB. We can filter and sort the results to find the items that we are interested in, and we can even export the list to Excel.
By clicking on any of the line items, we access to the Fault Viewer, where we can inspect the data of the fault, and at the bottom we have links to the messages that were attached to the fault.
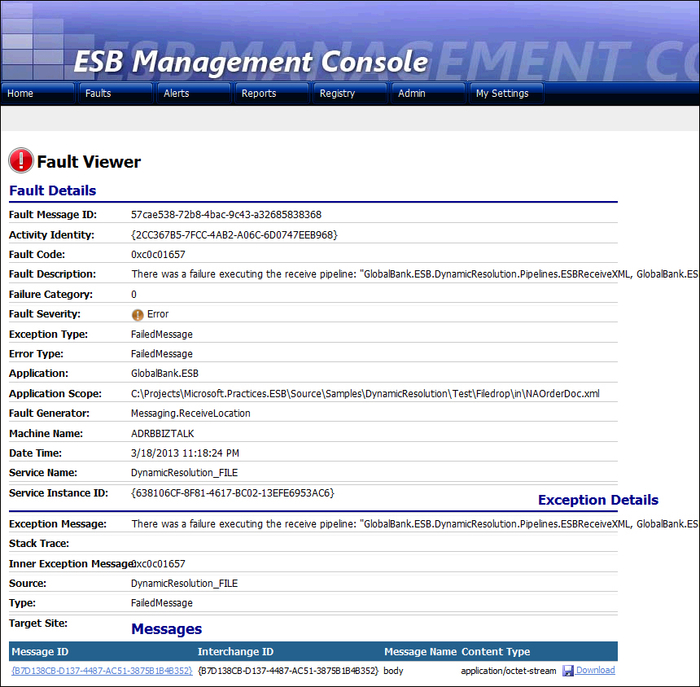
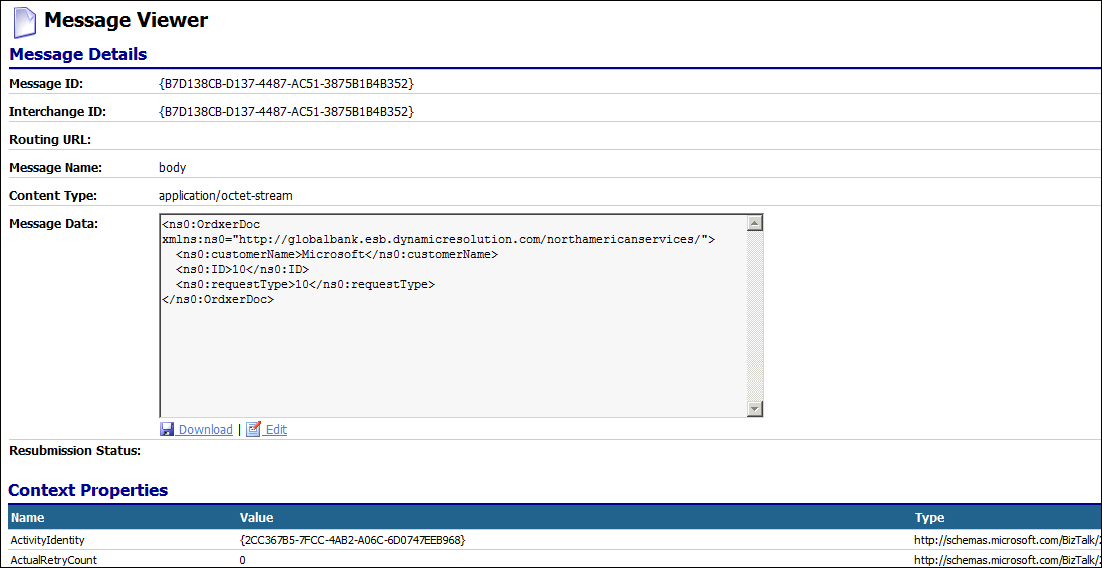
If we click on any of the attached messages links in the Fault Viewer, we access to the Message Viewer . On this page we can:
- Inspect the information of the message, including its contents and context properties
- Download the message
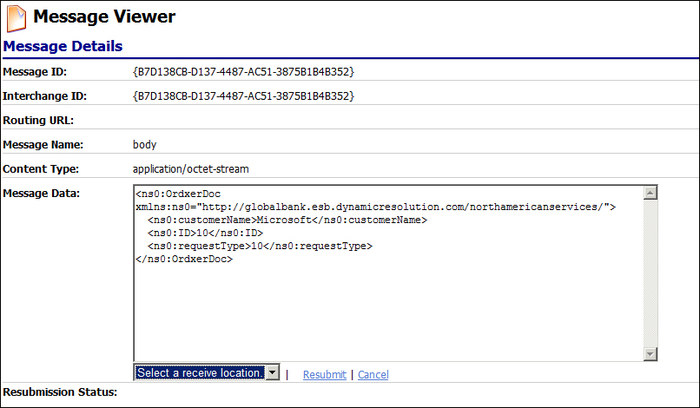
- Edit the message
By clicking on the Edit link, we are able to edit the contents of the message (for example, to correct some invalid data). Once we finish repairing our message, we can resubmit it directly to the ESB through two receive locations that are created when the ESB Toolkit is installed (or any custom receive locations we might create for resubmission).
A simplified view of this list is also shown in the portal's home page.
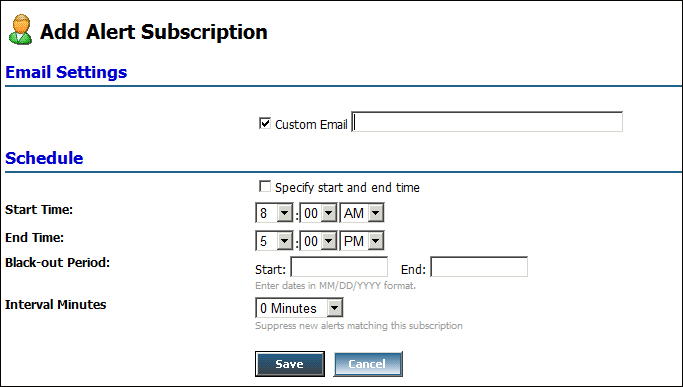
The ESB Toolkit has a feature to notify us when certain faults happen if we create an alert for them. On this page, we can view a list of the alerts that we created in the past or create new ones.
The alerts triggering criteria can be composed by logical conditions based on the fault fields.
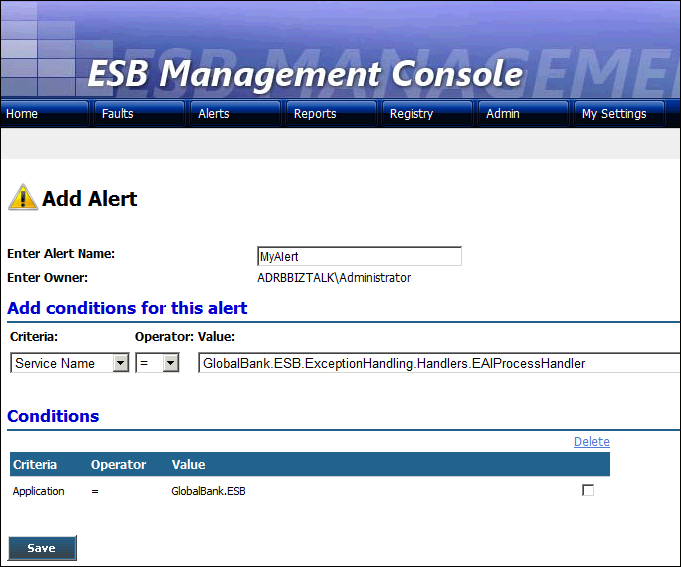
Once an alert is created, we can add subscribers to it. They will be notified, once the alert is triggered, on the specified e-mail address according to the schedule set on the subscription.