
Searching for Momentum and Strength
Fortune sides with him who dares.
—Virgil (70 BC–19 BC)
Roman poet
Strategy to Professional Status: Part IV—Phase 3
Aim: This is the second step in the technical analysis process to trading. Trend patterns have been recognized, momentum identified, and confirmed by strength indicators.
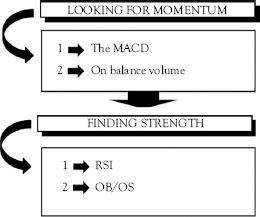
Looking for Momentum
The MACD
Definition: The letters MACD stand for moving average convergence divergence, and it is a technical oscillator that is based on a mathematical formula. It is effectively price movement aimed at overbought and oversold signals.
This signal is easily available on most software packages, but traders have to input their own moving average numbers, according to their personal strategies.
This indicator is an important analytical tool in the traders’ arsenal to help them to identify changes in overbought and oversold positions and acts as a warning signals that new trends could be about to happen, whether bullish or bearish. In the previous chapter, traders identified trend patterns. In this section, it is critical to know whether patterns are strong or could change. This is the reason why momentum indicators are used. Note that many professional traders prefer to use a combination of candlesticks, moving averages, and Relative Strength Index (RSI) instead of the MACD.
The question traders ask: if I buy a share today based on detected patterns, will the pattern last?
The most popular momentum indicator is the MACD, which is usually populated with three main numbers, namely:
• Number 1: Timeframe used to calculate the faster moving average.
• Number 2: Timeframe used to determine the slower moving average.
• Number 3: This is the number of bars that is used to calculate the moving average of the difference between the faster and slower moving averages.
It is important to note that the MACD line drawn is the difference between two exponential moving averages. In the following chart, the two moving averages are 21- and 50-day moving averages, respectively. The single line is the difference between these two averages.

Traditionally, when the MACD is below the origin (line 0), the share is considered to be oversold, and when it is above the origin, the share is considered to be overbought. The problem with using moving averages is that, as averages, they lack substance of the real price. They lag, and thus provide late signals. Yet, this is one of the tools favored most by many traders.
Volume
This signal is easily available on most software packages and is simple to implement. The reason traders use this indicator in addition to the MACD is simply to confirm an overbought or oversold situation, and also in this case, to determine whether such conditions will change the direction of the share.
Again, I must state that many professional traders use RSI in conjunction to the overbought and oversold indicator, rather than the MACD.
Trader’s Trigger
• Volume is increasing if the day’s closing price is higher than the previous day’s closing price.
• If the share closes at a lower price than the day before, volume is seen as flowing out.
Therefore, an upward trend is often a precursor to an increase in price. This is due to additional investors buying the share; thus, the volume of trades is increasing. Professional traders warn that changes in the trend should be seen over a period of longer than three days, or you may get false readings.
Finding Strength
Relative Strength Index (RSI)
Definition: The relative strength index (RSI), a technical indicator, is a price-following oscillator that ranges between 0 and 100.
This signal is easily available on most software packages, but traders have to input their own moving average numbers, according to their strategies. The popular input data is the nine-day and 25-day RSI indicators.
The question traders ask: now that I have identified a trend pattern and confirmed that there is momentum in the trend, is there enough strength for that trend to continue?
Trader’s Trigger
• Look for a divergence where the security is achieving a new high but the RSI is failing to a level that is lower than its previous high.
• This is an indication of a possible reversal.
• When the RSI turns down and falls below its most recent trough, it is said to have completed a failure swing.
• The failure swing is considered a confirmation of the impending reversal.
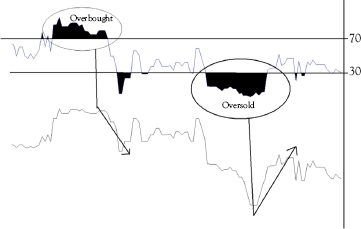
RSI is similar to the stochastic, in that it identifies overbought and oversold conditions in the market. It is also scaled from 0 to 100. Typically, readings below 30 indicate oversold, while readings over 70 indicate overbought.
• Tops and bottoms: The RSI usually tops 70 and bottoms below 30 before the share moves due to traders’ volume of trades reaching overbought or oversold situations.
• Divergences: These occur when the share price achieves a new high (or low), but that move is not confirmed by a new high (or low) in the RSI. The norm is for prices to correct and move in the direction of the RSI.
Overbought or Oversold
Definition: It is based on volume and shows the difference between the number of advancing (rising) and declining (falling) shares.
This is my favorite indicator and highlights how many traders are buying or selling the share at a defined period of time, so it, in effect, indicates interests in the market. The norm is that, when the share is considered to be oversold, it means that there are more sellers than buyers in the market. In economic terms, it can be said that supply exceeds demand. Normally, the share price falls to attract buyers in the market or share.