
No man should receive a dollar unless that dollar has been fairly earned.
—Theodore Roosevelt (1858–1919)
U.S. President
Strategy to Professional Status: Part IV—Phase 4
Aim: The final step is to understand that profits are higher when you time your trades. There are three forms of timing.

Three Steps to Timing
Determine Strength Of A Share
The easiest indicator to determine current strength is the Average Directional Index (ADX), which is easy to use, as it is an oscillator that fluctuates between 0 and 100.
• If the reading is less than 20, signals are that the trend is weak.
• If the reading is greater than 50, it signals strong trends.
Note that the ADX is an oscillator, but does not warn of trends that are bullish or bearish. I prefer this indicator—as a first step—to highlight the strength of the trend, as it is easy to interpret as it only measures the strength of the current trend.
Determining a Trend
Now that you have set out and found the share’s current strength, you want to know whether the company’s share price trend is strong enough to continue? To determine whether this is the case, use the stochastic oscillator to indicate whether the share is overbought, oversold or not. This indicator compares today’s price to a share’s high and low prices to create a range between zero and 100.
• When the stochastic lines are above 80, it means the market is overbought.
• When the Stochastic lines are below 20, it means that the market is oversold.
• As a rule of thumb, traders should buy when the market is oversold and sell when the market is overbought.
Future Price Strength
This indicator is not popular, but is one that can be of great assistance to traders. The Ichimoku Kinko Hyo (IKH) is an indicator that traders use to assess possible future price momentum with forecasted support and resistance levels.
The following is a basic explanation of IKH, but if you are interested in knowing more about this form of technical analysis, send me a request on [email protected]. The Japanese words Ichimoku Kinko Hyo tell it all, meaning “one glance cloud chart.” It consists of five lines, as follows:
• The standard line.
• The turning line.
• The delayed line.
• The first preceding span.
• The second preceding span.
Today’s point in the standard line is calculated for the past 26 days inclusive of today by the formula:
![]()
Turning Point Calculation
Similarly, the turning line is calculated for the past nine days (including today) by the following formula:
![]()
Delayed Line Calculation
• Use a spreadsheet to write down the values calculated using the preceding formulae.
• In the same spreadsheet, record today’s closing price for the past 26 days. This becomes a point in the delayed line.
First Preceding Line Calculation
This is calculated by using the standard and turning lines for the past 26 days (as set out earlier):
![]()
Second Preceding Line Calculation
The line is calculated from historical prices for the past 52 days:
![]()
Using a spreadsheet, chart all the aforementioned lines together with the closing share price, as follows:
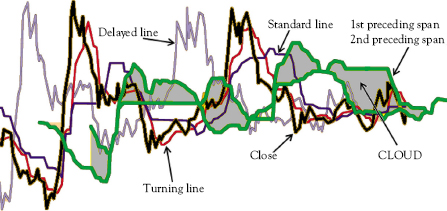
The IKH is combined with the closing share price line and the space between IKH line and share price line called the cloud. Traders use the lines that make up the cloud as support (lower line) and resistance (upper line) levels.
Trader’s Trigger
• When the price is within the cloud area, the market is not in any specific trend.
• When the price is above the cloud area, the higher span is the first support level and the lower span is the second support level.
While the IKH is brilliant to identify potential future price movements, it is extremely difficult to keep the information updated, for then, many shares identified in your watch list. If you look closely at the preceding formulae, there is a very close similarity to using the much easier moving averages. Using the same time spans as the IKH, use moving averages (nine and 26 days MA) as the IKH standard and turning lines.
Therefore, a traditional moving average technical indicator and the IKH standard or turning lines will give a similar result. As discussed in this book, a buy signal is triggered when the shorter-term MA crosses the longer-term MA going upward. A sell signals is triggered when the opposite takes place.
The preceding triggers also apply to IKH when quantifying market expectation over a specified time period.
Entry and Exit Points
The 3-2-1 Method
One of the most asked questions in trading is about pricing of shares. Do you buy securities at market, or do you try and get these at a discount to the current market value?
In a highly volatile and rapidly changing securities market, the answer is entirely up to you, your strategies, and your investment timeframe. The norm is that, the longer your trading timeframe is, the more time you have to buy the share. Conversely, the shorter your trading timeframe is, the quicker you want to get the stock.
My personal philosophy is:
• Short-term trades: Buy at a premium. If you need to get
the stock now, a market order will just place you at the end
of the electronic trading execution queue. By the time you get the stock, the price will have moved and you will have lost the deal. This is especially true in geared markets.
• Long-term traders: Use the 3-2-1 strategy, as follows:
![]() For the first three days, place your offer at a discount of 6 percent to market.
For the first three days, place your offer at a discount of 6 percent to market.
![]() If your offer has not been taken up, change your offer to 2 percent discount to market for the next two days.
If your offer has not been taken up, change your offer to 2 percent discount to market for the next two days.
![]() After this timeframe, change your offer to the price being offered by the market, called “at market”—for one day only.
After this timeframe, change your offer to the price being offered by the market, called “at market”—for one day only.
![]() If—after this time period—you still are being able to get the stock, move the offer to a 2 percent premium.
If—after this time period—you still are being able to get the stock, move the offer to a 2 percent premium.
Always have a stop loss or a trailing stop loss.
A stop loss is simply a level at which you feel comfortable in selling the share if it falls. If you think 10 percent is an acceptable loss, sell the security if it falls to this level. A trailing stop loss is the same strategy as the stop loss, except that the fall is based on the shares’ upward movement.
Example:
• A trader buys a share at 100 cents.
• He or she believes that a 10 percent loss is acceptable.
• The stop loss is, thus, 90 cents.
• Assume that the share rises to 130 cents.
• A stop loss would be triggered if the share fell from 130 cents to 90 cents.
• A trailing stop loss would be triggered if the share fell to 117 cents (10 percent of 130 cents).
Two strategies are important to note:
• The stop loss exit points have to be determined before you get into a trade.
• If the trailing stop loss is triggered, but your overall portfolio is still only marginally affected, consider holding the stock until it hits the stop loss.
• Take into account the costs of acquiring and selling the equity. For instance, if a share costs 100 cents, but securities’ tax and brokerage equals 5 percent, then the actual cost of the equity is 105 cents. However, assume that it will cost you an additional 5 percent in capital gains tax, and so on, then your actual cost of the share is 110 cents. You have to see the share rise by 10 percent before you break even.
Chapter 10 assesses the real need for traders to use technical triggers.