
CHAPTER 20
Problem, Data and Interpretation of Data
Statistical thinking will one day be as necessary for efficient citizenship as the ability to read and write
– H. G. Wells
SYNOPSIS
Understanding the importance of data, use of proper data in problem formulation, being knowledgeable on the pitfalls in problem formulation and collection of data and interpretation of data are extremely important. These aspects are explained with illustrative examples in this chapter. The understanding one should have on the role of statistics in the analysis of data is also explained with illustrative examples.
Thought routine: problem and data
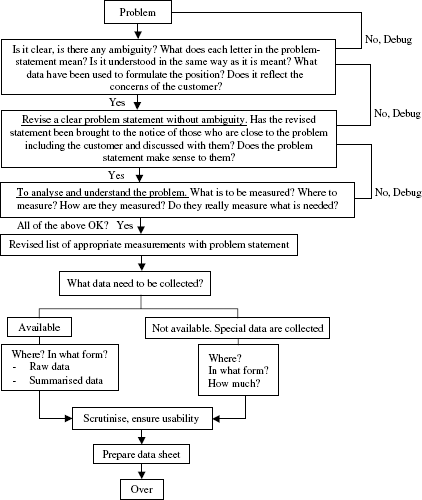
Whenever a problem is encountered, it has to be spelt out clearly and unambiguously besides quantitatively. It has to be noted that a problem well stated is half-solved. After the problem is stated, it has to be checked and verified for its clarity and unambiguity. It is better to check this point with resource persons not connected with the problem. In order to know the nature of the problem, magnitude of the problem appropriate data need to be collected. Details on data collection need to be finalised after ensuring that the data facilitates the ‘measurements’ related to the problem. Data may be available readily, if no special data has to be collected. If data is available, how that data is being used needs to be examined. This reflects the reasons for the prevalence of the problem. All these constitute the thought routine on problem and its data. These are explained in Figure 20.1.
Reality check: problem formulation
Five illustrative examples drawn from experience are given to indicate the type of pitfalls in problem formulation which have to be avoided through reality check. The first two examples highlight the point that at the problem formulation stage, the persons closest to the problem need to be consulted. The next two highlight the point that the problem needs to be closely scrutinised to decide on the appropriate data to be collected. The last one emphasises the need to know the process for restoring it back to normalcy.
Figure 20.1 Thought routine for data search
Example 1
In an exercise on cost reduction in utilities used in a coal mine, it was found from cost data that conveyor-belt consumption needed priority. Accordingly, the team took up the exercise, titled their project as ‘study of tear and wear of conveyor belts’ and planned data collection in the field. It chose a mine, selected certain sections which used conveyor belts; on a sample basis physically identified a dozen belts under use and took measurements such as thickness and width on them, informed the mine manager as well as section incharge about what had been done and also informed that the team would visit again to repeat the measurements on the same belts. Accordingly, the team returned and to its dismay none of the identified and marked belts were found. The team on checking with the operators found to its utter surprise and embarrassment their reply that belts do not tear and wear but get damaged and thrown out.
Example 2
In a ceramic factory manufacturing decorative crockery, the management found that the bottleneck to production of decorative ware was kilns. Accordingly, it took the decision to add four kilns to convert plain ware to decorative ware. Workmen of the section came to know of the decision. They met the general manager and informed him that there may not be any need for additional kilns and there is possibility of increasing the production with existing facility by reducing the idle time in kiln utilisation and also by improving the method of kiln loading and arranging the plain ware. Workmen offered to work on these issues under the guidance of a supervisor. The result was that the order for new kiln was limited to only one and not four.
Example 3
In a composite textile mill, several years ago, a study on weaving efficiency was taken up. Over a period of 1 month, elaborate data on weaving efficiency, loss of efficiency due to different causes were collected, analysed and the report was submitted to the chief of the organisation.
The chief called for a meeting of the weaving master and the author of the report. The meeting lasted only for 2 min with the chief telling the weaving master that the weaving efficiency is low and the due date for extending the terms of his appointment is only 4 weeks away. With this the weaving master got the right message. The chief who was two decades elder to the author of the report told him as a piece of advice “Data are important, certain improvements can be achieved through ‘Banging’, ‘Banging statistics’ must be put to use first and then other issues need to be taken up”. ‘Banging Statistics’ are the facts and figures which can straight away be used to alert and pressurise to control and improve. At the end of 2 weeks, another review was made. True to the expectation of the chief, ‘banging statistics’ had worked. The weaving efficiency which was low at 70 per cent had increased to 80 per cent. The chief complemented the weaving master and directed him to study the causes of low efficiency found in the investigation report and take suitable measures.
Example 4
This is related to a manual operation of adjusting the tension in springs. Twelve operators were involved in this exercise. The rework rate due to improper adjustment was about 8 per cent.
The persons who took up this problem were well versed in the use of statistical techniques. Investigation was taken up. They collected the data on spring tension from 10 samples from each operator and subjected the data for analysis by ANOVA. They found that the variation in spring tension in each operator was ‘high’ and there was no difference between the operators; and came out with the suggestion that each operator has to improve the skill to minimise variation. The results were discussed with the section incharge.
Two weeks later, he reported that rework on springs due to improper tension can touch ‘zero level’. All he did was to categorise the operators as ‘best’, ‘better’, ‘average’, ‘poor’ on the basis of the rework rate: best below 1 per cent, better 1–2 per cent, average 2.1–5.0 per cent and poor >5.0 per cent monitor. Performance of each operator was monitored. Freedom was accorded to watch how the best performers do their job. Likewise ‘worst’ ones were also observed. This enabled the individual operators to improve their own skills. The result was each operator moved towards the “best” level.
The above example illustrates the (mis)use of an advanced technique like ANOVA when, in fact, more simple and straight forward techniques are available. This tendency arises out of a desire to render the task of problem solving more ‘sophisticated and profound’ through the use of advanced techniques which is analogous to prescribing costly medicines when simple versions would serve the purpose. This desire to force-fit a technique to appear sophisticated termed as ‘Sophisticated Syndrome’ is on the rise with the advent of Six Sigma, green and black belts. Remedy for this syndrome lies in understanding the problem in all its details and then determining the appropriate techniques starting from the simple ones.
Example 5
The overall rework in a certain soldering operation consisting of 10 operators was 1 per cent. One week was spent on collecting the soldering defect cause-wise and operator-wise. The data showed that rework was 5 per cent in the case of one operator, about 1 per cent each in the case of five and zero in the remaining four.
On examination, it was found that
- The one with 5 per cent had only ‘four fingers’ in his right hand impairing the skill.
- The soldering device and work arrangement were not proper in the case of the four each with 1 per cent rework.
- Absence of the type of deficiency stated in (1) and (2) in the case of each of the four with ‘zero’ was observed.
Based on the findings, actions were taken and the rework touched almost zero. When the study report was discussed, there was satisfaction about the findings and results besides the strong feeling that such studies can be avoided by keeping the processes neat, clean and disciplined. “Should data be collected to discover an operator with four fingers?” was the humorous disdain with which the study was perceived.
The pertinent points to be noted from these examples are:
- At the start, understand the nature of the problem before planning to collect data.
- Assess the nature of the actions from a ‘technical’ point of view.
- Obtain data and get confirmation that the data justify the actions.
- Use simple techniques such as stratification and charting first.
- After steps (1) to (4) go into deeper diagnosis and analysis.
These five steps are, in fact, applied by doctors on any patient and if these do not yield results, further investigations are taken up.
A digression—reference to research in neurology on data
There is a well recognised fact in the field of neurology that most of the neurological syndromes which have stood the test of time were in fact discovered on the basis of a careful study of single cases followed by their authentication by repeated observations in other patients; and not by averaging of results in a large sample. Availability of a large sample on a neurological syndrome is also difficult. This view point can be remembered and being aware of it is more relevant to other areas also as defect rate in many are 10 ppm or less.
Types of data and summarisation of data
It has been noted in Chapter 12 that quality characteristics fall into two categories, measurable and attribute. Accordingly, data also fall into two categories—measurable (variable) and attribute (counting/classification).
It is a common practice to summarise the data and condense it into a few entities to convey the message from the data. In Chapter 19, the tools of arrangement of data are dealt to identify patterns to get the ‘message’. Here, certain calculations are to be applied to the data to get the message. These are furnished in Table 20.1.
Illustration: measurement of data
For the measurement of data, the method of obtaining average and standard deviation is given in Annexure 20A.
Illustration: attribute data
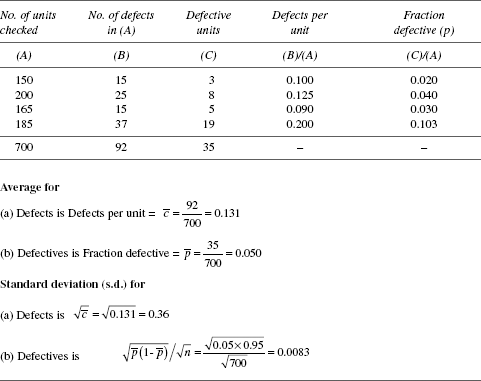
For the data represented here, the method of arriving at the average and standard deviation are shown in Table 20.2.
TABLE 20.1 Data Summarisation Through Calculation
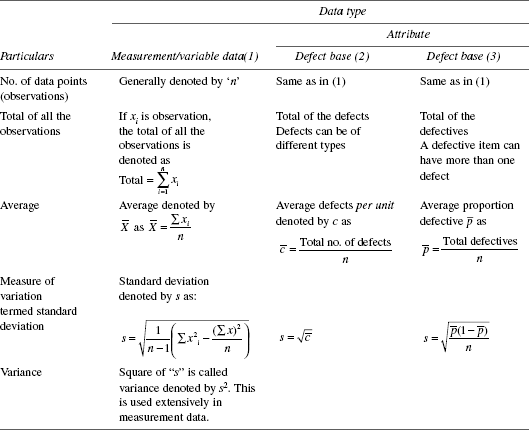
TABLE 20.2 Attribute Data—Average and Standard Deviation
Following points supplement the information in Tables 20.1 and 20.2.
- Presence of even one defect in an item makes it a defective one.
- A defective item can have more than one defect.
- Total number of defects found in a set of items can be more than the number of items in the set. For example, if 10 items are inspected, it can have more than 10 defects. Hence, for assessment of defect level, defects per unit (
 ) is a valid measure, not percentage is defined in Table 20.1.
 - Total number of defectives found in a set of items cannot exceed the number of items in the set. For example, if 10 items are inspected, the number of defectives cannot be more than 10. Hence, for assessment of defective level, per cent defectives (
 × 100) is a valid measure. is defined in Table 20.1.
 - Defectives get eliminated when defects are zero. When defectives are a problem, the focus of an improvement exercise needs to be in defect elimination.
- Defects are of different types (opportunities of defects). Hence, defect elimination needs to be focused on the types of defects found to be major/dominant ones among the different types of defects. To assess the dominant types, database on type-wise categorisation of defects is of fundamental importance in defect prevention studies.
Investigation
The path of investigation is shown in Figure 20.2.
Figure 20.2 Investigation phases
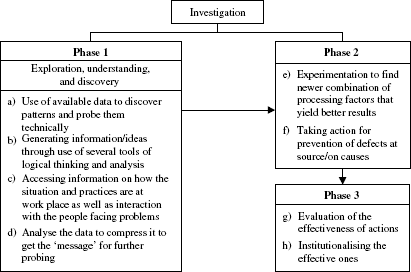
If it can be known that the favourable or unfavourable response is not due to chance but due to special causes (these need to be probed and found), it is worth looking for these special causes. Use of statistical techniques helps to answer the question related to ‘chance’ and ‘special’ and thus give added strength to the investigation process. Similar logic holds good in the case of (e) and (g) of phases 2 and 3, respectively, in Figure 20.2.
Statistical linkage to investigation
In the investigation phases—step (d) in phase 1, (e) in phase 2 and (g) in phase 3 need statistical justification for accepting (i) the message in case of (d), (ii) newer combination of processing factors in case of (e) and (iii) the effectiveness of a decision taken in case of (g). The following example related to (d) illustrates the point.
Data on yield available in process records was analysed to assess average yield and week-wise variation over 4 weeks. Weekly results are as follows. What is the message from the available data hereunder? Message based on common sense and its intervention through statistical logic is in Table 20.3.
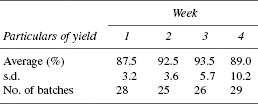
TABLE 20.3 Message Based on Common Sense and its Intervention Through Statistical Logic
| Message based on common sense | Statistical intervention to common sense message |
|---|---|
i) Observed increase in yield from 87.5 in week 1 to 93.5 in week 3 is real and the causes for such change is probed |
a) In the first case, variation associated with 93.5 is more than the one that is associated with 87.5. Similar observation holds good for the second case also |
ii) Drop in yield from 93.5 in week 3 to 89.0 in week 4 is real and the causes for such a change is probed |
b) The observed difference is to be weighed against the variation (s.d.) in yield to assess whether the difference in yield is explained in terms of variation due to ‘chance’ (common causes) or ‘special causes’. If the difference is due to common causes, the change—increase or decrease—represented by the difference is not real |
Regarding experimentation, it has to be stated that while choosing the key factors that affect the response from among the several available and selecting the levels of each of the key factors, decision on a technical basis; planning experiments as well as analysis of data obtained from experiments strictly belong to the domain of statistical methodology. This is the subject matter of Chapter 25.
Data on results and data on process
In the context of investigation it is relevant to know the importance of data on results and process. Data on results of a process as well as on process itself are necessary in any process improvement study. Data on results are measurements made at the end of a process like its yield, recovery, rejection, consumption of utilities, utilisation etc. Such data are generally available and they measure process efficiency / results.
In contrast to this there exists data on process parameters like speed, rate of addition, concentration, temperature, pressure etc which measure how the process operates. Such data on process are generally available in a processing operation and/ or where such data have to be maintained as per mandate/ rule. Data on process are similar to the on-line-monitoring of measurements on parametres of cardiac condition of a patient in intensive care unit. Action on these parameters of cardiac condition (how process operates) impacts the patient and improves his well-being which is the end result of cardiac treatment. Likewise, there are monitoring devices to reflect the improvement made in skill, technique, stamina, concentration in a sports person after undergoing coaching sessions-parameters that go to make a good sports person. Review and action on these parameters enhances the end result, achieving a certain goal/target.
Thus the point to be noted is that data on end-of-the-process need to be examined to judge the need for measurements on the process and such data need to be collected and acted upon to achieve the desired result. These two aspects of process measurements- at the end of the process and on the process- are explained through a case example in Chapter 27.
Statistical techniques
Simple techniques of statistical analysis which provide an answer to the question whether a result is due to chance or a special cause are given in Chapters 23 to 25. They cover measurement as well as attribute data.
There are a number of software packages on statistical analysis and they need to be used to save time and effort. But the vigour and thrust to improve a project, enriching one’s intuition and insight to probe into a problem, etc., should be done not through the use of the software packages but through one’s understanding of the statistical logic and its significance, skill for seeking patterns, flair for figures, etc. The probing skills need to be developed. Consistent and active involvement in problem solving bring forth the data based on probing skills.
Measuring devices are used to collect data and to decide on product acceptance. Hence, quality aspects of measuring instruments and devices are important and one dealing with continual improvement tasks has to be aware of the quality of measuring instruments and devices. This aspect is dealt extensively in Chapter 21.
Interpretation of data: a few illustrations
Interpretation of results of the analysis of data can be described as follows:
Interpretation = Points arising out of the analysis of data
+ technical knowledge associated with data
+ intuition (optional)
Misinterpretation is the result of ignoring these linkages. One should guard against misinterpretation. A knowledge of the types of common misinterpretations helps in arriving at correct interpretation. The following examples illustrate the point.
- A six footer got drowned as he crossed the river even after he had ensured earlier that the average depth was only 5 feet!
- A doctor in the labour room got a slap from the mother-to-be when the doctor, on knowing that the patient has come for her third delivery, remarked (intended to be a humour) that every third child born in the world is a Chinese.
- While on a walk, a father and his little son met an old friend of the father. After exchanging the pleasantries the friend looked at the child and remarked to the father that he is looking just like his son! Factually correct but technically wrong.
- Water is the common medium that mixes well with all the hot drinks. One common effect observed on taking any hot drink is intoxication. Hence concluding that the common effect of intoxication is due to the common medium—water, is a case of a fact being logically correct but technically wrong.
- It is observed that 70 per cent of the people aged above 70 travel in cars. A car manufacturer advertises, buy this brand of car and live longer. A case of pseudo correlation.
- No emphasis was given on family planning in India during the first two 5-year plans. This was on the assumption that the Indian society like its western counterpart would also automatically take to family planning in order to maintain the standard of living ushered through 5-year plans.
Five-year plans did usher in benefits but the society also expanded. Result: standard of living did not improve. Reason: the strong social belief that the God who bestows children also protects, was ignored but the ‘borrowed’ assumption already stated was relied upon.
- Comparing ‘apple with oranges’ is a common misinterpretation.
It is illustrated as under.
Particulars Data a) Lunch and dinner prepared (ave/day)
2500 b) No. of patients (ave/day)
800 From this data, the average number of lunches and dinners that should have been prepared per day is 1600 [800 × (1 lunch + 1 dinner)]. But the actual number prepared is 2500. Hence, on an average excess of 900 lunches and dinners are prepared.
Is this conclusion valid? This has to be looked into and here lies the value of interpretation and merit of understanding the data properly. Details are as follows:
Data on lunches and dinner are from the dietary section.
Data on the number of patients per day are collected by the nursing section. In a hospital where there are constant admissions and discharges, how was the data on number of patients in a day obtained? This question when posed to the nursing chief brought forth the reply that the data are collected through the midnight census when there are practically no admission or discharges. The pertinent point to note is that one should know all the details about how the data are obtained.
Coming to interpretation, it was pointed out that the figure 1600 derived from 800 is not comparable with the figure 2500, because they are obtained on a totally different basis. Hence, the rule, apples and oranges cannot be compared.
In interpreting, the environmental situation also plays a key role. In this case, it was noted that the patients got admitted in time to have their lunch and got discharged after having their dinner. Thus, it was shown that there was no excess preparation of lunch or dinner. This example is from an actual case handled by one of the authors in a large hospital.
- ‘100 per cent success’—beware; percentage, be cautious.
Institution Per cent success A
B100%
80%When it comes to percentage ask the question ‘Per cent of how many?’ This question brings out the fallacy, if any. In this example, in case of A, it was 100 per cent of 3 and in B it was 80 per cent of 300.
- Children are darlings of their parents no matter what their physical appearance are. But such an inference in the reverse order is not tenable.
- The number of cigarette smokers as well as number of cigarettes smoked are virtually stagnant for the past 20 years in India. The number of cigarettes sold in the country was 95 billion in 1985 and it is the same even in 2005. By this, it is concluded that tobacco consumption has dropped in the country. Is this tenable? This again is a case of comparing apples with oranges—cigarette selling and tobacco consumption. Cigarette is only one of the products where tobacco is used. But tobacco consumption is in diverse forms in addition to cigarettes. On the cigarette front, consumption has dropped. It may not be so for other forms of tobacco consumption.
- On the basis of the following data on purity of a chemical (%) 95.00, 95.45, 96.00, 94.48 and 85.10, it was reported that the average purity was 93.10. The figure was challenged and disputed. Then the basic readings on which the average was computed were examined. It revealed an ‘outlier’ that merited re-check. Therefore, it is necessary to scrutinise the basic data to check for ‘outliers’ and cross-check them before establishing its veracity.
- Histogram on any measurement when presented as a frequency distribution can exhibit it as follows: peaks and valleys as shown hereunder.
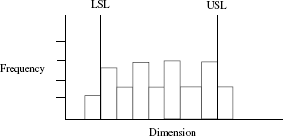
Such a case reflects the use of an instrument not fit for the measured item.
- Approximately, 99.9 per cent of the population die in bed. Therefore, do not sleep in bed to avoid death! It is observed that this type of logic is often advanced. When a certain facility/privilege is found to be misused, the thought is to abolish such a privilege/facility and not to prevent their misuse.
Data: a macro view
Today, right to information has been enacted as a law; emphasis is on e-governance having transparency, speed and instantaneous information as its cardinal principles on the status of a case. All these need database. Data is needed to formulate correct policy and bring about appropriate reforms. Such a data system is not available in every sector of governance: legislature, judiciary and executive. India has one of the best statistical systems in the world to collect and correlate data on many sectors of society at the national level. But every sector is yet to give such an account. For example, Rajeev Dhawan in his article ‘Figuring out the Judiciary’ (The Hindu 06 August 2004) laments ‘unfortunately, judicial reforms in India are based on intuition and ideas, not on data’. Hence, the focus needs to be on providing database and also on validating the intuition and ideas through data so that the actions proposed ensure that they achieve their set objectives.
Conclusion
While handling data, the following two disciplines that need to be kept in view:
- The conjecture, intuition about the cause/source of a defect should be reflected in the data. If it does not, data should not be manipulated to reflect it.
- Statistical tools and techniques of analysis are important and they have their important role. This aspect cannot over-shadow the ability to ask good questions, recognise patterns, trends and challenge assumptions; in short, creative thinking.
Statistical techniques related to analysis of data as well as of design and analysis of industrial experiments relevant to investigation of a problem as well as improvement studies are covered in next Section E. Statistical aspects of a measurement system are also covered.
Annexure 20A
Calculation of setting value s.d. and process capability from frequency distribution
Data on thickness of metal strip (mm)
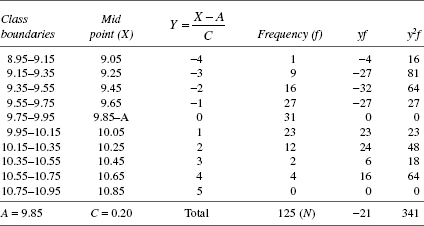
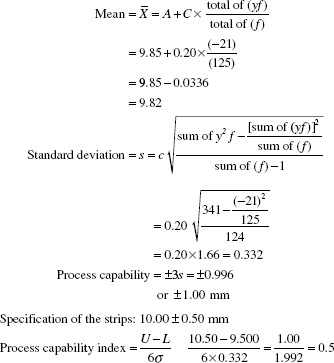
Process is far too inferior to comply with the thickness requirement of 10.00 ± 0.50 mm.