X-Pack provides cluster functionalities that allows to control and monitor your nodes and cluster. This is a very useful component of X-Pack as it is the lifesaver on large installations.
You need an up-and-running Elasticsearch installation as we described in the Downloading and installing Elasticsearch recipe in Chapter 2, Downloading and Setup.
You also need a functional Kibana installation as described in the Installing Kibana and X-Pack recipe.
To use X-Pack Elasticsearch monitor, we will perform the following steps:
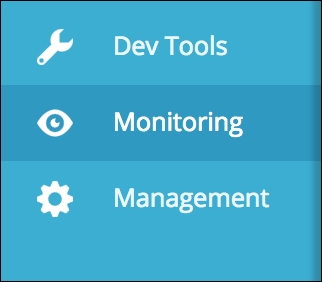
- We access the Monitoring section of Kibana as shown in the following screenshot:
- In the main page, you can access the different sections on monitoring applications as shown in the following screenshot:
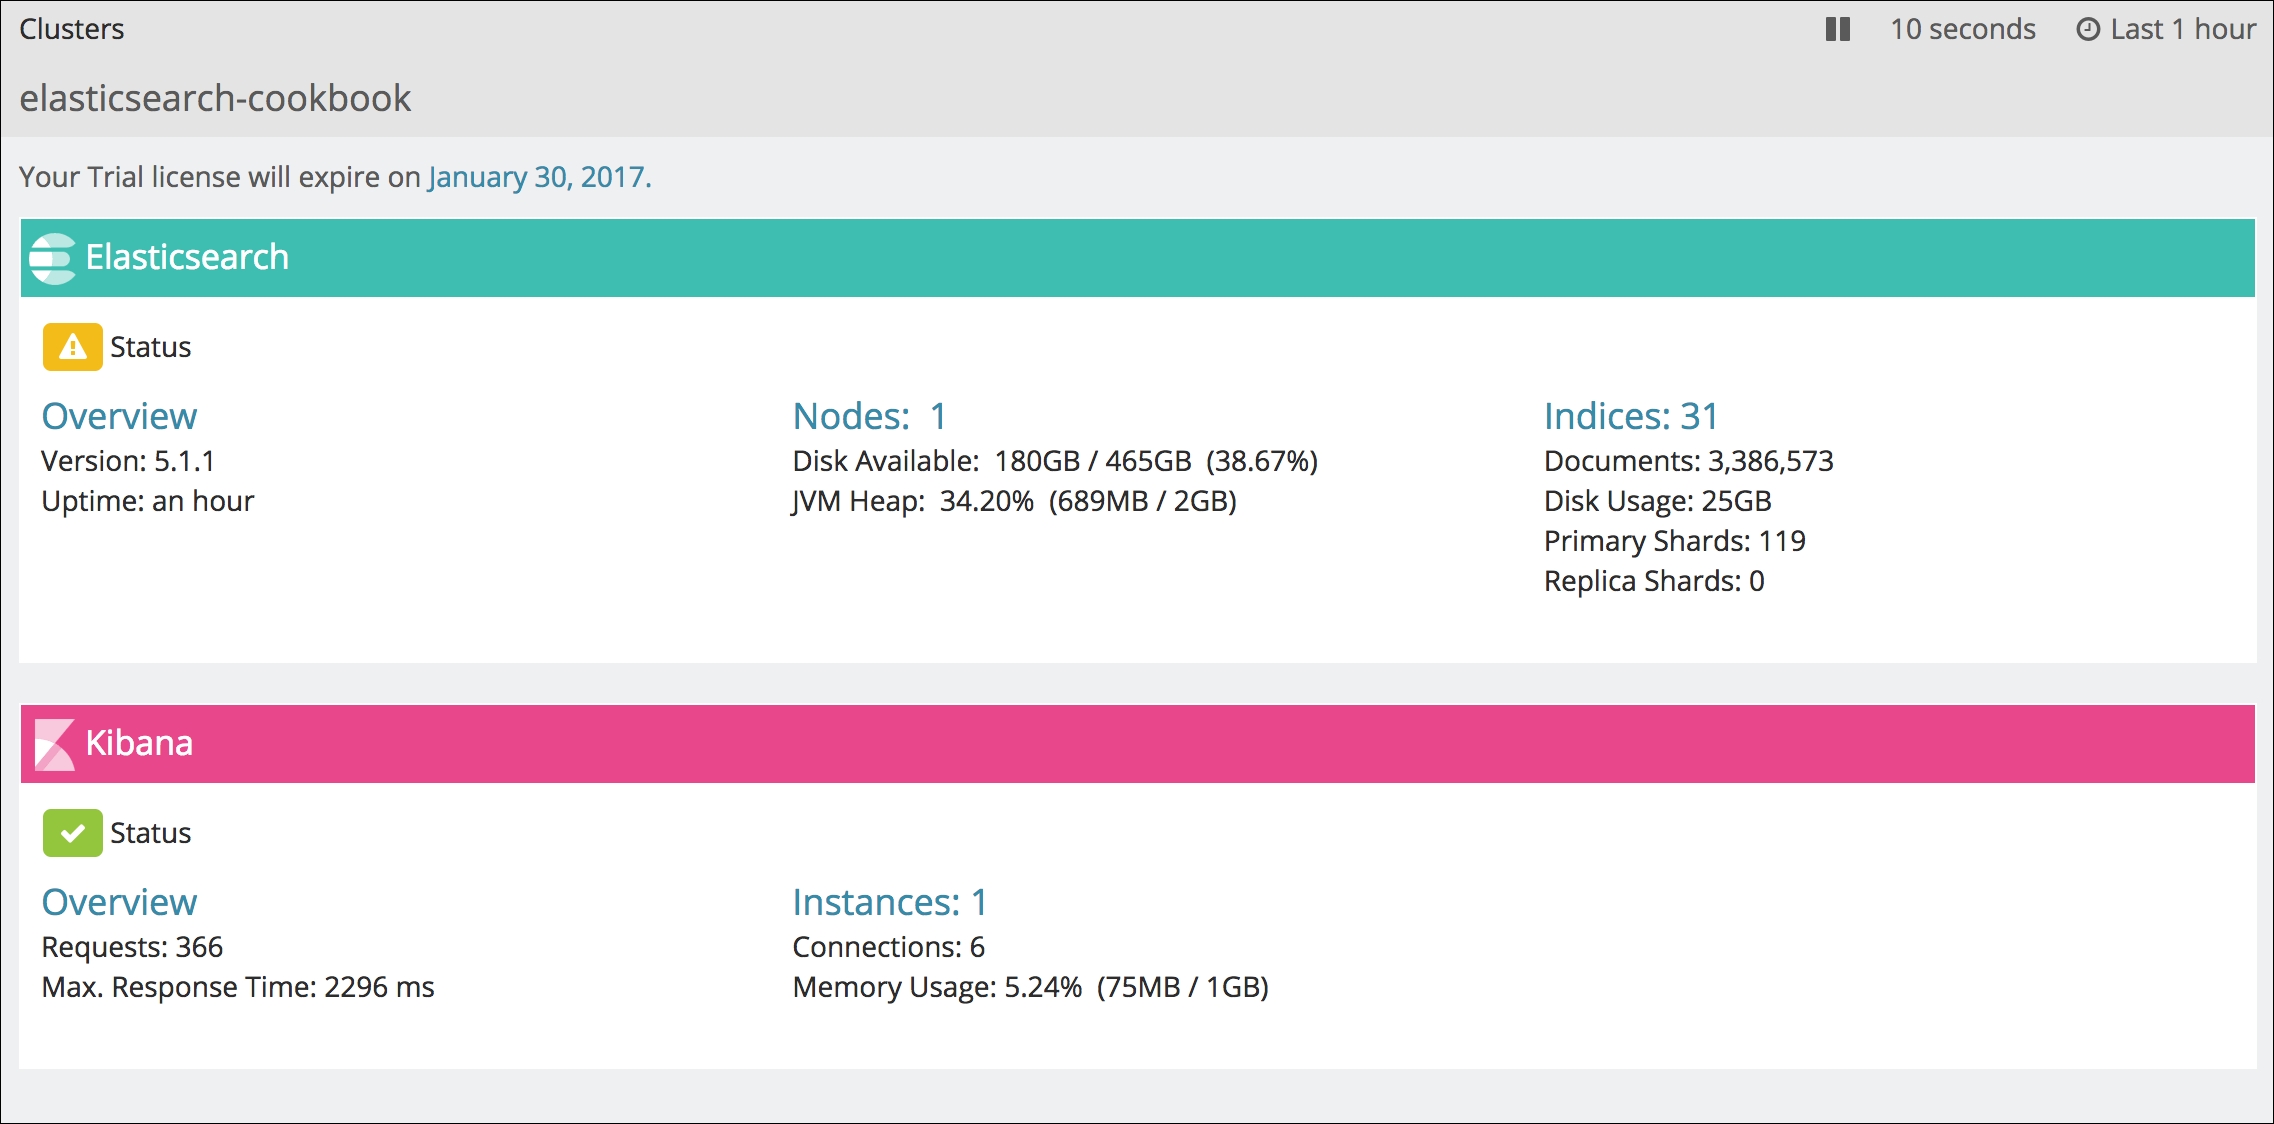
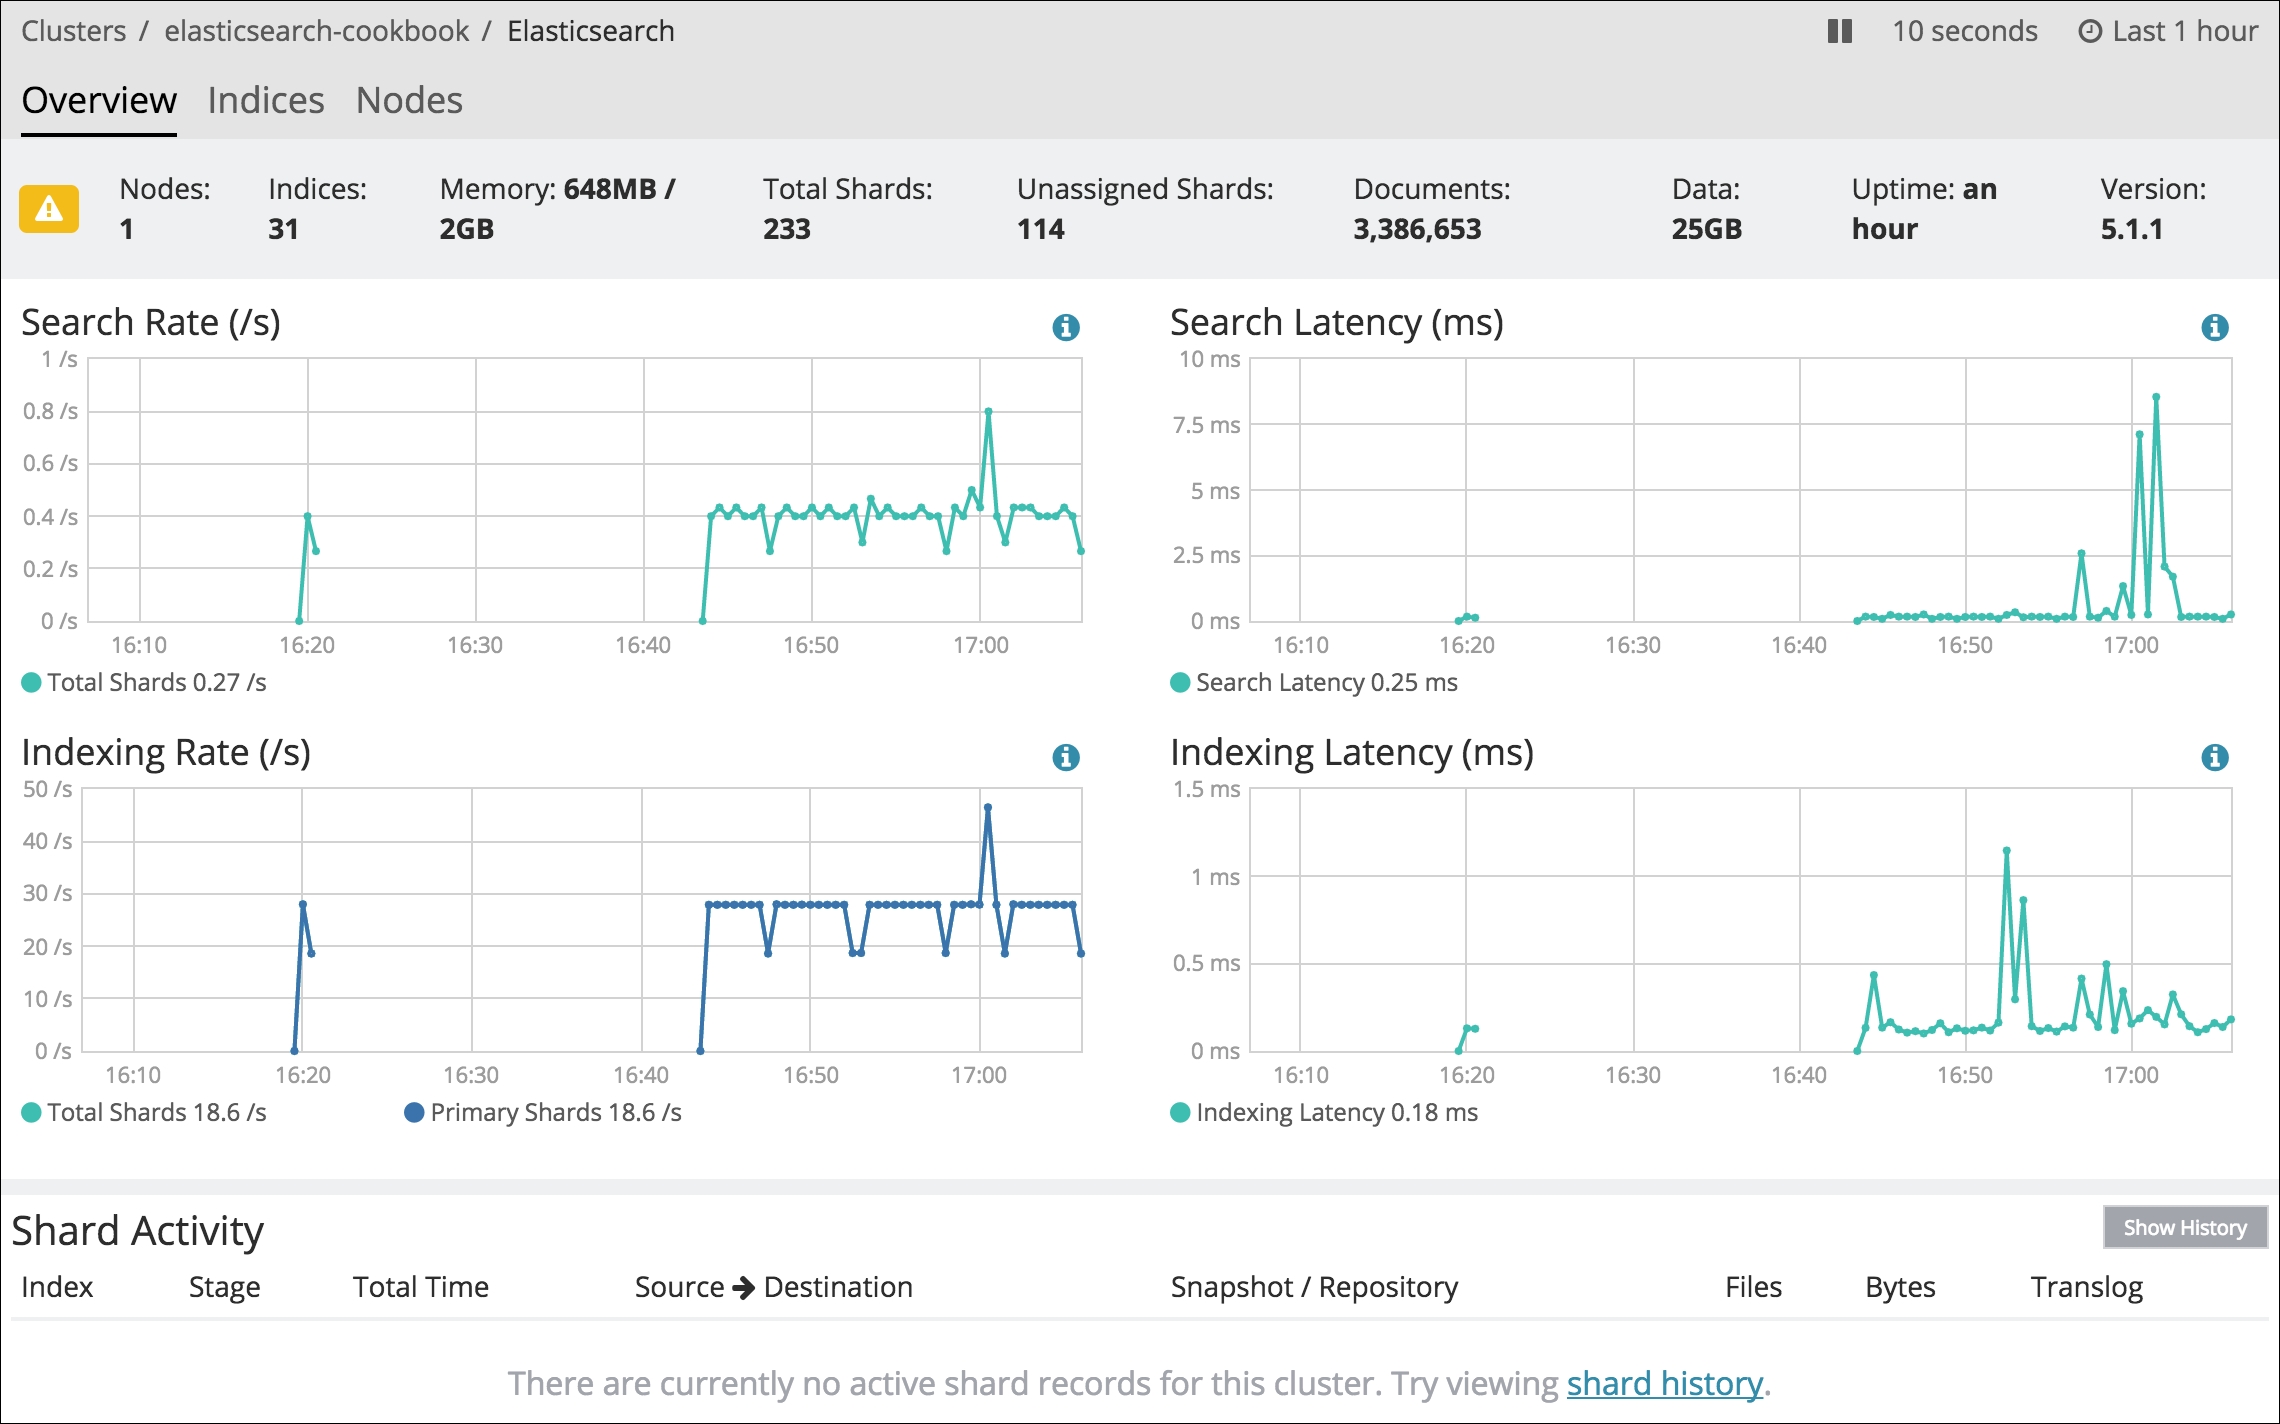
- If you click on the Overview cluster, you are able to see global cluster status and statistics as shown in the following screenshot:
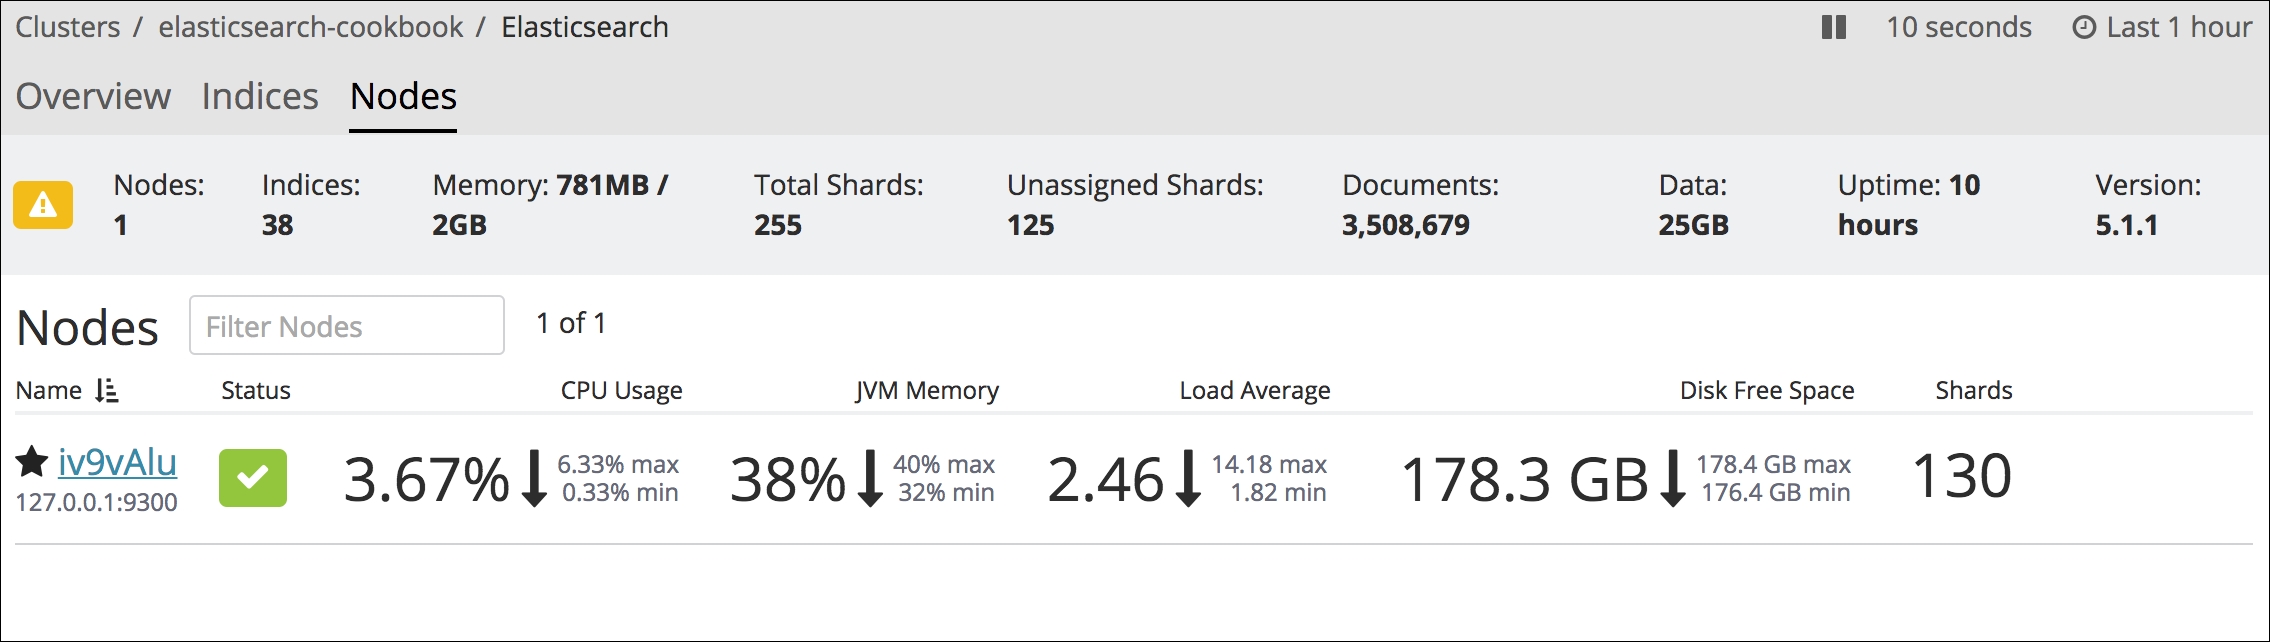
- If you click on the Nodes cluster, you are able to see the node's status and statistics as shown in the following screenshot:
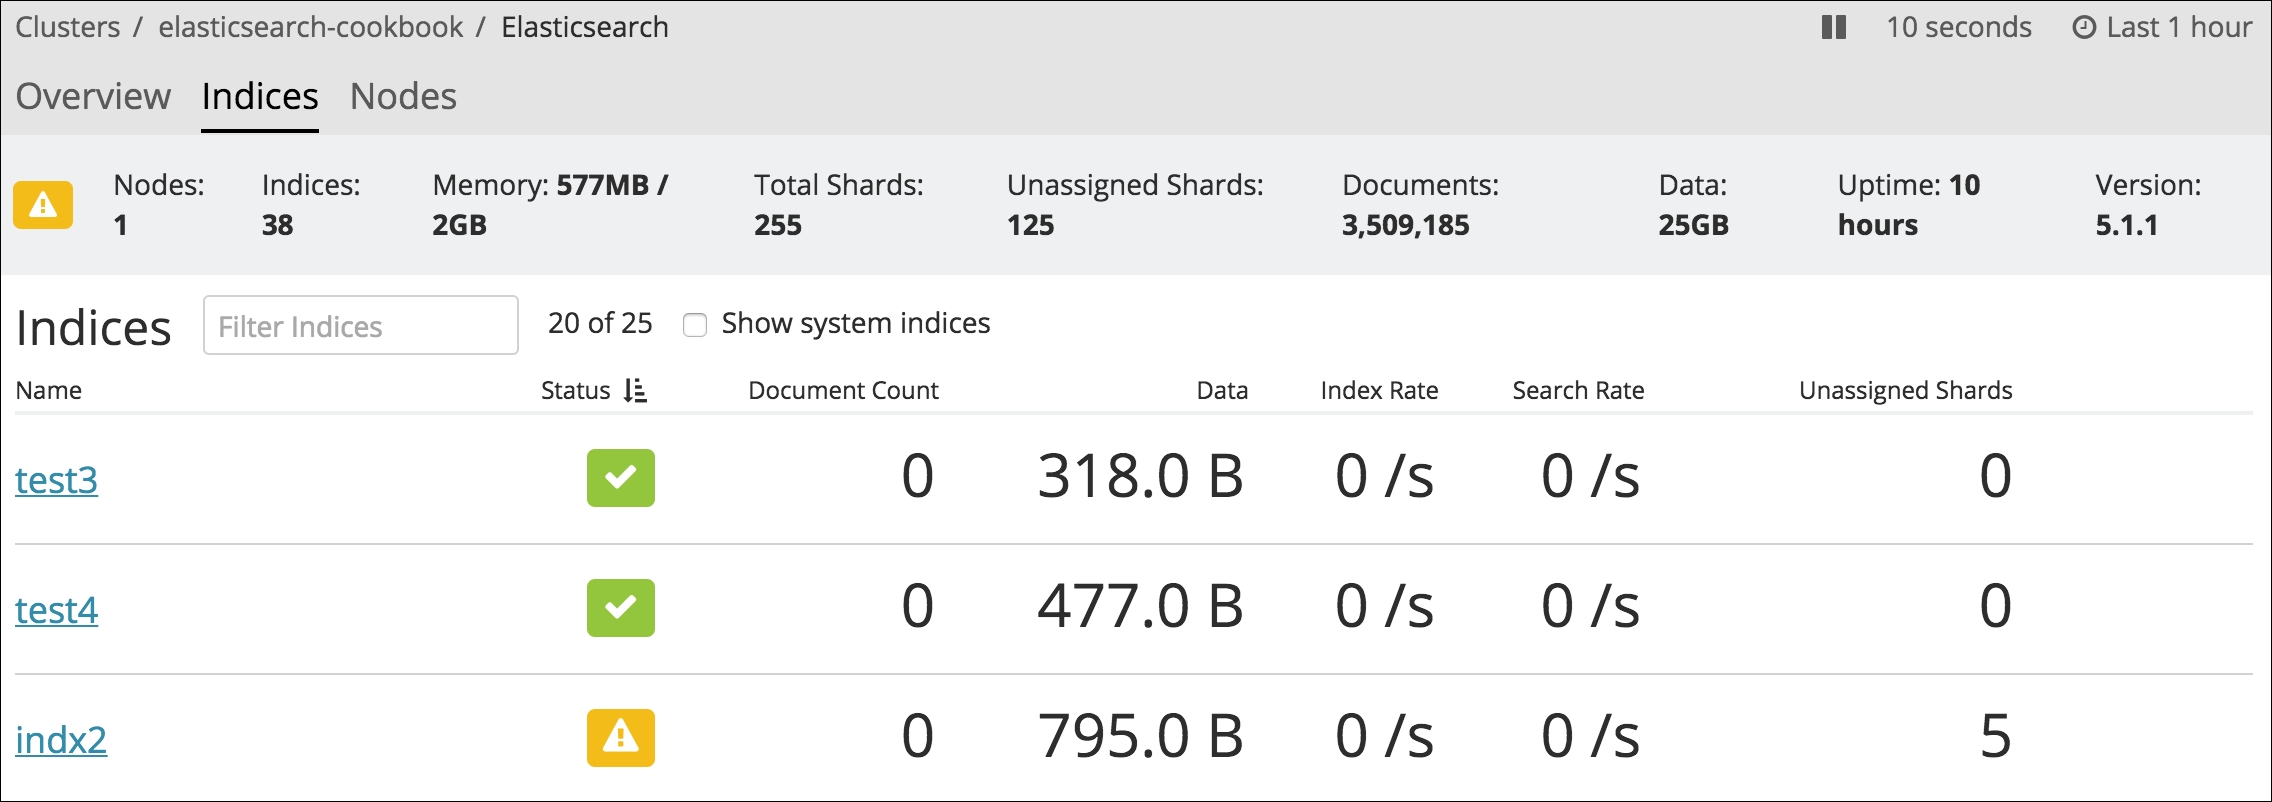
- If you click on the Indices cluster, you are able to see the node's status and statistics as shown in the following screenshot:
The monitoring application is composed of two components: a part that is installed in Elasticsearch server and another one that is installed in Kibana.
The part that is installed in Elasticsearch does active cluster monitoring, sending on-time interval statistics to Elasticsearch monitor server/cluster.
In this case, we have used the same cluster both for data and logs, but it can be configured to use an external cluster for monitoring.
The configurations for this part of the plugin are, as usual, in the elasticsearch.yml file. The most important properties are as follows:
monitor.agent.exporter.es.hosts: This is a list of hosts in hostname:port format to which statistics and events will be sent (default["localhost:9200"])monitor.agent.enabled: This can be set tofalseto disable all exporting of data (defaulttrue)monitor.agent.indices: This allows us to control which indices to export data for. It's a comma-separated list of names that can be wildcards as well, for example,+test*,-test1(default*)monitor.agent.interval: This controls the interval between data samples; set it to-1to temporarily disable exporting (detault10s)
The insight part is in the frontend as the monitoring app in Kibana, which allows a powerful customization of the interface to provide advanced analytics.
The interface is very simple to understand and common issues are marked with red to give attention to the user.
Probably, Elasticsearch monitoring is the most complete available solution to monitoring an Elasticsearch cluster, easy to use, and fully customizable.
- https://www.elastic.co/products/x-pack/monitoring for Monitor licensing and overview
- https://www.elastic.co/guide/en/x-pack/current/xpack-monitoring.html for Monitor documentation
- https://www.elastic.co/products/kibana for Kibana overview