
- Elasticsearch 5.x Cookbook Third Edition
- Credits
- About the Author
- About the Reviewer
- www.PacktPub.com
- Customer Feedback
- Dedication
- Preface
- 1. Getting Started
- 2. Downloading and Setup
- Introduction
- Downloading and installing Elasticsearch
- Setting up networking
- Setting up a node
- Setting up for Linux systems
- Setting up different node types
- Setting up a client node
- Setting up an ingestion node
- Installing plugins in Elasticsearch
- Installing plugins manually
- Removing a plugin
- Changing logging settings
- Setting up a node via Docker
- 3. Managing Mappings
- Introduction
- Using explicit mapping creation
- Mapping base types
- Mapping arrays
- Mapping an object
- Mapping a document
- Using dynamic templates in document mapping
- Managing nested objects
- Managing child document
- Adding a field with multiple mapping
- Mapping a GeoPoint field
- Mapping a GeoShape field
- Mapping an IP field
- Mapping an attachment field
- Adding metadata to a mapping
- Specifying a different analyzer
- Mapping a completion field
- 4. Basic Operations
- Introduction
- Creating an index
- Deleting an index
- Opening/closing an index
- Putting a mapping in an index
- Getting a mapping
- Reindexing an index
- See also
- Refreshing an index
- Flushing an index
- ForceMerge an index
- Shrinking an index
- Checking if an index or type exists
- Managing index settings
- Using index aliases
- Rollover an index
- Indexing a document
- Getting a document
- Deleting a document
- Updating a document
- Speeding up atomic operations (bulk operations)
- Speeding up GET operations (multi GET)
- 5. Search
- Introduction
- Executing a search
- Sorting results
- Highlighting results
- Executing a scrolling query
- Using the search_after functionality
- Returning inner hits in results
- Suggesting a correct query
- Counting matched results
- Explaining a query
- Query profiling
- Deleting by query
- Updating by query
- Matching all the documents
- Using a boolean query
- 6. Text and Numeric Queries
- Introduction
- Using a term query
- Using a terms query
- Using a prefix query
- Using a wildcard query
- Using a regexp query
- Using span queries
- Using a match query
- Using a query string query
- Using a simple query string query
- Using the range query
- The common terms query
- Using IDs query
- Using the function score query
- Using the exists query
- Using the template query
- 7. Relationships and Geo Queries
- 8. Aggregations
- Introduction
- Executing an aggregation
- Executing stats aggregations
- Executing terms aggregation
- Executing significant terms aggregation
- Executing range aggregations
- Executing histogram aggregations
- Executing date histogram aggregations
- Executing filter aggregations
- Executing filters aggregations
- Executing global aggregations
- Executing geo distance aggregations
- Executing children aggregations
- Executing nested aggregations
- Executing top hit aggregations
- Executing a matrix stats aggregation
- Executing geo bounds aggregations
- Executing geo centroid aggregations
- 9. Scripting
- 10. Managing Clusters and Nodes
- 11. Backup and Restore
- 12. User Interfaces
- 13. Ingest
- 14. Java Integration
- Introduction
- Creating a standard Java HTTP client
- Creating an HTTP Elasticsearch client
- Creating a native client
- Managing indices with the native client
- Managing mappings
- Managing documents
- Managing bulk actions
- Building a query
- Executing a standard search
- Executing a search with aggregations
- Executing a scroll search
- 15. Scala Integration
- 16. Python Integration
- 17. Plugin Development
- 18. Big Data Integration
The core of Kibana are the dashboards--an aggregation of widgets that are results of queries and aggregations.
You need an up-and-running Elasticsearch installation as we described in the Downloading and installing Elasticsearch recipe in Chapter 2, Downloading and Setup.
You also need a functional Kibana installation as described in the Installing Kibana and X-Pack recipe.
For managing Kibana dashboards, we will perform the following steps:
- We access the Discovery section of Kibana as shown in the following screenshot:
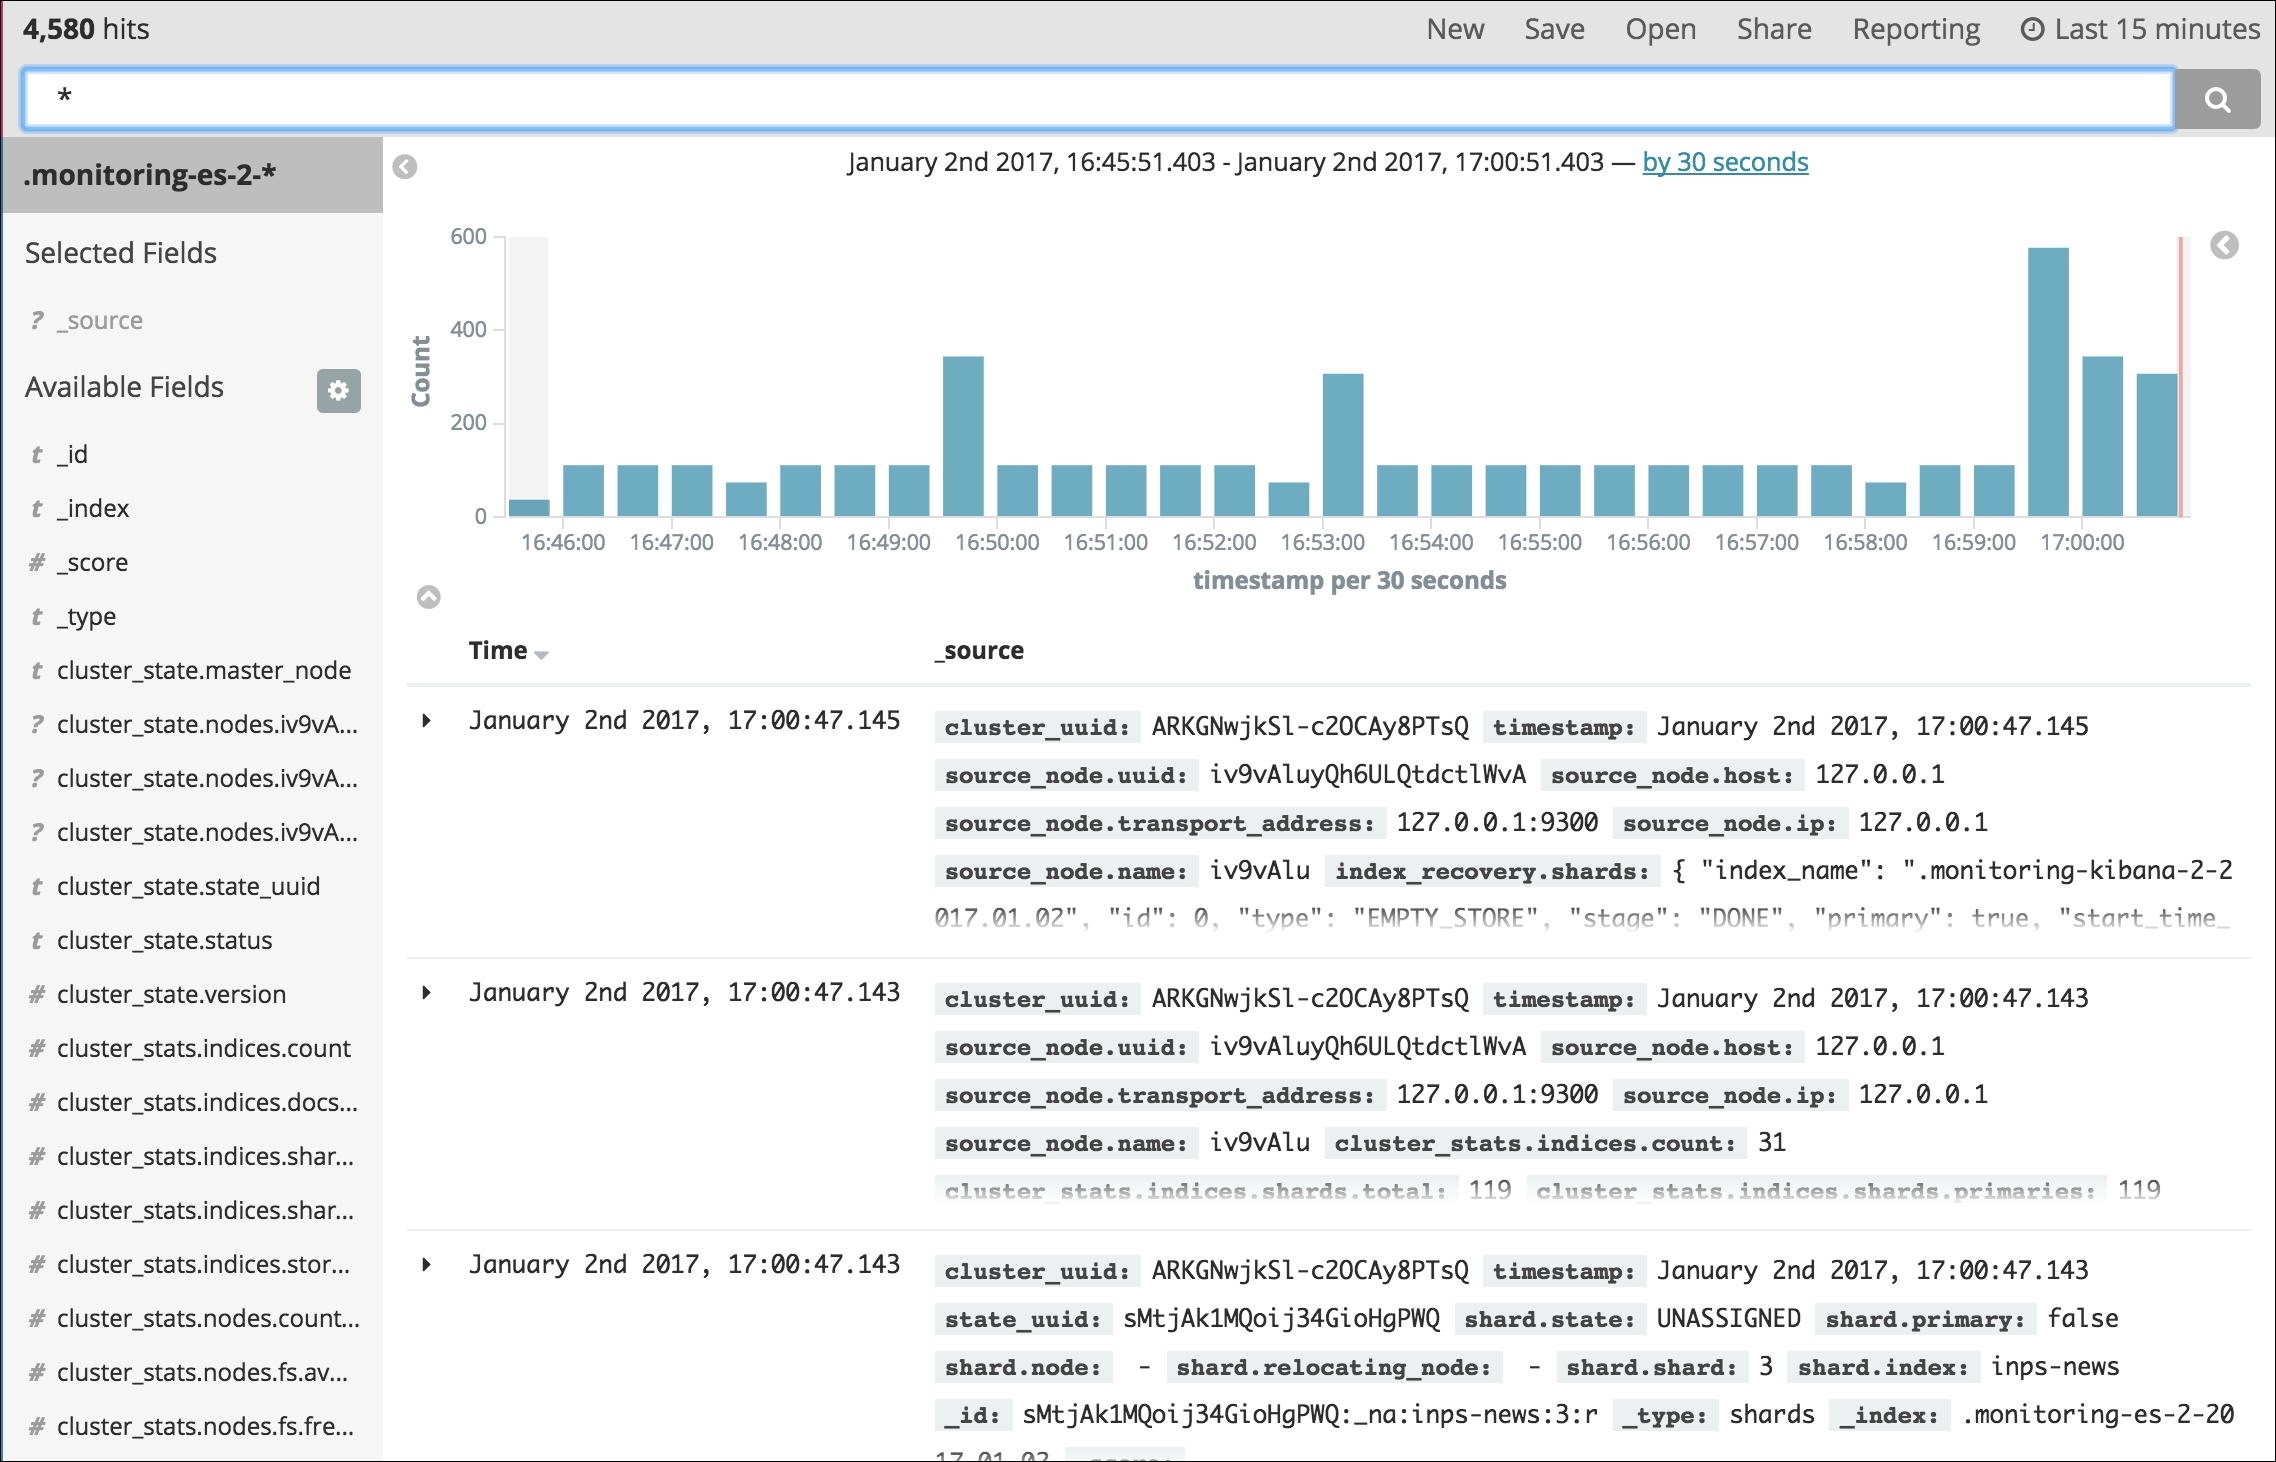
- After a few seconds, the default search frontend should appear. The default query is
*, which is executed against the_allfield.
The Kibana interface is divided into sections: Discovery, Visualize, Dashboards, Dev Tools, and Management are available in the opensource version of Kibana. The X-Pack adds Graph and Monitoring ones.
The dashboard top menu allows us to do as follows:
- Create a new dashboard starting from scratch via the New menu entry.
- Save the current dashboard / query giving it a name.
- Open the dashboards that you have already saved.
- Share a dashboard or a dashboard snapshot (with date/time value fixed) via a link.
- Generate a PDF from the current dashboard via the Reporting menu entry. To generate a report, your dashboard must be saved. The reporting entry is available only if X-Pack is installed.
- If you are using autorefresh dashboards, you can pause autorefresh via the pause icon. By clicking on the refresh interval, you can change it as shown in the following screenshot:

- Change/define the time interval range by clicking on the time range value.
Internally, the Kibana dashboards are stored in an Elasticsearch special index .kibana and in case of some asynchronous task the data is read from this index.
-
No Comment