
As Elasticsearch, Kibana allows to be extended with plugins that can be installed to increment its functionalities.
In this recipe, we will install 3D pie chart, bars chart, and bubbles chart visualizations available at https://github.com/aparo/3D_kibana_charts_vis.
You need an up-and-running Elasticsearch installation as we described in the Downloading and installing Elasticsearch recipe in Chapter 2, Downloading and Setup.
You also need a functional Kibana installation as described in the Installing Kibana and X-Pack recipe. The X-Pack is not needed.
As the plugins that we are installing is very new, they are not packaged as binary zip, we need to install via source code using git and npm of Node.js.
To install a source Kibana plugin, we will perform the following steps:
- We need to be in a shell in the
kibana/pluginsdirectory. - We fetch the source from github via following command:
git clone https://github.com/aparo/3D_kibana_charts_vis.git 3D_kibana_charts_vis - We can now build the plugin via following command:
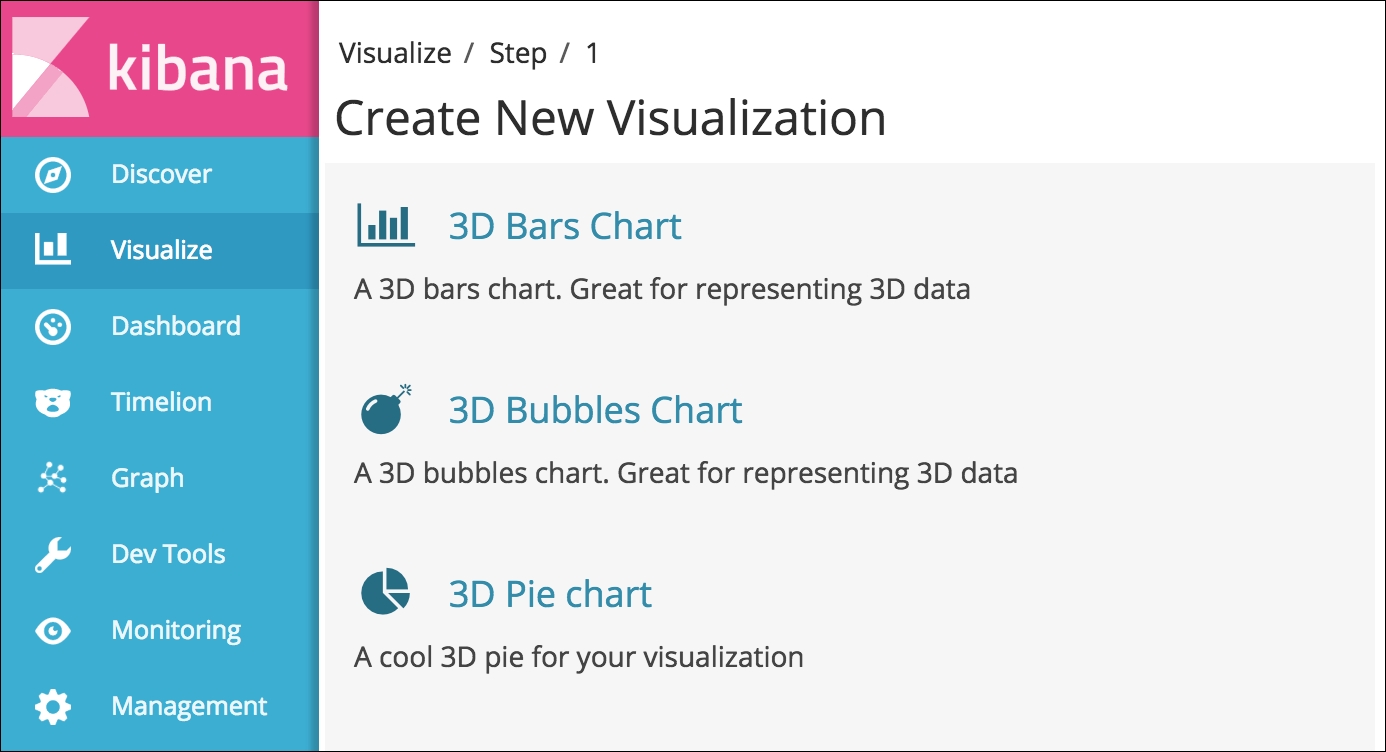
cd 3D_kibana_charts_vis npm install - Now, we can restart Kibana and use the new visualization widgets, which should appear in the Visualize section as shown in the following screenshot:
Kibana is extendable via plugin: due to fast release of Elasticsearch 5.x and Kibana 5.x, developers are moving their plugins for Kibana 4.x to Kibana 5.x.
If there is a plugin zip package, the standard way of installing a plugin is to use the bin/kibana-plugin install <url> command.
In case of plugins in development, it is common to fetch the source and compile it on Kibana node or build a package zip in a development machine and then deploy it on other installations.
Like Elasticsearch, a Kibana plugin must have the same version of Kibana: in this case 5.1.1.
If you fetch a Kibana plugins code, the first step is to download all the required resources. Because Kibana is built on node.js and the plugins are mini apps, standard npm commands are used to execute the tasks.
npm install reads the package.json file that contains the dependencies and downloads all the required files. If needed, it compiles the code to be used.
For activating the plugin, you need to restart Kibana. The first restart can take several minutes, because Kibana does some optimization. If you check your Kibana logs at restart, you'll see something similar to the following output:
log   [...] [info][optimize] Optimizing and caching bundles for graph, monitoring, kibana, timelion, login, logout and status_page. This may take a few minutes
log   [...] [info][optimize] Optimization of bundles for graph, monitoring, kibana, timelion, login, logout and status_page complete in 147.24 seconds