
CHAPTER 8 |
 |
Treatment of Nanodiamonds
in Supercritical Water
Vlamidir I. Anikeev and Anna Yermakova
Boreskov Institute of Catalysis SB RAS, Novosibirsk, Russia
Contents
2. Thermodynamics of Solid Graphite and Diamond Conversion in SCW
4.2. Results of the X-ray Diffraction Analysis
4.3. Pretreatment of the Diamond Blend
4.4. Treatment of Detonation Carbon in SCW
4.5. Results of the X-ray Diffraction Analysis
4.6. Results of the HRTEM Analysis
4.8. Results of the X-ray Diffraction Analysis
4.9. Results of the HRTEM Analysis
1. INTRODUCTION
Carbon nanostructures have been studied quite intensively in recent years. Among various synthesized carbon nanomaterials, of particular interest are the so-called ultradispersed nanodiamonds (UDD) obtained by detonation of solid carbon-containing explosives with a negative oxygen balance [1–4]. Current and potential application areas of UDD are very wide [3]. UDD can be used in metal–diamond galvanic coatings, in polishing pastes and suspensions, for lubricating oils and lubricant coolants, as addition to polymers. Due to the high adsorption capacities, UDD is considered promising for medical and biological applications.
Although this method is highly efficient, the resulting product – detonation carbon (soot) or diamond blend – contains different structures and forms of carbon, with the diamond phase constituting approximately 35–45 wt%. Moreover, depending on the production process, detonation carbon may include the sorbed impurities represented by metals, their oxides, and their carbides [3–5].
To recover the diamond phase and remove water-insoluble impurities, the initial diamond blend is usually treated with liquid or gaseous oxidants [3, 6, 7]. Mixtures of sulfuric and nitric acids and sulfurous and chromic anhydrides are used as the liquid oxidants. The gaseous thermo-oxidants are represented by oxygen or ozone. In practice, the most used technique consists in treating the diamond blend with concentrated nitric acid under thermobaric conditions – in an autoclave at elevated pressure and temperature. This method allows one to oxidize nanodiamond carbon and remove metals, their oxides, and some other impurities. To remove or change the composition of surface functional groups (NH, C=O, C=N, NO3, SO3H), the starting mix is treated also with organic solvents, alcohols, or ion-exchange resins [3]. Thus, purified detonation carbon may contain up to 90–97% of different nanodiamond species and 3–10% of nanodiamond carbon and other impurities.
However, chemical purification with the use of strong acids may lead, on the one hand, to the oxidation of the diamond phase and contamination of the diamond surface with different functional groups, and on the other hand, to a large release of aggressive wastes. Thus, irrespective of a satisfactory removal of nondiamond phases and impurities provided by the acid purification, it is necessary to suggest and test alternative methods for treatment of diamond-containing mix and UDD recovery. These methods may lead to the formation of new properties of ultradispersed diamonds, which can underlie the development of novel materials and substances with specified properties. New methods of treatment can be used individually, combined with the conventional techniques and supplement them. Note that the ability to decrease detrimental and aggressive wastes should be taken into account in the development of new methods.
For this purpose, authors of the present work carried out a study aimed at the treatment of the detonation carbon mix produced at the Federal Scientific and Production Center “ALTAI,” Biysk, Russia, both in supercritical water (SCW) and with the addition of hydrogen peroxide. The goal of this work was to study the morphological and structural changes of carbon species and to choose the composition of supercritical fluid and the process conditions. Note that determination of conditions and parameters providing the maximum purification of UDD, as well as a thorough investigation of its surface properties, phase composition, and microstructure, was beyond the scope of our work because these aspects have received much attention in the literature [3, 4, 8–11].
2. THERMODYNAMICS OF SOLID GRAPHITE AND DIAMOND CONVERSION IN SCW
A relatively large number of publications focused on the studies of stability of various nanocarbon phases, including the diamond and graphite ones, are available in the literature [12–16]. Nanocarbon phase diagrams were studied as a function, besides temperature and pressure, of the third parameter – size of cluster, which may contain from several hundreds to tens of thousands of carbon atoms [12, 17]. As a rule, the nanocarbon phase transitions proceed at high temperatures and pressures or under exposure to electron beam [18].
Quantum mechanical calculation of the carbon-cluster formation energy, including potential surface energy, which controls the dynamics of the graphite- to diamond-phase transition, proved relative stability of various nanocarbon phases. It was shown that stability of carbon phases increased in raw fullerene → diamond → graphite with increasing cluster size [13, 14].
However, for studying chemical reactions of different carbon phases in SCW under relatively soft conditions, it seems reasonable to estimate the differences in the conversion of diamond and graphite in SCW in the presence of oxygen. For this purpose, let us use classic thermodynamics for the equilibrium calculation and introduce in the Gibbs free energy equation an item (summand) representing the contribution of the surface energy of a cluster comprised n atoms of ith carbon phase:
![]()
where Gi is the Gibbs energy of ith carbon phase and dEi is the surface energy of a cluster comprised of n atoms of ith carbon phase. Gibbs energy is assumed to be 70 kcal/mol for diamond and 40 kcal/mol for graphite [12].
Calculation showed that at temperature 390 °C and pressure 285 atm (corresponding to experimental values), both graphite and diamond phases convert completely in SCW to yield H2, CO, CO2, and CH4 (in the presence of oxygen).
As graphite with low n number is oxidized in SCW with deficient oxygen, the H2 yield is considerably higher and the CO yield is considerably lower than respective values in the oxidation of diamond.
At temperature and pressure similar to experimental values and in oxygen deficiency, the oxidation of graphite in SCW yields a larger amount of H2 and CO2, but lower amount of CO and CH4, than the oxidation of diamond.
As the temperature of carbon (both diamond and graphite species) reaction with SCW increases from 220 to 400 °C, the CO concentration in the reaction products increases considerably, whereas the CO2 and CH4 concentrations decrease slightly.
Thus, the calculation of equilibrium conversion of diamond and graphite in SCW showed no considerable differences related to individual carbon phases or number of carbon atoms in the cluster. Therefore, it is reasonable to expect that experiments on the oxidation of these carbon species in SCW will show only different kinetic characteristics.
3. EXPERIMENTAL PROCEDURE
The experiments were performed in an autoclave reactor of approximately 70 cm3 capacity equipped with electric heater and magnetic stirrer. When detonation carbon was treated only in SCW, the initial sample of the mix was placed with water into an autoclave and heated to the temperature of experiment, 390 °C (±5), at the reactor pressure 285 atm (±5). The temperature and pressure were selected slightly higher of the critical parameters of pure water (Pcr ≈ 22.1 MPa, Tcr ≈ 374 °C). After establishing the temperature and pressure, the process lasted from 2 to 4 h.
Phase composition of the solid phase was studied before and after the treatment of the mix in SCW using the high-resolution transmission electron microscopy (HRTEM), scanning electron microscopy, and X-ray diffraction analysis. The composition of gaseous reaction products was analyzed chromatographically, with the measurement of their volume.
A quantitative ratio of diamond and graphite phases in all the samples, including the initial samples, was determined with an X’TRA diffractometer (Switzerland) using the CuKα- radiation (λ = 1.5418 Å). Virtually, each diffraction micrographs shows the considerably broadened peaks from graphite-like and diamond phases, as well as the diffraction peaks from impure crystal phases (Fe3O4 and others).
A quantitative analysis of the relative content of graphite-like and diamond phases was based on the ratio of intensities of the largest peaks from these phases: the graphite peak (002) and the diamond peak (111). The calibration plot showing the ID/IG ratio of integral intensities of the diamond (ID) and graphite (IG) peaks (111) as a function of weight percent ratio of these phases was obtained from theoretical calculation of intensities made with the use of PowderCell for Widows (PCW) program (Fig. 8.1).
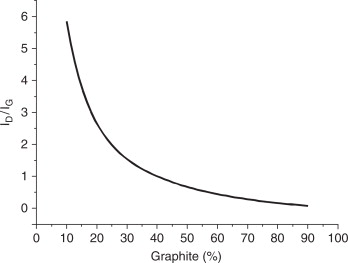
Figure 8.1 The ratio of integral intensities of the diamond (ID) and graphite (IG) peaks (111) in relation to the weight percent ratio of these phases.
4. RESULTS AND DISCUSSION
4.1. Initial Sample
Initial sample of the diamond blend, detonation carbon (sample #1), was a carbon material represented by a highly dispersed black powder. From the HRTEM data, initial sample of the mix consists of a carbon material with quite uniform density, which includes several types of nanostructures. Figure 8.2A shows the diamond crystals (marked by squares) embedded in the carbon material as flakes. The sample contains also a large amount of amorphous carbon, for example, in the micrograph region marked by a circle. A high magnification of the initial sample in Figs 8.2B and C shows the presence of onion-like carbon species with inclusion of diamond nanoparticles and diamond nanocrystals not covered with the graphite-like layers (marked by squares in Fig. 8.2C).
4.2. Results of the X-ray Diffraction Analysis
The diffraction micrograph of the initial sample (sample #1) in Fig. 8.3 shows the broadened peaks from graphite-like carbon phase and peaks (111) and (220) assigned to the diamond phases. From the XRD data, mean size of diamond crystals is 30 ± 5 Å, and a quantitative ratio makes up 42% for diamond and 58% for graphite-like phase (ID/IG = 0.72). The micrograph of initial sample shows also sharp diffraction peaks from impurity phases, with the peak corresponding to crystal iron being the most pronounced. The peak from graphite-like phase partially splits, which may evidence a morphological inhomogeneity of this phase in the initial sample of diamond-containing mix.
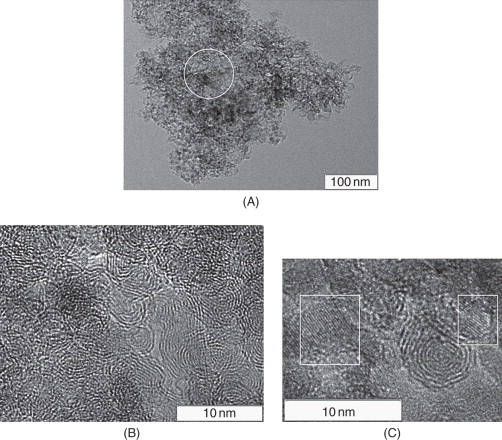
Figure 8.2 (A–C) HRTEM images of the initial sample of detonation carbon (sample #1).

Figure 8.3 Diffraction micrograph of the initial sample of detonation carbon (sample #1).
4.3. Pretreatment of the Diamond Blend
Detonation carbon pretreated in hydrochloric acid was used as the second initial sample of the diamond blend (sample #2) to be treated in SCW. In this case, the mix was boiled in the presence of hydrochloric acid in a glass flask on oil bath for approximately 5 h at 128–132 °C. After boiling, solid phase was filtered and repeatedly washed with water to bring pH to 7. After the secondary filtration, the sample was dried at 50–60 °C for a day. The treated powder did not change its color, whereas the waste acid became yellow and green.
The UV spectroscopy data (spectrophotometer Shimadzu 2501-PC) showed the absorption in the region of 11000–12000 cm−1, which is typical of aqua complexes of bivalent iron. Hence, treatment of the diamond blend in acid leads to partial or complete removal of iron, which is reliably confirmed by the XRD data (Fig. 8.4). The XRD pattern of the sample contains the broadened peaks from diamond and graphite-like phases; impurity phases are not observed. Mean size of the diamond crystals and a quantitative ratio of diamond and graphite-like phases remained the same as in sample #1.
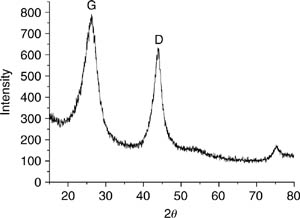
Figure 8.4 Diffraction micrograph of the treated initial sample of detonation carbon (sample #2).
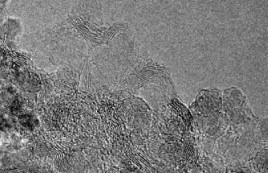
Figure 8.5 Image of sample #2 of detonation carbon treated in hydrochloric acid.
The HRTEM analysis of sample #2 of detonation carbon after processing in hydrochloric showed (see Fig. 8.5) that onion-like carbon structures are partially destroyed and transform into the so-called graphene sheets.
4.4. Treatment of Detonation Carbon in SCW
A sample of the diamond blend with water was placed into an autoclave reactor and heated under stirring to the temperature of experiment, 390 °C, and pressure 285 atm. After establishing the temperature and pressure corresponding to water transition to a supercritical state, the process ran from 2 to 6 h. After cooling the reactor, pressure and gas volume of the reaction products were measured. The measurement showed a 2 to 2.5-fold increase of the gas volume of the products compared with the initial free volume of the reactor, which indicates a strong oxidation of the carbon-containing phase. Analysis of gaseous product shown that CO2 constituted approximately 70–80 vol.% of the resultant gases; in addition, the reaction products contained CO and CH4 (up to 20%) and trace amounts of H2. A weight loss of the solid diamond blend ranged from 15 to 35%, depending on the process time, which also evidences the oxidation of carbon component of the diamond blend to occur in the process with SCW. However, this gives no information about carbon structures subjected to preferential oxidation.
4.5. Results of the X-ray Diffraction Analysis
The analysis of the diffraction spectra of SCW-treated samples #1 shows that the ID/IG ratio of integral intensities of the peaks for this treatment depends on the process time and increases up to 0.8–0.9. All these spectra of treated samples also contain the diffraction peaks from impurities, with the maximum peak corresponding to the crystal phase of Fe3O4. The peaks appear because water in supercritical state, due to its dissociation, exhibits the acidic properties, which leads to oxidation of the reactor walls made of stainless steel and to ingress of metal oxides into the subject of investigation residing in the reactor.
4.6. Results of the HRTEM Analysis
A comparison of the images of initial sample #1 (Fig. 8.2A–C) with the images obtained after its treatment in SCW (Fig. 8.6) demonstrates essential distinctions: first, a considerably decreased amount of amorphous carbon phase in the treated sample; second, an increased concentration of the cubic modification of carbon.
Sample #2 was subjected to SCW treatment by the procedure similar to that described above for sample #1. The HRTEM images show that the treated sample consist of three parts: partially retained onion-like carbon species, homogeneous carbon structures with embedment of crystal diamond (Fig. 8.7A), and carbon (graphite) fibers 20–60 nm in length (Fig. 8.7B). The formation of so different carbon nanostructures in the samples of SCW treated material may have several reasons. First, reactor walls may affect the structure of condensed carbon upon contacting with SCW. Second, a part of carbon material may settle to the reactor bottom due to weak stirring, which leads to insufficient contact with SCW.
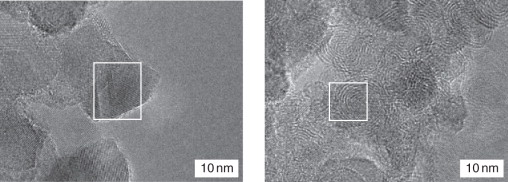
Figure 8.6 Images of detonation carbon after SCW treatment of sample #1.
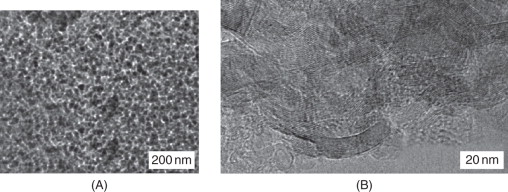
Figure 8.7 HRTEM images of detonation carbon after SCW treatment of sample #2.
4.7. Treatment of Detonation Carbon in SCW in the Presence of Hydrogen Peroxide Decomposition Products
The detonation carbon with water (sample #1 or #2) was placed into an autoclave reactor and heated up to 300 °C, then a specified amount of 30% solution of hydrogen peroxide was injected under pressure by syringe pump to provide the molar ratio of oxygen/carbon, 0.25–1. After establishing the stationary temperature 390 °C (±5) and pressure 285 atm (±5), the process ran from 1 to 4 h. After the treatment of sample #2 in SCW in the presence of oxygen that formed at hydrogen peroxide decomposition, detonation carbon changed its color from black to gray. According to the measurement performed after reactor cooling, the volume of evolved gas, including the unreacted oxygen, exceeded more than 8-fold the initial free volume of the reactor.
During the treatment of sample #2, chromatographic analysis of gaseous reaction products showed the reaction mixture to contain, along with oxygen, more than 85% of CO2, H2, CO, and CH4. The injected hydrogen peroxide decomposed completely to yield oxygen and water just after its introduction into the reactor. Thus, the oxidation of solid carbon involved also the oxygen dissolved in SCW. The amount of carbon that passed from solid to gas phase can be calculated from the volume of nascent carbon-containing gases.
4.8. Results of the X-ray Diffraction Analysis
The ID/IG ratios of integral intensities for the samples of detonation carbon treated in SCW in the presence of oxygen show a pronounced change toward increasing the fraction of diamond phase and attain the value of 1.86 for samples #2 during 4 h of the process, which corresponds to increasing the fraction of diamond phase up to 75 wt.%. Treatment of samples #1 under the same conditions gives the ID/IG ratio not exceeding 1.0. Thus, although the initial samples #1 and #2 contain virtually equal amounts of diamond and graphite phases, pretreatment of sample #2 with acid, according to [3], may result in loosening and etching of the carbon matrix along the structural defects, which provides a more considerable removal of carbon at SCW treatment of sample #2.
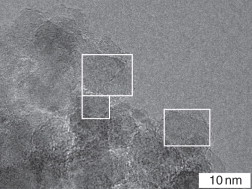
Figure 8.8 HRTEM image of detonation carbon after SCW treatment of sample #2 in the presence of hydrogen peroxide decomposition products.
4.9. Results of the HRTEM Analysis
The analysis of HRTEM images of samples #2 of detonation carbon after their treatment in SCW in the presence of hydrogen peroxide decomposition products shows, first, a high degree of purification (Fig. 8.8); second, nearly a complete absence of amorphous carbon phase and onion-like carbon; third, constancy of the carbon nucleus size, which indicates that the diamond phase is not oxidized.
Note that a disadvantage of the above experiments on treatment of the detonation carbon in SCW performed in a stainless-steel autoclave reactor consists in contamination of a sample with metals (their oxides) from the reactor walls due to their corrosion in the presence of SCW. This problem can be solved in future by using different materials and alloys.
5. CONCLUSIONS
The study showed that the interaction of detonation carbon with SCW is accompanied by the formation of large amounts of gaseous products, mainly CO and CO2, which is evidence of a deep oxidation of the carbon phase. The transformation of nondiamond carbon phase is most pronounced when the detonation carbon is treated in SCW that contains oxygen formed at decomposition of hydrogen peroxide. The SCW treatment of detonation carbon black was shown to increase considerably the weight fraction of diamond phase. It was found that oxidation of the diamond nucleus does not occur when detonation carbon is treated in SCW.
References
[1] Liamkin AI, Petrov EA, Ershov AP, Sakovich GV, Staver AM, Titov VM. Production of diamonds from explosive substances. Dokl Acad Nauk 1988;302(3):611–13.
[2] Volkov KV, Danilenko VV, Elin VI. Diamond synthesis from the carbon of explosives detonation products. Combustion Explosion Shock Waves 1990;26(3):123–5.
[3] Yu. Dolmatov V. Ultradisperse diamonds produced by detonation synthesis: properties and application. Russian Chem Rev 2001;70(7):687–708.
[4] Shenderova OA, Zhirnov VV, Brenner DW. Carbon nanostructures. Crit Rev Solid State Mater Sci 2002;27(3/4):227–356.
[5] Bogatyreva GP, Voloshin MN. Characterization and properties of diamond powders obtained by explosion. Supersolid Mater 1998;4:82–7.
[6] Putyatin AA, Nikolskaya IV, Kalashnikov NYa. Chemical methods of diamond recovery from synthesis products. Supersolid Mater 1982;2:20–8.
[7] RF Patent 2109683. A method for recovery of synthetic ultradisperse diamonds. 1998.
[8] Aleksensky AE, Baidakova MV, Vul AYa, Siklitsky VI. The structure of diamond nanocluster. Phys Solid State 1999;41(4):740–3.
[9] Kurdyumov AV, Ostrovskaya NF, Zelyavsky VB, Borimchuk NI, Yarosh VV. Structural features of nanodisperse diamonds obtained by dynamic synthesis. Supersolid Mater 1998;4:23–9.
[10] Baidakova MV, Vul A Ya, Siklitsky VI, Faleev NN. Fractal structure of ultradisperse diamond clusters. Phys Solid State 1998;40(4):776–80.
[11] Aleksensky AE, Baidakova MV, Vul A Ya, Davydov VI, Pevtsova Yu A. Diamond-graphite phase transition in ultradisperse diamond clusters. Phys Solid State 1997;39(6):1125–34.
[12] Ree FH, Winter NW, Glosli JN, Viecelli JA. Kinetics and thermodynamic behavior of carbon clusters under high pressure and high temperature. Phys B 1999;265:223–9.
[13] Barnard AS, Russo SP, Snook IK. Thermal stability of graphene edge structure and graphene nanoflakes. J Chem Phys 2003;118:5094–97.
[14] Barnard AS, Snook IK. Phase stability of nanocarbon in one dimension: nanotubes versus diamond nanowires. J Chem Phys 2004;120(8):3817–21.
[15] Nuth III JA. Small-particle physics and interstellar diamonds. Nature 1987;329:589.
[16] Badziag P, Verwoerd WS, Ellis WP, Greiner NR. Nanometer-sized diamonds are more stable then graphite. Nature 1990;343:244–5.
[17] Bundy FP, Bassett WA, Weathers MS, Hemley RJ, Mao HK, Goncharov AF. The pressure-temperature phase and transformation diagram for carbon; updated through 1994. Carbon 1996;34:141–53.
[18] Banhart F, Ajayan PM. Carbon onions as nanoscopic pressure cells for diamond formation. Nature 1996;382:433–35.