
9
Gantt Charts
In this chapter, you learn what a Gantt chart is, why it’s valuable in project management, how Gantt charts keep your project on schedule, and variations of the chart that you can devise.
Chart Your Progress
Henry L. Gantt, for whom the Gantt chart is named, was an ordnance engineer during the First World War. He was employed at the Aberdeen Proving Grounds of the U.S. War Department (now the U.S. Department of Defense) in Aberdeen, Maryland. While a century has passed, Gantt’s chart remains widely recognized as a fundamental, highly applicable tool for project managers everywhere.
Gantt charts are derived from your work breakdown structure (WBS). A Gantt chart enables you to easily view start and stop times for project tasks and subtasks. If you use an outline for your WBS, the Gantt depicts each of the tasks and subtasks in chronological order. For tasks that begin at the same time and run concurrently, the Gantt chart is a highly convenient tool. However, overlapping tasks and subtasks can easily be depicted on the Gantt chart, as well.
A WBS that is created from tree diagrams also lends itself to depiction on a Gantt chart, though the process is a bit tricky when it comes to determining overall project sequence as well as start and stop times. (Read more on converting tree diagrams to critical path analysis in Chapter 10, “Critical Path Method.”)
A few basic forms of Gantt charts are depicted here:
1. The chart in Figure 11 uses bars extending from left to right along the horizontal axis to denote starting and ending times for events or activities. Greater detail could be added if you wish to add subtasks. Color-coding allows you to pinpoint which project workers are handling which tasks and subtasks. The chart offers a simple plan for depicting the planned sequence of events, even though obviously not everything will go according to plan, versus the actual (the shaded bars).
2. A Gantt chart with triangles, shown in Figure 12, is an alternative to the previous chart. Rather than using bars to depict start and stop times, and shaded bars to depict actual performance versus planned performance, this chart uses:
FIGURE 11 Gantt Chart with Bars
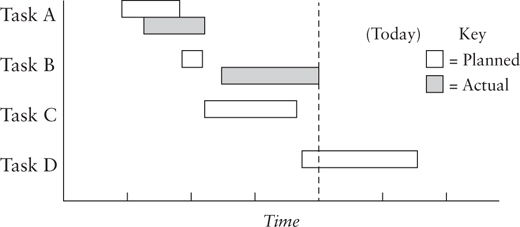
FIGURE 12 Gantt Chart with Triangles
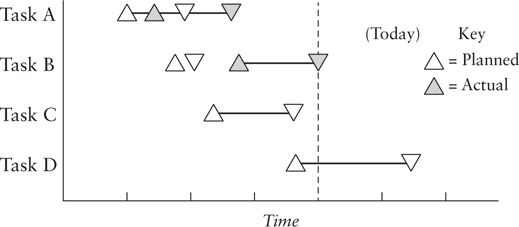
◾ Unshaded triangles pointing up to depict planned start time
◾ Unshaded triangles pointing down to depict planned end time
◾ Shaded triangles pointing up to depict actual start time
◾ Shaded triangles pointing down to depict actual completion time
3. A Gantt chart with triangles offers other advantages. Tasks and subtasks, as well as planned versus actual time frames, can be depicted on a single line emanating from the left of the chart, extending out along the horizontal axis to the right.
The variations of the Gantt chart depicted in these figures (though there are many others) offer a snapshot of a project’s progress based on time frames.
In Figure 11, though Task A didn’t start on time, its duration was roughly equal to the original planned time. In Task B, however, the start time was not only delayed, but the actual completion time for the task was greater than originally planned. This could signal potential budget problems or human resource bottlenecks here or elsewhere as the project progresses.
If the start of Task C is not dependent on the results of Task B, then the manager can make a decision to initiate Task C as scheduled or even earlier, since delays in starting Task B might indicate the availability of idle resources.
If Task C is dependent on the completion of Task B, or at least most of it, then the project manager might have no alternative but to have Task C start late as well.
You can see that the delays in Tasks A and B could have a cascading effect that puts other project activities behind schedule, unless you as project manager can reallocate resources so as to maintain the pace when possible.
Variations on a Theme
Each of the three Gantt charts depicted thus far represents ways of illustrating overall project status while including the status of each task. Thus, they serve as valuable tools for keeping project team members as well as the authorizing party, committees, top managers and executives, and other stakeholders abreast of activities.
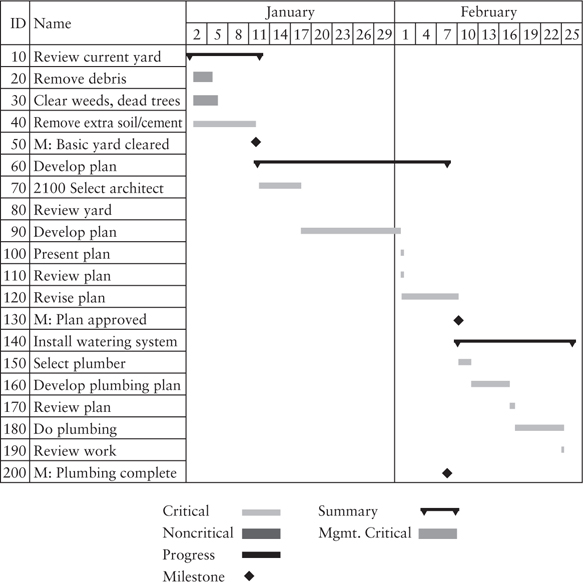
The Gantt chart in Figure 13, for a construction project, depicts an eight-week period that includes four items; three are actual tasks and one represents completion of the project. Each of the three tasks has between four and six subtasks. Virtually all project activity is dependent on maintaining the sequence of events as depicted.
The coding at the bottom of the chart indicates critical and noncritical progress, plus critical events. Scheduled start and stop times for the duration of tasks are earmarked by solid, downward-pointing triangles emanating from the start and end of progress bars. Milestones are depicted by solid diamonds. More detail could be added in the form of other kinds of lines and symbols. The project manager devising this chart probably found this level of coding to be useful and convenient.
FIGURE 13 Gantt Chart with Sequential Construction
Embellishments Offer Detail
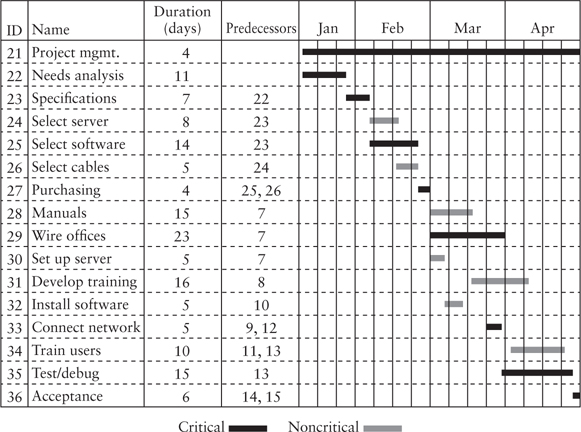
The more tasks involved in your project and the more important the sequence between tasks, the greater your propensity will be to embellish your Gantt chart. The chart in Figure 14 contains some added columns:
◾ Column 3, “duration,” lists how many days each task is scheduled to take.
◾ Column 4, “predecessors,” identifies what needs to be completed before this task can be initiated.
Often the previous task needs to be completed, but this isn’t necessarily the case:
◾ For Task 7, “purchasing,” both Tasks 5 and 6 need to be complete.
◾ For Tasks 8, 9, and 10, only Task 7 needs to be complete, as the other three tasks all start at the same time.
◾ For Task 12, “install software,” Task 10 needs to be complete, but Task 11, which is scheduled to start after, does not.
You might wonder, “Why not switch Tasks 11 and 12 in the Gantt chart?” The answer is that Task 11, “develop training,” follows directly from the completion of Task 8, “manuals” whereas Task 12, “install software,” directly follows from the completion of Task 10,“set up server.”They are listed in sequence on the Gantt chart based on what they follow, not based on when they start.
FIGURE 14 Gantt Chart with Multiple Predecessors
One of the benefits of listing the task duration in days is that it also gives you a strong indicator of required levels of staff support. In the simplest example, if staff members have the same capability, and a 10-day project requires one staff person per day, you could add the total number of days in the duration column and attain a total number of staff days necessary for the project.
In the case above, leave yourself (as project manager) out of the duration computation, because you are fully involved in management and not engaged in any individual task.
The challenge grows more complex when two, three, four, or more staff people are needed per task for each day of a task’s duration or, when varying numbers of staff people are needed per task, per day. It becomes further complicated if the skill levels of project staff vary widely. This is where Agile project management and scrum become useful. Sophisticated project management software and tools solve many issues related to multiple-resource complexity.
As I have emphasized throughout, first you need to understand the basics with paper and pencil, much like you had to learn the fundamentals of math on your own before being able to skillfully use a calculator.
Your Project, Back on Track
If you find yourself falling behind in one area, you have to make managerial decisions about keeping the overall project on track. These decisions will involve shuffling of resources, altering the scope of selected tasks or subtasks, or changing the sequence of tasks. Let’s visit each of these:
◾ Reallocating Resources—It happens to the best of project managers: You launch into a task, and soon find yourself under-resourced. You didn’t know that a particular task or subtask would prove to be so challenging! If it’s critical to the overall project, borrow resources from other task areas.
◾ Reducing the Level of Effort, or Scope, on Tasks or Subtasks—While some tasks require greater staff resources, other tasks and subtasks might be completed with less effort than you originally budgeted. Perhaps some subtasks can be combined, or even skipped. If you’re doing survey work, maybe you can still attain a quality result with, say, eight questions instead of 10, or can reduce the total number of interviews by 10%.
◾ Altering the Task Sequence—When faced with roadblocks, can you change the sequence of tasks or subtasks? Can you substitute easier tasks for more challenging ones until some of your other staff resources are free? Perhaps you can devise a sequence that enables some of your more experienced staff members to manage multiple tasks for a brief duration.
Thinking Ahead
The Gantt chart is also useful for engaging in “what-if?” questions. As you examine the sequence of events, their duration, and the number of allotted staff days, sometimes you see opportunities to make shifts in advance of the need. Such shifts might facilitate smoother operations down the road.
If you find that the first several tasks or subtasks on your project are already falling behind, a Gantt chart can help you identify where else this might occur, given your early operating experience. So, you could begin crafting possible scenarios using alternative Gantt charts that might be more effective for managing the duration of the project.
You could even have the pleasant experience of seeing tasks and subtasks completed in less time than you had originally plotted. If you do, use the Gantt chart to reschedule subsequent events, moving them up and taking advantage of the temporary gains that you’ve already realized.
◾ ◾ ◾
In all, the ease of preparation, use, alteration, and sheer versatility of Gantt charts make them a marvelous tool for both managing your project and depicting your progress to others.
QUICK RECAP
◾ The Gantt chart is regarded as a basic, highly appli cable tool that enables project managers to easily view start and stop times for project tasks and subtasks.
◾ The more tasks involved in your project and the more important the sequence between tasks, the greater your propensity and desire to purposefully embellish your Gantt chart.
◾ If you find that the first several tasks or subtasks on your project are already falling behind, a Gantt chart can help you identify where else this might occur, given your early operating experience.
◾ The Gantt chart helps answer “what-if?” questions when you see opportunities to make shifts.