
10
Critical Path Method
In this chapter, you learn why projects become increasingly complex, the basics of the critical path method (CPM), and how to use that method to conserve resources.
Complexity Happens
Complexity happens more often than we care for it to occur. Suppose you’re managing a two- or three-person team. With you and one other person, you have only one connection between the two of you. With a total of three people on a project you have three connections: one between you and person A, one between you and person B, and one between person A and B (see Figure 15). If only things stayed that simple!
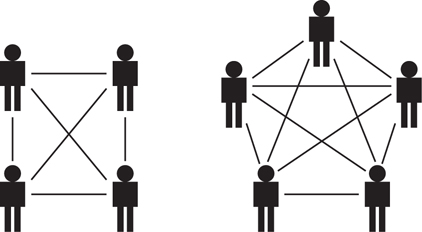
With four people on a project there are six connections, and with five people there are 10 connections, as shown in Figure 16.
With six people on a project there are 15 interpersonal connections, and with seven on a project there are 21. Thus, beyond five people on a project, the number of interconnections grows rapidly and can even become unwieldy.
FIGURE 15 Two- and Three-Person Connections
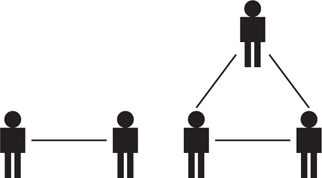
FIGURE 16 Four- and Five-Person Connections
Suppose that a vital item needs to be shared among your project staff. A project constraint is a critical project element such as money, time, tools, human resources, or something else that is, or becomes, in short supply. Then, add some other resource constraints such as when project team members can use a particular piece of equipment and when that equipment needs to be maintained: a constraint. What if the equipment is unavailable due to repair time: possibly a major constraint!
Now, add a second needed resource, such as access to a database, or reliance on a survey in process, or another piece of equipment. With many people on your project team, and with time, money, or resource constraints, effective management becomes complicated.
Add some tasks that are dependent on the completion of previous tasks and you have the recipe for bottlenecks, roadblocks, and, potentially, project inefficiencies. Complexity, as project resources grow, is not necessarily anyone’s fault; rather, it is often the result of restraints, interconnectedness, and dependencies.
The Gantt chart, discussed in Chapter 9, “Gantt Charts,” is a valuable tool, particularly for projects with few project team members, the project end approaching, and relatively few project constraints. For larger, longer-term projects involving many people, resources, and constraints, project managers need more sophisticated tools for maintaining control.
Enter the CPM and PERT
The critical path method (CPM) was developed in 1957 by Dupont Incorporated. Even if you personally do not have to engage in CPM analysis, it makes sense to know the fundamentals. CPM in a project is the path that takes the longest to complete. By definition, the critical path has no slack. If you fall behind along the critical path, the entire project falls behind schedule.
A second project management technique, whose approach is somewhat like CPM but more involved, is the program evaluation and review technique (PERT). PERT was developed in 1958 by Booz-Allan Hamilton and the Lock-heed Corporation, in participation with the U.S. Navy, on their joint Polaris submarine-launched nuclear missile project. It offers a degree of control that becomes essential for many projects, especially large ones, perhaps those larger than you as the typical reader of this book can likely manage.
Using PERT, a project manager will seek to identify a task or set of tasks that represent a defined sequence crucial to project success. A PERT chart, in its true sense, depicts a three-point approach to estimating possible duration times for tasks, typically categorized as optimistic, likely, and pessimistic. Estimating in this way enables project managers to gain a stronger grasp of how the project schedule might realistically unfold.
CPM, which we will explore in the balance of this chapter, is a useful approach to project management because it enables a project manager to monitor the impact of various project developments. For example:
◾ If a critical task slips by a few days and ends up starting at the same time as a succeeding critical task was originally scheduled to start, what takes precedence? With two critical tasks, the one that starts late has to be completed before the other starts.
◾ What happens by keeping project staff on one task for an extra three days? If the task is on the critical path, it will delay the other critical tasks by, you guessed it, three days.
◾ What is the impact if a noncritical task slips by two weeks? It depends on how much float that noncritical task has. If it has, say, 16 days of float, then two days of float would remain.
To emphasize: A critical task refers to a single task along a critical path. A noncritical task refers to a task within a CPM network for which slack time is available. Slack time is the time interval when there’s leeway as to when a certain task needs to be completed.
Great Utility
Project managers have used CPM to compress project schedules by identifying which tasks can be undertaken in parallel—a valuable capability—when initially it might have appeared that they needed to be undertaken sequentially.
Since the critical path represents that path that takes the most time to complete, it contains no slack. Delays along the critical path affect the entire project, whereas tasks not on the critical path have some slack in their completion time. So, team members assigned to noncritical path tasks might not have to work quite as steadfastly as those assigned to critical path tasks. If they’re not careful, however, their total duration can exceed that of the critical path. As such, they could cause the project to fall behind schedule, as well.
Keeping in mind that this book is titled Everyday Project Management, is of moderate length, and is not a 480-page tome, let’s observe step by step how you can use CPM to manage a simple project. We’ll keep it to two people on this project: you and a friend. With 10 events or tasks, including a start and an end, only nine tasks actually require attention.
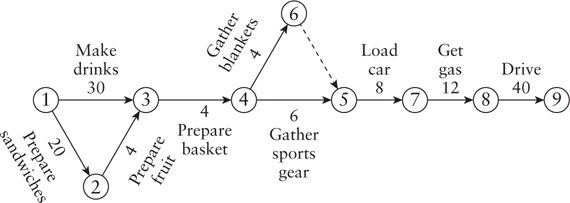
1. Create a work breakdown structure for the project. Figure 17 serves as our example, with duration times listed in minutes.
In this example, the path requiring the most time is Task 10, the 40-minute drive to the outing site.
2. Using the information in the WBS, create a flowchart like that depicted in Figure 18. Notice that in this flowchart some tasks can occur simultaneously. Bill’s tasks are depicted above, and Erika’s tasks are depicted below.
Dark or fine lines indicate the relationships between the boxes. For example, “prepare sandwiches” and “prepare fruit” are connected by a thin line. Bill’s task “make drinks” connects to Erika’s task “prepare basket” with a thick line, which we’ll address shortly.
FIGURE 17 Work Breakdown Structure for an Outing
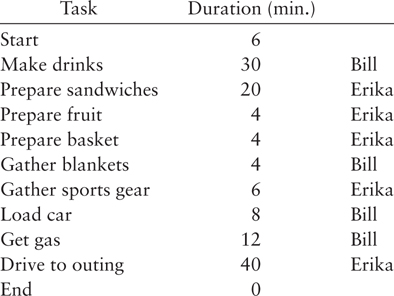
FIGURE 18 CPM Network
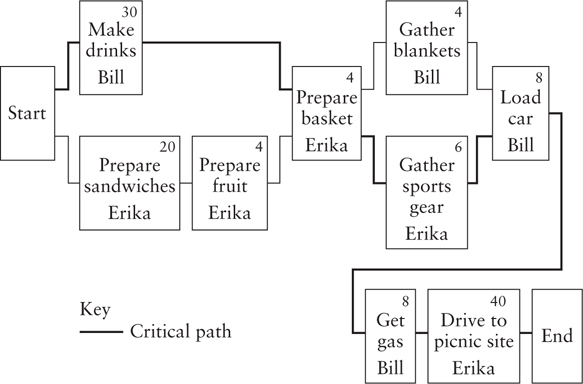
Both Bill’s and Erika’s tasks lead to “gather sports gear.”
3. Because “make drinks” requires 30 minutes and Erika’s tasks consume 20 minutes and 4 minutes respectively, “make drinks” represents the critical path in this project, indicated by the black line between Bill’s first and second activity.
Erika’s path has six minutes of slack. If she starts a few minutes late or lingers for one or two minutes between tasks, as long as her total slack doesn’t exceed six minutes she’ll still finish before Bill. Conceivably, she could take her time on each task, adding a minute or two to each and still finish before Bill. But if her slack equals six minutes, she’ll finish at the same time as Bill.
4. The critical path for the entire project as depicted above can be traced by
◾ Identifying which tasks occur simultaneously.
◾ Noting which ones take longer.
◾ Routing the critical path through them.
◾ Summing the entire length of the critical path.
In the preceding case, the entire project would require 100 minutes. It sounds straightforward so far, doesn’t it?
5. So, putting our knowledge to use: For this or any other type of project, examine the earliest times that critical tasks need to start. Then determine the earliest times that noncritical tasks could start. Column 2 of Figure 19 indicates the earliest start times for Bill’s and Erika’s individual as well as combined tasks.
Column 3 shows the late start times for Tasks 2, 3, and 5, the first two tasks handled by Erika, and the latter handled by Bill. The total slack time—the cumulative sum of time that various tasks can be delayed without delaying the completion of a project—for Tasks 2, 3, and 5 respectively are six, six, and two minutes, as depicted in column 4.
FIGURE 19 Roster of Events with Early, Late, and Slack Time
In calculating the latest acceptable start times, work from right to left. Focusing on the critical path, if the overall project requires 100 minutes, the latest start time for the last task (“drive to outing”) occurs at the 60th minute. This is derived by subtracting 40 minutes of driving from 100 total project minutes.
Similarly, “load car” and “get gas” need to commence by the 40th and 48th minutes, respectively. The drive begins at the 60th minute and the service station stop lasts for 12 minutes. Hence, 60–12 = 48. The other values can be computed likewise.
6. The computation to determine the latest acceptable start times for noncritical times also proceeds from right to left, like that described above. Slack time is computed by subtracting the earliest determined start times from the latest possible start times. Said alternatively, subtract the values in column 2 from the values in column 3, and the resulting value in column 4 represents your slack time.
Slack time occurs when both project team members are simultaneously engaged in individual projects. When both work on the same project, there is no slack time—and joint project activities lie on the critical path.
What If Things Change?
By chance, if Bill finishes Task 2, “make drinks,” in less than 30 minutes and Erika has done her job as scheduled, up to six minutes could be reduced on the overall project critical path. If Erika starts at the earliest times indicated, works diligently, and finishes at the 24th minute mark as originally planned, she could possibly help with some of Bill’s subtasks that lead to the successful completion of Task 2. His help might save a few minutes off the total project time.
The reverse could also occur. Attempting to help Bill, Erika might spill something, mix the wrong ingredient, or otherwise cause a delay. If so, you would add back minutes to the critical path determination equal to the length of the delay that she caused.
Because the task durations represent estimates, and few tasks might proceed according to plan, the overall project time could vary widely from what Bill and Erika first estimated. They might save one to two minutes on Tasks 5, 8, and 9. Meanwhile, a traffic back-up on this fine Saturday morning could turn a 40-minute trip into 50 minutes.
Time saved here and there often lags time lost. On many projects, some tasks invariably thwart the project manager and require 20% to 50% more time than projected. The project manager who has consulted with others (see Chapter 6, “Laying Out Your Plan,” and Chapter 7, “Assembling Your Plan”) and has engaged in both top-down and bottom-up planning perhaps can avoid such wide variances, but not always.
I Feel the Need, the Need for Speed
Along the critical path, adding more resources to the mix could shorten the overall time frame. If a friend helps Bill and Erika load up the car, a minute could be saved. This is not a dramatic example, but consider the impact of having one person help another move from one apartment to another. The addition of a second worker yields considerable time savings, especially in lifting bulky or heavy items that one person could not easily handle.
When additional resources are allocated for a particular task, this is called crashing, an odd name for a beneficial development. Crash time represents the least amount of time to accomplish a task or subtask with unlimited resources, such as all the equipment or all the funds you desire.
In Project Management, authors Meredith and Mantel estimate that on real-world projects, less than 10% of the total activities actually represent critical activities. Yet, examples of CPM often depict projects in which critical activities outnumber or outweigh noncritical ones!
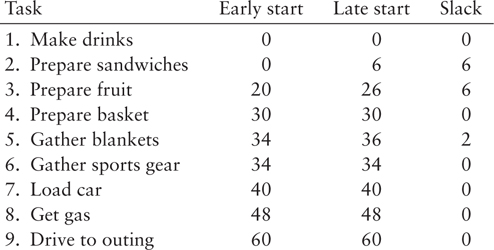
Most tasks have several subtasks associated with them. So, our CPM network depiction offers only a broad-brush view of a rather simple project. Examining Task 1 further, suppose that one of the subtasks involved is to add sugar. As Bill mixes up the drinks he adds a tablespoon of sugar and then he takes a drink. Is it sweet enough? His subjective answer will be yes or no.
If he concludes “not sweet enough,” then he has a new subtask: adding more sugar. He repeats the taste test and eventually concludes that the level of sweetness is on the mark. Only then does he pack up the drinks. This activity can be depicted by the flowchart in Figure 20.
FIGURE 20 Flowchart of “Make drinks” Task
If we incorporate the simple loop that we’ve created in this “make drinks” flowchart into the overall CPM chart depicted in Figure 18, we would have additional boxes, with additional lines, plus additional arrows emanating from Task 1, “Make drinks,” thus complicating our chart.
Likewise, other tasks could include associated subtasks which involve yes and no questions, and repeat loops, until a condition is satisfied. Repeat loops add more delays and increase the complexity of a CPM analysis.
Let’s Network
Expanding on the chart in the CPM network in Figure 18, a depiction of tasks and subtasks is called a network diagram, or configuration, or simply a network for short. Available project software tools greatly assist in this area.
When manually constructing the network for simple projects and concurrently enhancing your understanding of critical path charts, you’d sketch and resketch the network until you thought you had it right. Then you would bounce this off team members, challenge everybody’s assumptions, and ensure that you had not overlooked any tasks or sub-tasks that were vital to the project.
A link that indicates an association or relationship between two otherwise parallel tasks along a CPM network is called a dummy task or activity. Seasoned network diagrammers sometimes add a dummy activity that reveals the relationship between two events, even though no tasks are actually performed. Project management software enables you to apply many other charting options, and some can be quite handy.
Me and My Arrow
The activity-on-arrow CPM network is a useful variation to the chart depicting the CPM network and is shown in Figure 21.
FIGURE 21 Activity-on-arrow CPM network
Notice that the critical path line here is constant, starting from Task 1, proceeding to Task 9, while noncritical activities represent diversions off the critical path. Tasks are represented by the bars with arrows. (Thus, they’re called “activity-on-arrow.”) Events that represent the start or end of a task are depicted by circled numbers.
Gathering blankets, Task 6, leads to Event 6, which then is connected by a dummy task, as already described. This is depicted in the figure as an arrow with a broken line leading to Event 5. Of the two possible diagrams for CPM networks, either will suffice—it’s a personal preference.
Manually updating a CPM network when changes become evident, or when the estimated duration of a task needs to be altered, can be a true pain. With software, though, the updating is instantaneous, much like updating a cash flow analysis using spreadsheet software: You update some figures and, presto change-o, the monthly cash totals and even the year-end cash total change instantly to reflect the latest updates. With CPM, as you introduce new data into the system, a new critical path configuration immediately appears on your screen.
Don’t Fall in Love with the Technology
Mastery of charting processes can lead to problems, especially among technically oriented project managers. Project managers have been known to become enamored of technology. The tools at their disposal can seem intoxicating, if not addictive. Some project managers become overly smitten with the charts and printouts at the cost of
◾ Effective communication with stakeholders.
◾ Managing the project team.
◾ Serving as a liaison to top managers, executives, and stakeholders in general.
◾ Meeting the needs of the customer, who likely requires interim psychological stroking.
◾ Ensuring that the final desired outcome will be achieved.
Tellingly, many studies of managed projects reveal that the most frequent causes of failure are nontechnical, such as the lack of commitment among project team members, hidden political or personal agendas, or the project manager’s inability to effectively communicate project results (the subject of Chapter 13, “Reporting Results”).
◾ ◾ ◾
Employ work breakdown structures, Gantt charts, CPM, and the software packages about to be discussed, for they all have great worth. Keep your eye on the people-related dynamics of the project, however, since managing people well is the primary make-or-break factor for success.
QUICK RECAP
◾ Managing a project of five people is considerably more complex than managing a project involving only three. With each new person, or each new resource, many more lines of connectivity occur.
◾ Any given project follows a critical path, and a delay in any activity along that path delays the overall project.
◾ “Crashing” a project means allocating additional resources to a particular task, usually to complete it in less time than originally allotted.
◾ It’s easy to fall in love with the available charts and project management tools, though project failures are often actually a result of neglecting the human dynamic.