
Chapter 1
Thinking Like a Database
In This Chapter
![]() Examining traditional Excel limitations
Examining traditional Excel limitations
![]() Keeping up with database terminology
Keeping up with database terminology
![]() Looking into relationships
Looking into relationships
With the introduction of business intelligence (BI) tools such as Power Pivot and Power Query, it’s becoming increasingly important for Excel analysts to understand core database principles. Unlike traditional Excel concepts, where the approach to developing solutions is relatively intuitive, you need to have a basic understanding of database terminology and architecture in order to get the most benefit from Power Pivot and Power Query. This chapter introduces you to a handful of fundamental concepts that you should know before taking on the rest of this book.
Exploring the Limits of Excel and How Databases Help
Years of consulting experience have brought this humble author face to face with managers, accountants, and analysts who all have had to accept this simple fact: Their analytical needs had outgrown Excel. They all faced fundamental challenges that stemmed from one or more of Excel’s three problem areas: scalability, transparency of analytical processes, and separation of data and presentation.
Scalability
Scalability is the ability of an application to develop flexibly to meet growth and complexity requirements. In the context of this chapter, scalability refers to Excel’s ability to handle ever-increasing volumes of data. Most Excel aficionados are quick to point out that as of Excel 2007, you can place 1,048,576 rows of data into a single Excel worksheet — an overwhelming increase from the limitation of 65,536 rows imposed by previous versions of Excel. However, this increase in capacity does not solve all the scalability issues that inundate Excel.
Imagine that you’re working in a small company and using Excel to analyze its daily transactions. As time goes on, you build a robust process complete with all the formulas, pivot tables, and macros you need in order to analyze the data that is stored in your neatly maintained worksheet.
As the amount of data grows, you will first notice performance issues. The spreadsheet will become slow to load and then slow to calculate. Why does this happen? It has to do with the way Excel handles memory. When an Excel file is loaded, the entire file is loaded into RAM. Excel does this to allow for quick data processing and access. The drawback to this behavior is that every time the data in your spreadsheet changes, Excel has to reload the entire document into RAM. The net result in a large spreadsheet is that it takes a great deal of RAM to process even the smallest change. Eventually, every action you take in the gigantic worksheet is preceded by an excruciating wait.
Your pivot tables will require bigger pivot caches, almost doubling the Excel workbook’s file size. Eventually, the workbook will become too big to distribute easily. You may even consider breaking down the workbook into smaller workbooks (possibly one for each region). This causes you to duplicate your work.
In time, you may eventually reach the 1,048,576-row limit of the worksheet. What happens then? Do you start a new worksheet? How do you analyze two datasets on two different worksheets as one entity? Are your formulas still good? Will you have to write new macros?
These are all issues that need to be addressed.
Of course, you will also encounter the Excel power customers, who will find various clever ways to work around these limitations. In the end, though, these methods will always be simply workarounds. Eventually, even these power-customers will begin to think less about the most effective way to perform and present analysis of their data and more about how to make data “fit” into Excel without breaking their formulas and functions. Excel is flexible enough that a proficient customer can make most things fit just fine. However, when customers think only in terms of Excel, they’re undoubtedly limiting themselves, albeit in an incredibly functional way.
In addition, these capacity limitations often force Excel customers to have the data prepared for them. That is, someone else extracts large chunks of data from a large database and then aggregates and shapes the data for use in Excel. Should the serious analyst always be dependent on someone else for her data needs? What if an analyst could be given the tools to access vast quantities of data without being reliant on others to provide data? Could that analyst be more valuable to the organization? Could that analyst focus on the accuracy of the analysis and the quality of the presentation instead of routing Excel data maintenance?
A relational database system (such as Access or SQL Server) is a logical next step for the analyst who faces an ever-increasing data pool. Database systems don't usually have performance implications with large amounts of stored data, and are built to address large volumes of data. An analyst can then handle larger datasets without requiring the data to be summarized or prepared to fit into Excel. Also, if a process ever becomes more crucial to the organization and needs to be tracked in a more enterprise-acceptable environment, it will be easier to upgrade and scale up if that process is already in a relational database system.
Transparency of analytical processes
One of Excel’s most attractive features is its flexibility. Each individual cell can contain text, a number, a formula, or practically anything else the customer defines. Indeed, this is one of the fundamental reasons that Excel is an effective tool for data analysis. Customers can use named ranges, formulas, and macros to create an intricate system of interlocking calculations, linked cells, and formatted summaries that work together to create a final analysis.
So what is the problem? The problem is that there is no transparency of analytical processes. It is extremely difficult to determine what is actually going on in a spreadsheet. Anyone who has had to work with a spreadsheet created by someone else knows all too well the frustration that comes with deciphering the various gyrations of calculations and links being used to perform analysis. Small spreadsheets that are performing modest analysis are painful to decipher, and large, elaborate, multi-worksheet workbooks are virtually impossible to decode, often leaving you to start from scratch.
Compared to Excel, database systems might seem rigid, strict, and unwavering in their rules. However, all this rigidity comes with a benefit.
Because only certain actions are allowable, you can more easily come to understand what is being done within structured database objects such as queries or stored procedures. If a dataset is being edited, a number is being calculated, or any portion of the dataset is being affected as part of an analytical process, you can readily see that action by reviewing the query syntax or the stored procedure code. Indeed, in a relational database system, you never encounter hidden formulas, hidden cells, or dead named ranges.
Separation of data and presentation
Data should be separate from presentation; you don’t want the data to become too tied into any particular way of presenting it. For example, when you receive an invoice from a company, you don’t assume that the financial data on that invoice is the true source of your data. It is a presentation of your data. It can be presented to you in other manners and styles on charts or on websites, but such representations are never the actual source of the data.
What exactly does this concept have to do with Excel? People who perform data analysis with Excel tend, more often than not, to fuse the data, the analysis, and the presentation. For example, you often see an Excel workbook that has 12 worksheets, each representing a month. On each worksheet, data for that month is listed along with formulas, pivot tables, and summaries. What happens when you’re asked to provide a summary by quarter? Do you add more formulas and worksheets to consolidate the data on each of the month worksheets? The fundamental problem in this scenario is that the worksheets actually represent data values that are fused into the presentation of the analysis.
The point being made here is that data should not be tied to a particular presentation, no matter how apparently logical or useful it may be. However, in Excel, it happens all the time.
In addition, as discussed earlier in this chapter, because all manners and phases of analysis can be done directly within a spreadsheet, Excel cannot effectively provide adequate transparency to the analysis. Each cell has the potential to hold formulas, be hidden, and contain links to other cells. In Excel, this blurs the line between analysis and data, which makes it difficult to determine exactly what is going on in a spreadsheet. Moreover, it takes a great deal of effort in the way of manual maintenance to ensure that edits and unforeseen changes don’t affect previous analyses.
Relational database systems inherently separate analytical components into tables, queries, and reports. By separating these elements, databases make data less sensitive to changes and create a data analysis environment in which you can easily respond to new requests for analysis without destroying previous analyses.
You may find that you manipulate Excel’s functionalities to approximate this database behavior. If so, you must consider that if you’re using Excel’s functionality to make it behave like a database application, perhaps the real thing just might have something to offer. Utilizing databases for data storage and analytical needs would enhance overall data analysis and would allow Excel power-customers to focus on the presentation in their spreadsheets.
In these days of big data, customers demand more, not less, complex data analysis. Excel analysts will need to add tools to their repertoires to avoid being simply “spreadsheet mechanics.” Excel can be stretched to do just about anything, but maintaining such creative solutions can be a tedious manual task. You can be sure that the sexy aspect of data analysis does not lie in the routine data management within Excel; rather, it lies in leveraging BI Tools such as providing clients with the best solution for any situation.
Getting to Know Database Terminology
The terms database, table, record, field, and value indicate a hierarchy from largest to smallest. These same terms are used with virtually all database systems, so you should learn them well.
Databases
Generally, the word database is a computer term for a collection of information concerning a certain topic or business application. A database helps you organize this related information in a logical fashion for easy access and retrieval. Certain older database systems used the term database to describe individual tables. The current use of database applies to all elements of a database system.
Databases aren’t only for computers. Manual databases are sometimes referred to as manual filing systems or manual database systems. These filing systems usually consist of people, papers, folders, and filing cabinets — paper is the key to a manual database system. In a real-life manual database system, you probably have in-baskets and out-baskets and some type of formal filing method. You access information manually by opening a file cabinet, removing a file folder, and finding the correct piece of paper. Customers fill out paper forms for input, perhaps by using a keyboard to input information that is printed on forms. You find information by manually sorting the papers or by copying information from many papers to another piece of paper (or even into an Excel spreadsheet). You may use a spreadsheet or calculator to analyze the data or display it in new and interesting ways.
Tables
A database stores information in a carefully defined structure known as a table. A table is just a container for raw information (called data), similar to a folder in a manual filing system. Each table in a database contains information about a single entity, such as a person or product, and the data in the table is organized into rows and columns. A relational database system stores data in related tables. For example, a table containing employee data (names and addresses) may be related to a table containing payroll information (pay date, pay amount, and check number).
To use database wording, a table is an object. As you design and work with databases, it’s important to see each table as a unique entity and to see how each table relates to the other objects in the database.
In most database systems, you can view the contents of a table in a spreadsheet-like form called a datasheet, composed of rows and columns (known as records and fields, respectively — see the following section). Although a datasheet and a spreadsheet are superficially similar, a datasheet is quite a different type of object. You typically cannot make changes or add calculations directly within a table. Your interaction with tables will primarily come in the form of queries or views — see the later section “Queries”).
Records, fields, and values
A database table is divided into rows (called records) and columns (called fields), with the first row (the heading on top of each column) containing the names of the fields in the database.
Each row is a single record containing fields that are related to that record. In a manual system, the rows are individual forms (sheets of paper), and the fields are equivalent to the blank areas on a printed form that you fill in.
Each column is a field that includes many properties specifying the type of data contained within the field and how the database should handle the field’s data. These properties include the name of the field (Company) and the type of data in the field (Text). A field may include other properties as well. For example, the Address field’s Size property tells the database the maximum number of characters allowed for the address.
At the intersection of a record and a field is a value — the actual data element. For example, in a field named Company, a company name entered into that field would represent one data value.
 When working with Microsoft Access, the term field is used to refer to an attribute stored in a record. In many other database systems, including SQL Server, column is the expression you hear most often in place of field — field and column mean the same thing. The exact terminology that’s used relies somewhat on the context of the database system underlying the table containing the record.
Queries
Most relational database systems allow the creation of queries (sometimes called views). A query extracts information from the tables in the database; a query selects and defines a group of records that fulfill a certain condition. Most database outputs are based on queries that combine, filter, or sort data before it’s displayed. Queries are often called from other database objects, such as stored procedures, macros, or code modules. In addition to extracting data from tables, queries can be used to change, add, or delete database records.
An example of a query is when a person at the sales office tells the database, “Show me all customers, in alphabetical order by name, who are located in Massachusetts and who made a purchase over the past six months.” Or “Show me all customers who bought Chevrolet car models within the past six months, and display them sorted by customer name and then by sale date.”
Rather than ask the question using English words, a person uses a special syntax, such as Structured Query Language (or SQL), to communicate to the database what the query will need to do.
Understanding Relationships
After you understand the basic terminology of databases, it’s time to focus on one of their more useful features: A relationship is the mechanism by which separate tables are related to each other. You can think of a relationship as a VLOOKUP, in which you relate the data in one data range to the data in another data range using an index or a unique identifier. In databases, relationships do the same thing, but without the hassle of writing formulas.
Relationships are important because most of the data you work with fits into a multidimensional hierarchy of sorts. For example, you may have a table showing customers who buy products. These customers require invoices that have invoice numbers. Those invoices have multiple lines of transactions listing what they bought. A hierarchy exists there.
Now, in the one-dimensional spreadsheet world, this data typically would be stored in a flat table, like the one shown in Figure 1-1.
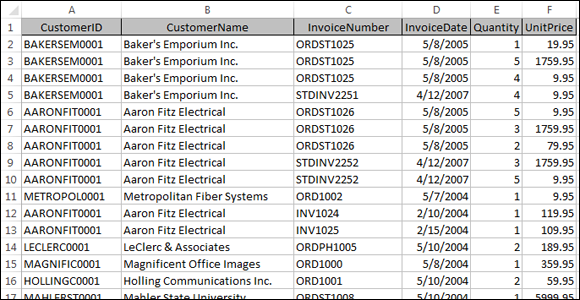
Figure 1-1: Data is stored in an Excel spreadsheet using a flat-table format.
Because customers have more than one invoice, the customer information (in this example, CustomerID and CustomerName) has to be repeated. This causes a problem when that data needs to be updated.
For example, imagine that the name of the company Aaron Fitz Electrical changes to Fitz and Sons Electrical. Looking at Figure 1-1, you see that multiple rows contain the old name. You would have to ensure that every row containing the old company name is updated to reflect the change. Any rows you miss will not correctly map back to the right customer.
Wouldn’t it be more logical and efficient to record the name and information of the customer only one time? Then, rather than have to write the same customer information repeatedly, you could simply have some form of customer reference number.
This is the idea behind relationships. You can separate customers from invoices, placing each in their own tables. Then you can use a unique identifier (such as CustomerID) to relate them together.
Figure 1-2 illustrates how this data would look in a relational database. The data would be split into three separate tables: Customers, InvoiceHeader, and InvoiceDetails. Each table would then be related using unique identifiers (CustomerID and InvoiceNumber, in this case).
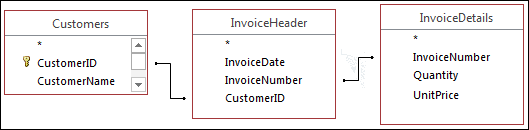
Figure 1-2: Databases use relationships to store data in unique tables and simply relate these tables to each other.
The Customers table would contain a unique record for each customer. That way, if you need to change a customer’s name, you would need to make the change in only that record. Of course, in real life, the Customers table would include other attributes, such as customer address, customer phone number, and customer start date. Any of these other attributes could also be easily stored and managed in the Customers table.
The most common relationship type is a one-to-many relationship. That is, for each record in one table, one record can be matched to many records in a separate table. For example, an invoice header table is related to an invoice detail table. The invoice header table has a unique identifier: Invoice Number. The invoice detail will use the Invoice Number for every record representing a detail of that particular invoice.
Another kind of relationship type is the one-to-one relationship: For each record in one table, one and only one matching record is in a different table. Data from different tables in a one-to-one relationship can technically be combined into a single table.
Finally, in a many-to-many relationship, records in both tables can have any number of matching records in the other table. For instance, a database at a bank may have a table of the various types of loans (home loan, car loan, and so on) and a table of customers. A customer can have many types of loans. Meanwhile, each type of loan can be granted to many customers.
If your head is spinning from all this database talk, don’t worry. You don’t need to be an expert database modeler to use Power Pivot. But it’s important to understand these concepts. The better you understand how data is stored and managed in databases, the more effectively you’ll leverage Power Pivot for reporting.