Chapter 3 The Ten Steps Process
I have been impressed with the urgency of doing.
Knowledge is not enough; we must apply.
Being willing is not enough; we must do.
– Leonardo da Vinci
In This Chapter
Step 1—Define Business Need and Approach
Step 2—Analyze Information Environment
Step 6—Develop Improvement Plans
Step 7—Prevent Future Data Errors
Step 8—Correct Current Data Errors
Step 10—Communicate Actions and Results
Introduction
Remember the map example at the beginning of Chapter 2? Maps come in different levels of detail and you will use those different levels depending on your needs at a particular moment. Suppose you are driving across the country. You might start with a high-level map of the country in which you are traveling (we will use the United States for our example here). You get an idea of the layout of the country, the number of states you will travel through, and the location of the cities in the various states, and you outline a plan to drive from your current location to your final destination.
Alternatively, you may decide that with the amount of time you have for the trip driving is not the best way to get to your location, so you book an airplane flight for the first leg of the journey. Once you arrive at your destination city, the U.S. and state maps do not help you get from the airport to your hotel. A different level of detail is needed, so you look at a street-level map.
All along the way, there are a number of approaches to get to your goal. You could plan the complete trip yourself, using maps and travel books to provide necessary information. You could ask friends and family who have taken similar trips in the past for suggestions. Or you could use a travel agent to plan the complete trip or just book the transportation. Once you reach your city, you could hire a tour guide for a specific activity. You might use GPS or an online map tool to provide step-by-step driving instructions.
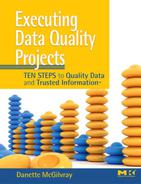
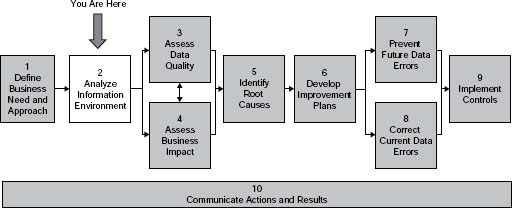
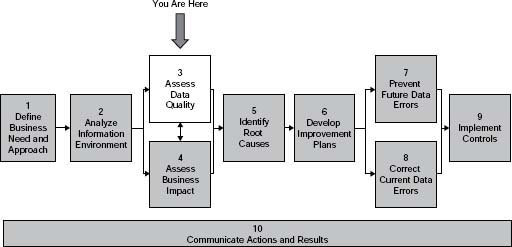
Think of The Ten Steps as your map (Figure 3.1). Apply them to meet your needs—with different combinations of steps and high-level or detailed instructions depending on your requirements at the time. The instructions, techniques, examples, and templates in the steps are meant to provide enough direction so you can understand your options. It is up to you to decide what is relevant and appropriate to your situation.
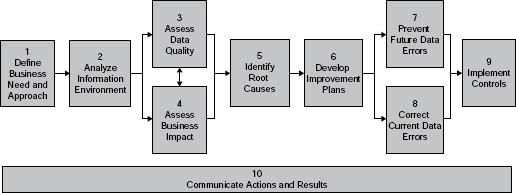
Figure 3.1 • The Ten Steps process.
Source: Copyright © 2005–2008 Danette McGilvray, Granite Falls Consulting, Inc.
The Ten Steps Conventions
As you know The Ten Steps process was introduced in Chapter 2. This chapter provides detailed instructions and examples for each of those steps. The Ten Steps conventions are described here:
You Are Here Graph—Each step (1–10) is introduced by the graph of The Ten Step process and an indication of where you are in it.
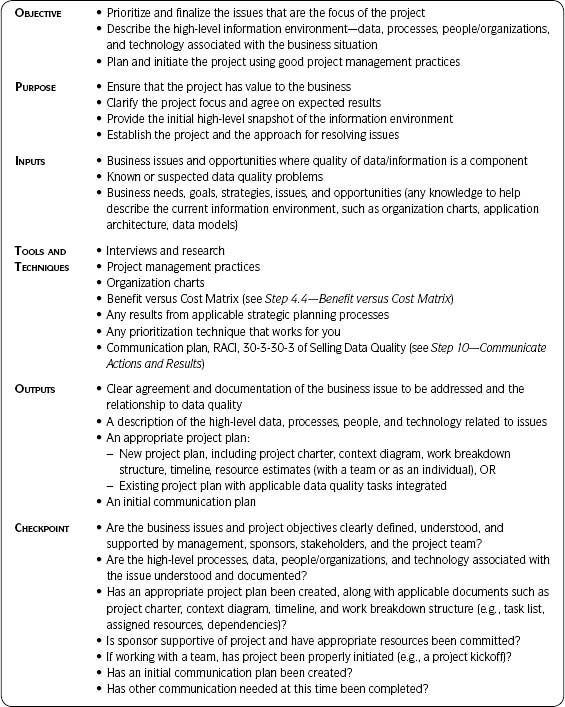
Step Summary Table—This table describes (for that step) the objective, purpose, inputs, tools and techniques, outputs, and checkpoint. See Table 3.1 for further detail.
Business Benefit and Context—This section contains background helpful for understanding the step and benefits from completing the step.
Approach—This section contains the step-by-step instructions for completing the step.
Sample Output and Templates—This section contains examples of forms and tables that projects can use to structure their own outputs.
Note that the first five steps of The Ten Steps also contain substeps and a further detailed process flow. The substeps are also presented according to the format of Business Benefit and Context, Approach, and Sample Output and Templates.
The Step Summary Table
The steps’ summary in Table 3.1 provides a quick reference to the main objectives, inputs, outputs, and checkpoints for each of the Ten Steps.
Table 3.1 • Step Summary Table Explained

Step 1 Define Business Need and Approach

Introduction
The importance of this step cannot be overstated. Business goals and strategies should drive all actions and decisions. Information-related projects should always start with the question, “Why is this important to the business?” Anything done with information should support the business in meeting its goals, and this step ensures that you are working on situations of importance to the business.
You may be focusing on issues (situations that are suboptimal) or opportunities (something new to be used to your advantage). This step shows how to implement the first section in the Framework for Information Quality—Business Goals/Strategy/Issues/Opportunities. (See the Framework for Information Quality section in Chapter 2.)
Businesses embarking on information and data quality improvement projects are often already aware of the issues affecting them most urgently. Step 1.1—Prioritize the Business Issue builds on that awareness and prioritizes the business issues or opportunities where data quality is suspected to be a major component. This is also where the information environment is described at a high level. The information environment comprises the data, processes, people/organizations, and technology associated with the issues to be addressed. Step 1.2—Plan the Project initiates the project to deal with the issues chosen.
Whether you are embarking on a data quality project with a team, focusing as an individual contributor on one data quality issue for which you are responsible, or integrating data quality activities into another project or methodology, this step is critical. Many a project has failed because of misunderstanding between those involved (sponsors, management, teams, business, IT, etc.). Don’t let lack of clarity regarding what will be accomplished and why keep your project from succeeding.
Effective planning is essential to the successful execution of any project, and defining the business need and approach provides the necessary focus for your project activities (see Table 3.2). I’m a big believer in taking enough planning time to ensure that you are looking at those issues or opportunities worth investing in and in good project management planning.
Kimberly Wiefling, in Scrappy Project Management™: The 12 Predictable and Avoidable Pitfalls Every Project Faces, puts it well when she says, “Just enough planning to optimize results. Not a drop more! … But not a drop less either.”
Table 3.2 • Step Summary Table Explained
Step 1.1 Prioritize the Business Issue
Business Benefit and Context
Your project should only spend time on those issues where you expect to get results worth the time and money spent. In many cases there will be several issues or opportunities from which you will have to choose. You need to prioritize where to focus your efforts. There are multiple ways to prioritize issues, and this step mentions just one. If you have a favorite technique for prioritization, use it here. If you are already very clear about the business issues or opportunities to address, you only need to document and confirm agreement on the data quality issues your project will address before devising your project plan.
Who should be involved in this step? A draft list of the issues should be created by the responsible management and project manager. (Remember, if you are working on a data quality issue yourself you are the project manager and the project team in one.) Ensure that appropriate stakeholders are engaged.
A stakeholder is a person or group with a direct interest, involvement, or investment in the information quality work. Stakeholders are those “actively involved in the project or those whose interests may be positively or negatively affected by execution or completion of the project and its deliverables.”1 For example, the person responsible for manufacturing processes would be a stakeholder for any data quality improvements that impact the supply chain. Stakeholders may also exert influence over the project and its deliverables. Examples of stakeholders include customers, project sponsors, the public, or organizations whose personnel are most directly involved in doing the work of the project.
The list of stakeholders may be long or short depending on the expected scope of the project. The point is that stakeholders must agree on the business issue that will be addressed by the data quality project.
Approach
1. List the specific issues or problems.
Focus on those data quality issues deemed critical—based on what you know at this time.
Consider issues or opportunities in the following areas:
Lost revenue and missed opportunities—where revenue could increase if the data quality issue were addressed—for example, increasing the products or services purchased because the customer information was correct and therefore more customers were able to be contacted. Put another way, the customer did not get the chance or choice of doing business with your company because they were never contacted as a result of incorrect address, phone, or email data.
Lost business—where your company once had a customer or vendor, but they chose not to do business with you because of some type of problem where data quality was a contributing factor. For example, the inability to ship products correctly may influence the customer to work with another company. The inability to pay invoices in a timely manner may influence the vendor to refuse to provide parts, materials, or supplies to your company.
Unnecessary or excessive costs—where the company incurs costs due to wasted time and materials from rework, data correction, cost to recover lost business, impact to processes, and so forth. For example, manufacturing stops because materials were not ordered and available in a timely fashion due to incorrect inventory data.
Catastrophe—where poor data quality contributed to disastrous results such as legal repercussions, loss of property, or loss of life.
Increased risk—where data quality issues increase risk to your company. Examples are compliance and security failures due to poor-quality data or exposure to credit risks when purchases by one customer are associated with duplicate customer master records, causing the credit limit for that customer to be exceeded.
Shared processes and shared data—where several business processes share the same information, and quality problems in the data impact all of them; or one key business process central to the organization is affected by the lack of good data quality. For example, supplier (or vendor) master records impact the ability to quickly place an order with your supplier and also impact the timely payment of that supplier’s invoices. If your company only interfaces with its customer via the website, then the quality of information presented on the website is of critical importance.
2. Indicate the basis of each issue.
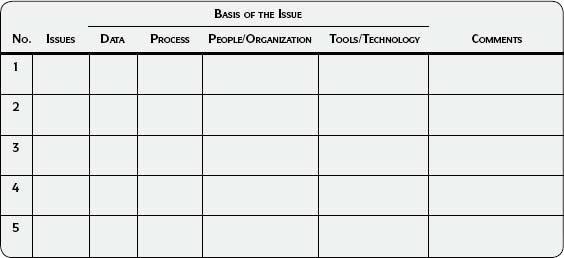
Based on what you know now, indicate if the basis of each issue is data, processes, people/organizations, and/or technology. Brainstorm and capture your ideas about importance and precedence. Use the Issue Capture Worksheet (Template 3.1) in the Sample Output and Templates section at the end of this step.
3. Discuss and prioritize the issues.
Choose the issues in which you suspect data quality to be a large component and contributing factor. Use your favorite technique for prioritizing, or you may want to use Step 4.4—Benefit versus Cost Matrix to determine which issue should be the focus of your project. Invite data and process stakeholders to contribute their concerns and perspectives.
4. Identify the associated data, processes, people/organizations, and technology associated with the issue(s) chosen.
Answer the following questions:
- Which business processes are impacted?
- Who are the people or organizations involved?
- Which data subject areas are impacted?
- Where do the data reside (i.e., applications, systems, databases involved)?
- Are there other tools associated with the issue?
Sample Output and Templates
There are many ways to capture and prioritize issues. The Issue Capture Worksheet (Template 3.1) is one simple example of capturing and categorizing business issues at this early stage of the project.
Template 3.1 • Issue Capture Worksheet
Step 1.2 Plan the Project
Business Benefit and Context
Using good project management techniques is essential to the success of any project. The intent of this step is not to teach project management in detail, but to show how to use project management skills as they relate to data quality. If you are new to project management, there are many books, articles, conferences, and websites devoted to this topic. Effective planning is essential to the successful execution of an information improvement project, and defining the business need and approach will provide the necessary focus for the improvement activities.
Approach
1. Identify the steps from The Ten Steps process needed to meet the business need.
Does the sponsor need a high-level assessment to seek further funding/support? Study your environment and business context. Are there specific items that need to be assessed?
2. Create a project charter.
Create a project charter that is “right-sized” for your project. See the Project Charter template (Template 3.2) in the Sample Output and Templates section of this step.
3. Create a high-level context diagram.
Visually describe the high-level data, processes, people/organizations, and technology involved. A picture is really worth a thousand words at this point. A good context diagram is very useful for communicating the scope of the project.
4. Develop a project plan and timeline.
Use The Ten Steps process to plan your project and work breakdown structure. Choose the appropriate steps and techniques for your individual work or for a data quality project. Choose the appropriate steps and techniques if incorporating into another methodology or project, and ensure that the activities are integrated into it.
5. Use other good project management practices.
For example, create a template and process for tracking action items and issues. See the Tracking Issues/Action Items template (Template 3.3) in the Sample Output and Templates section of this step.
6. Create your initial communication plan.
See Step 10—Communicate Actions and Results.
7. Document all information gathered in Step 1—Define Business Need and Approach.
8. Confirm and ensure
- Management support
- Approval for the project
- Resources committed to the project
9. Kickoff!
Sample Output and Templates
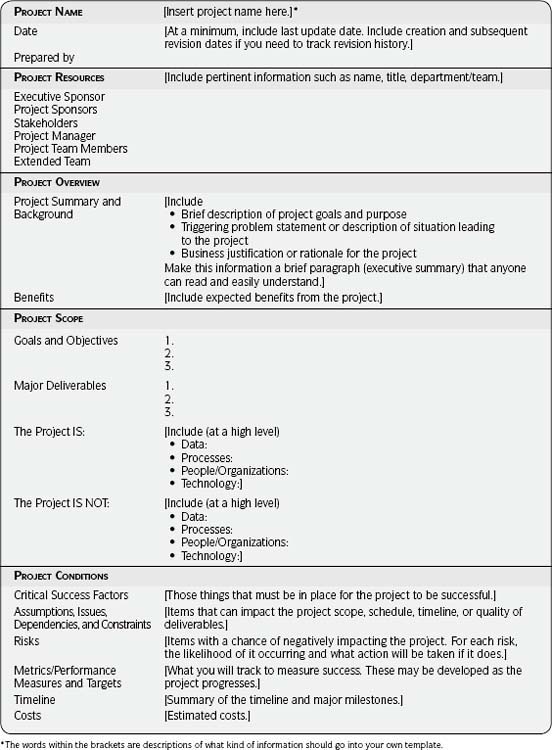
Project Charter
If your company does not have a required template for project charters, use Template 3.2 as a starting point. Discard those sections that do not apply and add sections relevant to your situation. Try to keep the charter to one to two pages. You may need a more detailed project charter than the one shown in Template 3.2. If you do, maintain a one-to two-page summary version and update it throughout the project to provide an at-a-glance view that anyone involved with the project should see. Refer to the summary for content when summarizing your project in various communications. Even if you are an individual, spend 30–60 minutes considering these categories for yourself—it will provide a basis for discussion with your manager to ensure that you are both in agreement as to your activities and goals.
Template 3.2 • Project Charter
Template 3.3 • Tracking Issues/Action Items

Action Items
Use your preferred method for tracking action items throughout the project. The Tracking Issues/Action Items template (Template 3.3) shows one option. This template also works well in a spreadsheet format. Keep one sheet for open action items. As the items are closed, move to a different sheet. That way you can easily see all open items and all closed items in their respective sheets.
Step 1 Summary
Determining your business need and approach sets the foundation for all future data quality activities. All projects require some level of prioritization and planning—whether as a focused data quality project, as an individual contributor implementing ideas yourself to support your own job responsibilities, or if integrating data quality into another project or methodology.
Completing this step at the right level of detail and focusing on what is relevant and appropriate are critical. If you ignore this step or do it poorly, you have already guaranteed failure, no more than partial success, or lots of time and effort focusing on the wrong thing. But if you do it well, you have a springboard for a successful project and the real opportunity to bring value to your organization.
![]() Communicate
Communicate
Here are a few ideas for communicating at this point in the project:
![]() If working with a project team, communicate with and get support from IT and business management, sponsors, stakeholders, and team members.
If working with a project team, communicate with and get support from IT and business management, sponsors, stakeholders, and team members.
![]() If integrating data quality activities into another project or methodology, communicate closely with the project manager and ensure that the tasks are integrated into the project plan and known by team members.
If integrating data quality activities into another project or methodology, communicate closely with the project manager and ensure that the tasks are integrated into the project plan and known by team members.
![]() If working on a specific data quality issue yourself, clarify with your manager that you both agree on the focus of your project.
If working on a specific data quality issue yourself, clarify with your manager that you both agree on the focus of your project.
![]() Use your one- to two-page project charter as input to your communications.
Use your one- to two-page project charter as input to your communications.
![]() Create a draft of your communication plan.
Create a draft of your communication plan.
![]() Checkpoint
Checkpoint
Step 1—Define Business Need and Approach
How can I tell whether I’m ready to move to the next step? Following are guidelines to determine completeness of the step:
![]() Are the business issues and project objectives clearly defined, understood, and supported by management, sponsors, stakeholders, and the project team?
Are the business issues and project objectives clearly defined, understood, and supported by management, sponsors, stakeholders, and the project team?
![]() Are the high-level processes, data, people/organizations, and technology associated with the issue understood and documented?
Are the high-level processes, data, people/organizations, and technology associated with the issue understood and documented?
![]() Has an appropriate project plan been created, along with applicable documents such as a project charter, context diagram, timeline, and work breakdown structure (i.e., task list, assigned resources, dependencies)?
Has an appropriate project plan been created, along with applicable documents such as a project charter, context diagram, timeline, and work breakdown structure (i.e., task list, assigned resources, dependencies)?
![]() Is the sponsor supportive of the project and have the appropriate resources been committed?
Is the sponsor supportive of the project and have the appropriate resources been committed?
![]() If working with a project team, has the project been properly initiated (e.g., a project kickoff)?
If working with a project team, has the project been properly initiated (e.g., a project kickoff)?
![]() Has an initial communication plan been created?
Has an initial communication plan been created?
![]() Has other communication needed at this time been completed?
Has other communication needed at this time been completed?
Step 2 Analyze Information Environment
Introduction
This is the step at which you first put on your investigator hat (see figure above and Table 3.3 on page 78). Whether you relate to Sherlock Holmes or CSI (Crime Scene Investigation), the common theme is using techniques to solve a mystery. Solving the “Case of Poor Data Quality” requires interpreting clues that can only be uncovered by investigating the information environment.
Read Chapter 2 before starting this step. The concepts combined with the process (Steps 2.1–2.7) will help you understand what can often be a complex environment. When you understand the environment you will do better analysis and make better decisions on where to focus as you continue throughout your project.
The natural inclination is to skip this step and jump right into data quality assessment. However, completing Step 2—Analyze Information Environment ensures that the data extracted and assessed are the data associated with the business issue. Otherwise, it is not unusual to find that data have to be extracted multiple times before getting the data you really need. Analyzing the information environment will usually be more in-depth for a data quality assessment than for a business impact assessment.
![]() Key Concept
Key Concept
Step 2—Analyze Information Environment provides a foundation of understanding that will be used throughout the project:
- Ensures that you are assessing the relevant data associated with the business issue.
- Provides an understanding of requirements—the specifications against which data quality is compared.
- Provides a context for understanding the results of the data assessments and helps in root causes analysis. The more you understand the context and the environment that affect the data, the better you will understand what you see when you assess the data.
- Provides an understanding of the processes, people/organizations, and technology that affect the quality and/or value of the data.
- Allows you to develop a realistic data capture and assessment plan.
For business impact assessments, focus on the Apply phase of the Information Life Cycle POSMAD. Spend enough time on this step to link the business issues so there is confidence that a detailed impact assessment will focus in the right areas.
No matter what type of assessment is next in your project, everything learned in this step will help you interpret your results after completing your assessments, find root causes, and identify people with the knowledge that should be included in the project.
![]() Warning
Warning
If you are going to assess data quality in any depth, avoid wasting time and money by resisting the temptation to immediately start extracting and analyzing data. Immediately extracting without understanding the information environment often results in multiple extracts and rework before you get to the actual data relevant to the business issue.
Spend just enough time in Step 2 to understand your information environment so you can ensure that the data being assessed for data quality and the information being assessed for business impact are actually related to the business issue to be resolved.
There are seven substeps within Step 2. The flow of this step is shown in Figure 3.2 on page 80. Use Step 2—Analyze Information Environment to
- Understand relevant requirements—Not understanding requirements is often a factor in data quality problems.
- Understand relevant data, processes, people/organizations, and technology—the four key components in the Framework for Information Quality.
- Document the Information Life Cycle—in which you combine the data, processes, people/organizations, and technology to define and understand the life cycle through the POSMAD phases.
- Develop a realistic data capture and assessment plan—based on your background investigation.
IMPORTANT!!! Each of the substeps in Step 2 are interrelated. Start with the area in which you have the most information or with which you are most familiar (requirements, data, process, people/organizations, or technology) and work out from there in any order until you have obtained the relevant information at the appropriate level of detail. Define the Information Life Cycle and Design Data Capture and Assessment Plan will most likely be the last steps, as they require understanding from the previous steps.
You will make many choices along the way about what is relevant to the business issues. Table 3.4 (see page 80) discusses three extremely important questions you need to consider throughout the life of your project: What is relevant? What is appropriate? What is the right level of detail? The answers to these questions will impact where you focus your efforts, how much time is spent, and the nature of your results. Make rapid decisions based on what you know at the time and move on. If circumstances change or new knowledge comes to light, you can make adjustments from there.
Table 3.3 • Step 2—Analyze Information Environment


Table 3.4 • Learning to Scope
What is relevant? What is appropriate? What is the right level of detail?
Determining what is relevant, what is appropriate, and what is the right level of detail needed to meet your objectives is important throughout The Ten Steps process. Using good judgment regarding these three ideas starts in Step 2—Analyze the Information Environment. Use the following information to help:
Relevant—in this context means that what you are looking at is associated with the business issue to be resolved. Focus on that issue.
Human Element—As you explore the business issue, you may find that the problem is broader than you imagined. This can feel overwhelming. Thinking about what is relevant helps you to narrow your focus to the business issue at hand.
Manageable—If the scope is too broad, can you focus on specific parts of an issue and build upon results?
Appropriate—Choosing the applicable steps from The Ten Steps process and understanding the key components and other factors affecting information quality and the Information Life Cycle at the suitable level of detail.
Level of Detail—The level of detail required for each step will vary depending on the business needs and your project scope. Start at a high level and work to lower levels of detail only if useful.
Questions to Ask:
- Will the detail have a significant and demonstrable bearing on the business issue?
- Will the detail provide evidence to prove or disprove a hypothesis about the quality of the data?
Use your best judgment and move on:
As you proceed throughout the step and the rest of the methodology, if you find that more information is needed, gather more detail at that time. You will be most successful if you implement this step as an iterative process.
You will uncover many items of interest. On one project team we gave each other permission at any time to ask, “Are we going down a rat hole?” This was the signal to stop and ask ourselves if the level of detail or item of interest was relevant to the business issue. If yes, we agreed to spend more time. If no, we refocused our efforts on the activities and analysis that kept our eyes on the business issue. This method helped us stay on track and use our time well.
Spend enough time to get the foundational information needed to proceed effectively. Don’t skip this step, but don’t get too far into detail that may be unnecessary. You can always come back later and get additional detail if needed.
Step 2.1 Understand Relevant Requirements
Business Benefit and Context
Requirements indicate those things necessary for the business to succeed, such as processes, security, or technology. Some requirements may be external—those with which the business is obligated to comply, such as privacy, legal, governmental, regulatory, and industry. Because the data should support compliance with all these requirements, it is important to understand them as soon as possible in the project.
![]() Key Concept
Key Concept
As Olson notes in Data Profiling: The Accuracy Dimension: “You cannot tell if something is wrong unless you can define what being right is.”
– Jack E. Olson
Approach
1. Gather requirements.
Ensure that the requirements are relevant to the business issues, associated data, and data specifications necessary for compliance with them. Consider requirements in the following areas: business, technology, legal, contractual, industry, internal policies, privacy, security, compliance, and regulatory. You may need to contact your company’s finance, legal, or other departments for help.
Use the Requirements Gathering template (Template 3.4) as a starting point to capture requirements and pertinent information.
Following is a sampling of regulatory and legal requirements that impact data or require high levels of data quality in order to achieve compliance2:
- The National Data Privacy Law
- Federal credit laws
- Federal privacy and information security laws (e.g., HIPAA)
- State laws
- Data laws affecting the Indian Business Process Outsourcing (BPO) industry
- The California Security Breach Notification Law
- The Sarbanes-Oxley Act of 2002
- The Data Quality Act
- The U.S.A. Patriot Act
- The Corporate Information Security Accountability Act of 2003
2. Identify constraints.
Identify any constraints such as security, permissions, or access to data that may impact your project.
3. Analyze the requirements gathered.
Look at the various requirements for the same information, for the same organizations, and so on. These requirements will eventually need to turn into detailed data specifications to ensure that the data support adherence to them.
You will eventually need to detail how to comply with requirements from a data quality point of view. This can take place in Step 2.2—Understand Relevant Data and Specifications or in Step 3—Assess Data Quality. Also see the section Projects and The Ten Steps in Chapter 4 for suggestions on including data quality requirements gathering as part of the project life cycle.
4. Document results.
In your project documentation, list the requirements and constraints that will affect your project, and make action items to address them. Start tracking analysis results. See the Analyze and Document Results section in Chapter 5 for a template to help you track results.
Sample Output and Templates
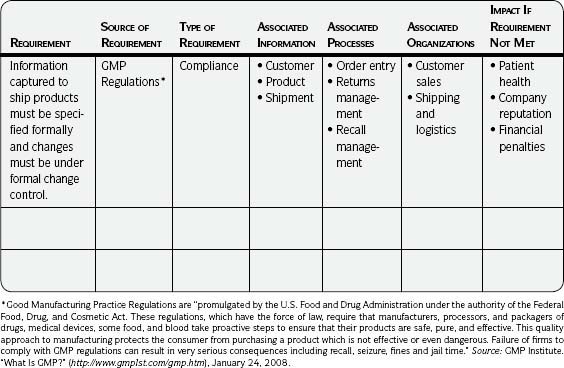
Following are explanations of the information to insert into the Requirements Gathering template (Template 3.4):
Requirement—Title and brief description.
Source of Requirement—The person who provided the information along with the specific source such as a particular law or internal policy.
Type of Requirement—Business, technology, legal, contractual, industry, internal policies, privacy, security, compliance, or regulatory. (Other categories may apply to your situation; discuss a meaningful way to categorize them.)
Associated Information—Information that must be in place in order to comply with the requirement OR the information itself that must comply with the requirement (if the requirement specifies the information).
Associated Processes—Processes in place when the information is collected or used. (You may decide to expand to processes that impact the information throughout the POSMAD life cycle at some point.)
Associated Organizations—Organizations, teams, departments, and the like, impacted by the requirement.
Impact If Requirement Not Met—The result if the requirement is not met: legal action, risk of fines, and the like. (Be as specific as possible with what is known at this time. This will drive decisions if trade-offs need to be made based on resources and time, or if there are conflicting requirements.)
Template 3.4 • Requirements Gathering
Step 2.2 Understand Relevant Data and Specifications
Business Benefit and Context
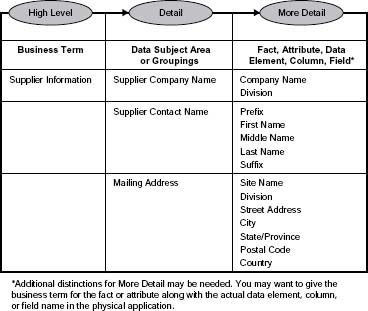
In this step you will identify in detail the data and the related data specifications relevant to the business issue. (See the Data Specifications section in Chapter 2 for more information.) The step will help you ensure that the data you assess for quality or business impact are the same information the business is concerned with. Data and information can be described at a high level by common business terms or by data subject areas or groupings. These subject areas or groupings can be further broken down to the detail of field names.3
Figure 3.3 illustrates different levels of data detail. The business terms are usually related to how the business sees and thinks about the information. The most detailed are the actual tables and fields where the data are stored. In between are the data subject areas or groupings. It is critical that the information terms used by the business are linked to the actual data to be assessed.
![]() Best Practice
Best Practice
Use Information Already Available: You may expect that 80 percent of what is asked for in Step 2—Analyze Information Environment already exists. The value of this step is in bringing together existing knowledge in such a way that you can understand it better now than you did before.
You may start with the business terms or data subject areas relevant to the business issue. Then move to the detail of where the data are stored. Conversely, if you are more familiar with the fields where the data are stored, start with those terms. Trace fields in the database back to the business terms if you start with the database elements. This step is closely related to Step 2.3—Understand Relevant Technology; you may want to complete these two steps in parallel.
Approach
1. Identify the business terms and data subject areas or groupings relevant to the business issue and associated requirements.
- Capture the language used by the business through interviews, evaluation of documents, and examination of current system screens.
- Understand and document the data model, entities, and relationships, with a focus on what is relevant to the business issue and at the appropriate level of detail. A good data modeler is a valuable resource. Find one, get him or her on your project, and make use of his or her expertise!
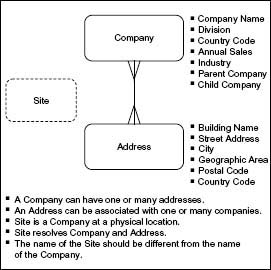
The data model should be captured at one or both of the first two levels of abstraction as described in Table 2.5 in Chapter 2. Figure 3.4 shows an example of a context model that is useful for providing an overview of the scope of your assessment. In addition, a detailed conceptual model can be useful to show system scope, processes that can and cannot be supported because data do or do not exist, and related business rules. At a minimum, you need to know relationships at a very high level. This is yet another case when you will have to use your judgment as to the level of detail needed at this time. If there is no data model, developing one should be one of the first items on your recommendations list.
2. Identify the systems/applications/databases where the data are used and the corresponding databases where the data are stored.
This activity is closely related to Step 2.3—Understand Relevant Technology.
3. Correlate the business terms or data subject areas with the specific fields that store the data in the database.
See the example in Figure 3.3. The business terms will most likely be associated with how the information is applied; the more detailed terms, with where the data are stored. This is a key activity to ensure that the data you will be assessing are actually the data the business cares about.
4. Create a detailed data list for the data of interest.
See the Detailed Data List template (Template 3.5) in the Sample Output and Templates section of this step. Include all data that you may assess. Even if you actually assess only a subset of the data, it is easier to collect them all at this time. If you already have this information documented in another format, use that. Remember, the goal is to have a clear understanding of the data you plan to assess—not to put it in the exact format shown as an example.
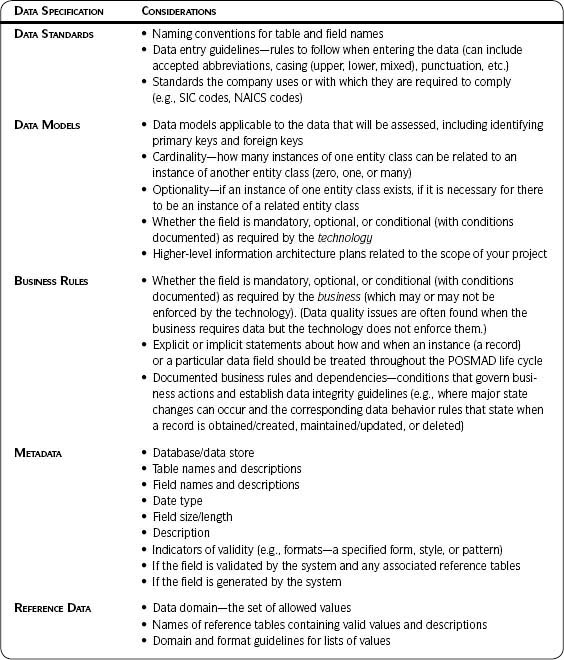
5. Collect relevant data specifications for each of the fields of interest.
See the section Data Specifications in Chapter 2 for more detail. Describe the data standards, data models, business rules, metadata and reference data, and other pertinent information known at this time. See Table 3.5 in the Sample Output and Templates section for examples.
Data specifications can be obtained from the following:
- Relevant requirements gathered in Step 2.1—Understand Relevant Requirements. (You may need to create specifications, such as detailed business rules and associated data quality checks, to support those requirements.)
- People knowledgeable about the data: business analysts, data analysts, data modelers, developers, database administrators (DBAs), and the like. Remember subject matter experts and knowledge workers applying the information in the course of their work, especially for business rules.
- Descriptions of the data available in existing data dictionaries, metadata repositories, or other documentation forms
- A relational database directory or catalog for data in a relational system for metadata on the column-level layout of the data
- Other sources that give you the layout that best represents the data according to the most likely extraction method
- A COBOL copybook or a PL/1 INCLUDE file that lays out the data if accessing an IMS or VSAM data source
- Interface definitions to application programs that feed data to the data source
- Structural information within the database management system (For example, in relational systems you can extract primary key, foreign key, and other referential constraint information.)
- Any TRIGGER or STORED PROCEDURE logic embedded within the relational system to find data-filtering and validation rules being enforced
- The program specification block (PSB) in IMS, which gives insight into the hierarchical structure being enforced by IMS
6. Understand and document the relevant data model, entities, and relationships.
Understand the data model, focusing on what is relevant to the business issue at the appropriate level of detail. Use and understand a detailed data model if available. As suggested previously, make a good data modeler a member of your project team.
The data model can show the system’s scope, processes that can and cannot be supported because data do or do not exist, and business rules supported by it. You may need to simplify a detailed model when speaking with those in the business. At a minimum, you need to know data relationships at a very high level.
7. If more than one data store is being assessed and compared, create a detailed data list for each one.
Once you have a detailed data list for each of the data stores, map the fields in each data store to the corresponding fields in the others. See the Data Mapping template (Template 3.6, page 89) in the Sample Output and Templates section of this step.
![]() Best Practice
Best Practice
Source-to-Target Mappings: You may be including source-to-target mapping activities in another project (such as a data migration). If so, document what you know about the mappings at this point. You will increase their quality and the speed at which they can be completed if you profile your data. See Step 3.2—Data Integrity Fundamentals for techniques to help you assess data for the purpose of mapping. You will confirm or change anything that you suspect about the mappings after you have completed your profiling.
8. Document additional information needed for the assessment.
See the Capture Data section in Chapter 5 for more information. Include what you know at this point for each of the data populations:
- Population to be assessed and associated selection criteria
- Output format needed for the assessment
- Anything you know about the sampling method
- Timing for extracts
- Anything else applicable and known now
All of these will be refined as needed in Step 2.7—Design Data Capture and Assessment Plan and finalized just before the data are extracted for the various quality and value assessments in Step 3 and Step 4.
9. Document any potential effects on data quality or business impacts recognized at this time.
For example, do you anticipate any problems with permissions and access to the data you want to assess?
If you haven’t already started systematically tracking results, do so now. See the Analyze and Document Results section in Chapter 5 for a template to help you do this. Remember, anything learned in Step 2 is valuable input to your data quality or business impact assessments.
Sample Output and Templates
Use the Detailed Data List template (Template 3.5), to document the data of interest. Use the suggestions in Table 3.5 when collecting relevant data specifications for the data to be assessed.
Template 3.5 • Detailed Data List
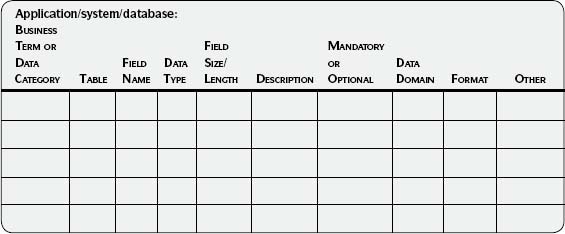
Table 3.5 • Collecting Data Specifications

Template 3.6 • Data Mapping
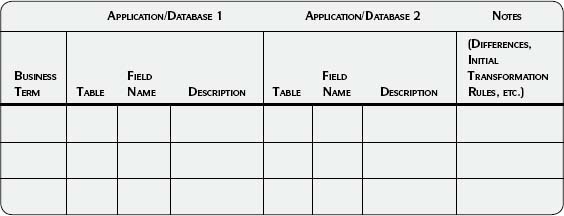
Use the Data Mapping template (Template 3.6) as a starting point if you will be assessing data in more than one application or database or if you are creating source-to-target mappings as part of another project.
Step 2.3 Understand Relevant Technology
Business Benefit and Context
Much of the information about technology will be discovered in the course of understanding the relevant data and specifications. This step is included to ensure that other technology is considered besides the obvious technology of the database where the data are stored. You may want to consider technology involved throughout the POSMAD life cycle—for example, any networks or messaging technology involved with sharing the data.
![]() Definition
Definition
Technology can be both high tech, such as databases, and low tech, such as paper copies. Examples are forms, applications, databases, files, programs, code, or media that store, share, or manipulate the data, are involved with the processes, or are used by people and organizations.
There are different levels of detail for technology (see Figure 3.5). If preparing for a data quality assessment, understanding technology related to the data at a table and field level will usually be required. If preparing for a business impact assessment, knowing an application and database may provide enough information to proceed.
This step is closely related to Step 2.2—Understand Relevant Data and Specifications. You may want to complete both steps in parallel.
Approach
1. Understand and document the technical environment.
Understand the applications and associated data stores. A data store is a repository for data, such as a relational database, an XML document, a file, or file repository, or a hierarchical database (LDAP, IMS).
For each type of technology understand the name of the software (the common name used by the business and the “legal name” used by the vendor if a third-party package), the version in use, the teams responsible for supporting the technology, the platform, and so forth.
You may need to understand the technology associated with sharing the data, such as networks or an enterprise service bus. Look at supporting technology throughout the POSMAD life cycle.
2. Make use of already-existing documentation and knowledge from Information Technology (IT) resources.
Those with a background in IT may be familiar with four data operations known as CRUD (Create, Read, Update, and Delete). CRUD indicates the four basic data operations—that is, how the data are processed in the technology. Many IT resources will relate to the CRUD point of view and you can learn valuable information about the POSMAD life cycle by discussing it in terms with which they are familiar. (It’s also a good idea to make them aware of the life cycle.)
If you are focusing on a business impact assessment, see how many programs relate to the Read phase of CRUD. This can also give you an idea of how the information is being applied.
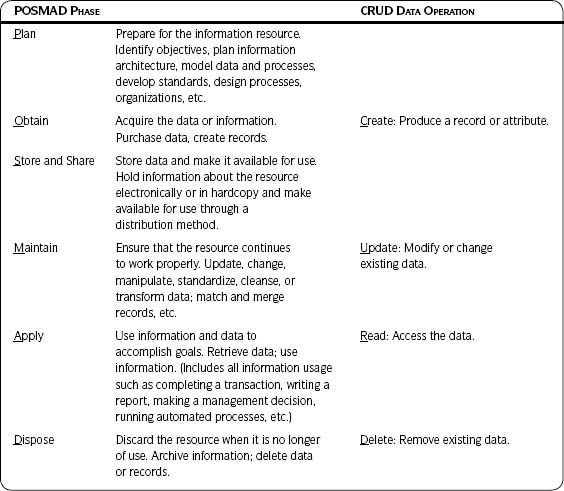
Table 3.6 maps the six phases of the POSMAD life cycle to the four data operations (CRUD). It also illustrates how technology is just one aspect to be considered when understanding the Information Life Cycle.
Understanding how the POSMAD phases map to the data operations will help in tracing potential causes of data quality problems within the application—for example, if an issue is found during the Maintain phase when a knowledge worker is changing a record, a starting point for investigating possible technical causes would be the application’s update programs.
Table 3.6 • Mapping the POSMAD Life Cycle to CRUD Data Operations
3. Capture any impact to data quality that can be seen through understanding the technology.
For example, data may be moved between data stores using some kind of messaging technology. Mapping or transformation of the data takes place to put the data in alignment with the format required for messaging. Any time you have these changes you increase your chances of negatively impacting data quality.
You may also be looking ahead at the types of data quality assessments you will be conducting. Do you anticipate the need to purchase any tools to help in the assessments? What is the cost and lead time for purchase? What training will be needed? (See the Data Quality Tools section in Chapter 5 for a summary of data quality tools.)
4. Document results.
Capture any insights, observations, potential impacts to the business or to data quality, and initial recommendations as a result of this step. If you haven’t already created a form for tracking results, see the section Analyze and Document Results in Chapter 5 for a template to help you get started.
Step 2.4 Understand Relevant Processes
Business Benefit and Context
Focus on the processes that affect the quality of data and information throughout the six phases of the POSMAD life cycle—Plan, Obtain, Store and Share, Apply, and Dispose. (See the Information Life Cycle section in Chapter 2 for more detail.)
A quality assessment may look at some or all phases of the Information Life Cycle since the quality of the data is affected by activity within any of the six phases. A value assessment focuses on the Apply phase—those processes that apply and use the information. Applying the data means any use to accomplish business objectives.
For example, the data may be used to complete a transaction or it may be in the form of a report to support decision making. The data may also be used by an automated program such as electronic funds transfer where money is pulled from a customer’s account on the date a payment is due. Some may consider this IT use (and it is), but it is also a process on which the business depends.
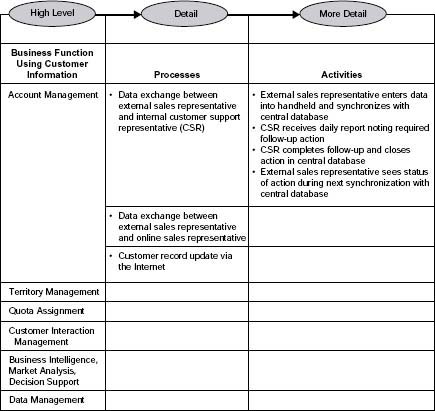
As with data, technology, and people and organizations, there are different levels of detail for processes. See Figure 3.6 for an example of an account management process. Only go to the level of detail necessary to explore the business need you are addressing.
Approach
1. List and identify processes at the appropriate level of detail.
Refer to the high-level business functions and processes described in Step 1—Define Business Need and Approach. Use these as your starting point.
Functions—Major high-level areas of the business organization (Sales, Marketing, Finance, Manufacturing, etc.) or high-level areas of responsibility (lead generation, vendor management, etc.).
Processes—Activities or procedures executed to accomplish business functions (e.g., “External sales rep enters customer data into handheld and synchronizes with central database” is one activity relating to the account management function). Processes can also be activities that trigger a response by the business (e.g., “Customer sends request for more information via company website”).
Function versus process is a relative relationship, with function being higher level and process being more detailed. What could be called a function in one project may be a process in another. Determine which level of process detail is most helpful at this time for your project.
![]() Best Practice
Best Practice
To determine relevance ask
- Which processes are affected by the business issue?
- Which processes impact the data relevant to the issue?
2. Determine the business functions and processes within scope.
List and describe those functions and processes associated with the business issue, the data, the technology, and the people/organizations within the scope of your project. Account for the activities throughout the Information Life Cycle at the level of detail to meet your needs. Research and use existing documentation related to the processes of interest.
3. Relate the relevant data to the relevant business processes and indicate the life cycle phase or data operation taking place.
This can be done by creating a Business Process/Data Interaction Matrix. There are examples of two levels of detail in the Sample
Output and Templates section at the end of this step. Table 3.7 shows the interaction between business functions and data groupings. An X indicates where data are applied or used, but no further detail is provided.
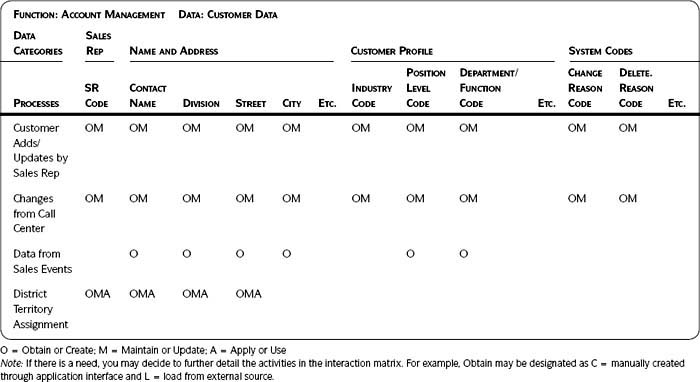
Table 3.8 on page 97 uses one of the business functions, account management, from Table 3.7 and indicates which account management processes obtain, maintain, and apply the specific data. (Note that they chose to include only three of the six POSMAD life cycle phases.) You may need both or only one level of detail to understand your data. Using a matrix is just one approach.
4. Analyze and document results.
Look for patterns of similarities and differences across the rows and down the columns. For instance, in Table 3.8 there are four processes that obtain the data but only three that maintain them. Since data from sales events only result in adding records, there is a possibility that duplicates could be created. All processes that obtain and maintain data should be similar and training should be instituted to encourage consistency in data entry.
![]() Key Concept
Key Concept
Be aware that the actual output of the substeps in Step 2—Analyze Information Environment may take a different form than in the examples shown. For instance, for Step 2.4—Understand Relevant Processes, the output shown is in the form of a matrix. However, the output is not really a matrix; the output is knowledge about the processes and related data, how they interact, and how that interaction can impact data quality. Your output may physically take the form of a matrix, a diagram, or a textual explanation. The format used should enhance understanding. It is the learning that comes out of completing a step that is important. This applies to all steps.
Capture lessons learned, impact to the business, potential impact to data quality and/or value, and initial recommendations learned from analyzing processes.
Sample Output and Templates
In Table 3.7 an X indicates where data are applied or used during the associated business function. The function account management is further described in Table 3.8.
Table 3.7 • High-Level Function/Data Interaction Matrix: Business Functions That Use Customer Information
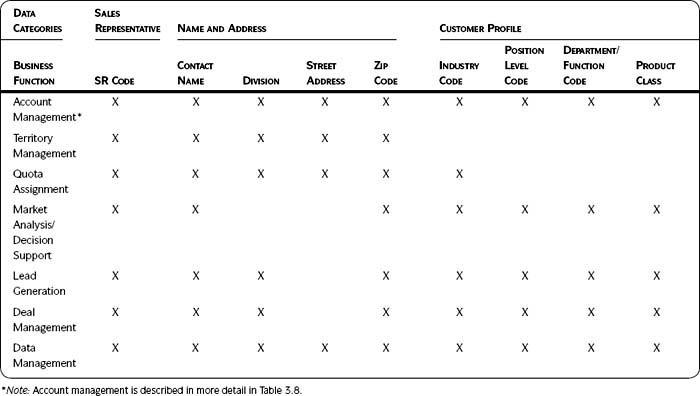
Table 3.8 • Detailed Process/Data Interaction Matrix: Account Management Processes That Obtain, Maintain, or Apply Customer Information
Step 2.5 Understand Relevant People/Organizations
Business Benefit and Context
The purpose of this task is to understand people and organizations as they affect information quality and value. Choose the appropriate level of detail needed to meet your business needs (see Figure 3.7). Understanding organizations at a group/team/department level may be sufficient; knowing roles, titles, and job responsibilities may be necessary. At some point, knowing the individuals who fulfill roles of interest, along with pertinent contact information, may be needed as well. Remember, you can look at a higher level the first time through and go back for more detail later.
Connect Information Quality to Roles
Information roles fit into the POSMAD life cycle, and understanding the connection will lead you to people who can provide input to the project and impact to the data. Table 3.9 describes concepts about information roles that affect information quality. Understanding the concepts can help you look for people within your company who fit the descriptions.
Approach
1. Identify appropriate people and organizations.
Look at organizations, teams, roles, responsibilities, or individuals throughout the Information Life Cycle. Identify the various groups utilizing information relevant to your business issue. Gather and use existing documentation such as organization charts and job descriptions.
2. Relate the data to be assessed to the people and organizations.
An interaction matrix can be used to show how the various roles impact each of the data subject areas or fields. (See the example in Table 3.10 of this step.) The goal is to understand how the people and organizations impact the data or information. Use your best judgment as to the level of detail for both the people/organization axis and the data axis.
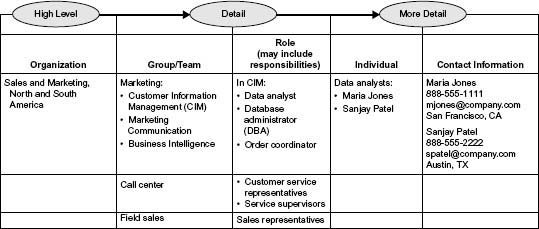
Table 3.9 • Information Quality Roles and POSMAD


3. Analyze and document results.
In Table 3.10, look at the rows across and the columns going down for similarities and differences. For example, one project team knew that many departments could apply or use the data, but they thought that only one could create or update them. Through this exercise the team found that people in other departments actually had the ability to create and update data as well. They could immediately see the impact to data quality: There were no consistent standards for entering data across the departments. Initial recommendations included looking at the organization to determine if it was appropriate to have create and update ability distributed across departments or if it should be centralized in one. At a minimum, all teams creating and updating data should have training.
![]() Best Practice
Best Practice
Identify Allies and Advocates: If you can identify people who may be suffering from data quality problems, they can be good advocates and sources of information to support many of your project activities.
Document lessons learned, potential impact to data quality and to the business, potential root causes, and initial recommendations in your results tracking sheet.
Table 3.10 • Role/Data Interaction Matrix

Step 2.6 Define the Information Life Cycle
Business Benefit and Context
In this activity, you will describe the flow of the Information Life Cycle POSMAD from planning or creation to disposal. The goal is to represent and summarize the life cycle by bringing together what you have learned about the data, processes, people/organizations, and technology. Focus on the POSMAD phases that apply to your business issue—Plan, Obtain, Store and Share, Maintain, Apply, and Dispose.
Understanding the Information Life Cycle is important to
- A quality assessment—All of the POSMAD phases affect the quality of the data. Your quality assessment will focus on those phases relevant to your business issues; therefore, you may choose to focus on only a few of the phases during your quality assessment.
- A business impact assessment—You will focus on the Apply phase—value is only received when the information is retrieved, applied, and used.
- An understanding of how the data currently flows—so you can better determine what to look at for each type of assessment.
The Information Life Cycle can be used to
- Develop new processes. Use the steps, techniques, and concepts to help you create a new life cycle that produces quality data, prevents quality problems, and increases the value of the information by promoting its use.
- Review current processes for improvement. This will show gaps, unexpected complexity, problem areas, redundant activities, and unnecessary loops.
- Further identify and improve key control activities needed. This will show where simplification and standardization may be possible and where to minimize complexity and redundancy (therefore minimizing cost) and maximize the use of the information (therefore maximizing value).
- Determine if associated people/organizations, technology, and data have been accounted for.
See Framework for Information Quality and Information Life Cycle sections in Chapter 2 for more background on the Information Life Cycle.
![]() Key Concept
Key Concept
The business receives value from information only during the POSMAD life cycle Apply phase—when information is retrieved, applied, and used.
Approach
1. Determine the scope of the Information Life Cycle.
If your project is for an initial assessment, depict the Information Life Cycle as it is currently, not as it should be. The life cycle will help show gaps, duplicate work, and inefficiencies that could be affecting the quality of information. You can use the “as is” view of the life cycle at a later time to change or improve it. If you are improving processes or creating new ones, create an Information Life Cycle that will fulfill your data quality and business needs.
Focus on the business issue affected by the information. You may be interested in the Information Life Cycle for a specific data subject area or for information used in a particular business process.
If a process/data matrix was created earlier (see Step 2.4—Understand Relevant Processes) look for pieces of information that have similar entries for the various data operations as one life cycle. Each type of information—for example, customer name and address or inquiries—could have a separate life cycle of its own.
2. Determine the appropriate level of detail for the life cycle.
Determine the level of detail needed to understand the process and identify problem areas. Your life cycle may be a simple high-level flowchart showing only sufficient information to understand the general process flow. Or it might be very detailed to show every action and decision point. If you are unsure which level is appropriate, start out at a high level and add detail later or only where it is needed.
3. Determine the approach for illustrating and documenting the life cycle.
Various methods for depicting the life cycle have been used successfully. For example, some process flows use a swim lane approach; others use a table approach. The approach you use will be influenced by the level of detail and the scope of your life cycle. (See the Information Life Cycle Approaches section in Chapter 5 for details, templates, and examples.)
4. Determine the steps in the life cycle and sequence them.
One technique is to write the life cycle steps on sticky notes or large index cards so they can be moved as the life cycle is developed. Place notes on a whiteboard and move them around until you are satisfied with the sequence and dependencies. This allows you to easily make changes as you go along. (Refer to the outputs from the previous substeps in Step 2—Analyze Information Environment.)
5. Document the life cycle.
Record the life cycle in a tool such as Visio or PowerPoint. Your company may have other tools available that will allow reuse. Remember to label and identify your work. Include the title of your process, the date the life cycle was created, any needed definitions or explanation, and so forth.
6. Analyze the life cycle.
The Information Life Cycle will show gaps, unexpected complexity, problem areas, redundancy, and unnecessary loops. It will also show where simplification and standardization may be possible. Note the hand-offs between operations. These are areas where there is potential for error, thus affecting the quality of the data. For example, the life cycle may show that more than one team is maintaining the same data. This is important to know so the business can determine if this is still the best organizational model. If so, the business will want to ensure that both groups receive the same training in data entry, updating, and the like. If the organizational model, roles, or responsibilities should be changed, the life cycle can help the business understand possible alternatives and serve as a high-level checklist to make sure various processes are being covered in the reorganization or realignment of duties.
If reviewed on a periodic basis, the Information Life Cycle will provide a systematic way to detect change. The life cycle can be used to answer the following questions:
- Has the process changed?
- Did any of the tasks change?
- Did the timing change?
- Did the roles change?
- Did any of the people filling the roles change?
- Did the technology change?
- Did the data requirements change?
- What impact do the changes have on the quality of information?
7. Document the results, lessons learned, possible impact to data quality and the business, and preliminary recommendations.
Capture what you have learned to this point. (See the Analyze and Document Results section in Chapter 5.) After the quality and/or value assessments have been completed, one of the recommendations may be to return to this step to create and implement a more effective life cycle.
Sample Output and Templates
See the Information Life Cycle Approaches section in Chapter 5 for ways to represent your life cycle.
Step 2.7 Design Data Capture and Assessment Plan
Business Benefit and Context
Based on what you have learned so far in this step, you are now ready to design how you will capture and assess the data. Capturing the data refers to either extracting them (such as to a flat file) or accessing them in some manner (such as via a direct connect to a database).
Approach
1. If needed, further prioritize the data to be assessed to fit within your project scope, schedule, and resources.
2. Finalize the population to be assessed and describe the selection criteria.
3. Develop the plan for data capture. Include:
- Data access method and tools required (For example, is there a front-end application currently in use that can provide the needed access or files?)
- Output format (For example, extract to a flat file, copy tables to a test server.)
- Sampling method
- Timing (Coordinate extracts across multiple platforms.)
- People who will be involved with the data extraction and assessment activities
Be sure to refer to the Capture Data section and Table 5.2 in Chapter 5 for additional information to help complete this step.
4. Develop the sequence for your data assessment.
5. Document the plan and ensure that those involved are aware of and agree to their responsibilities.
Step 2 Summary
Before starting on Step 2, you already knew something about your data, something about your processes, something about your technology, and something about your people and organizations. This step gave you the chance to bring together existing knowledge in such a way that you now better understand all these components and their impact on information quality. You delved into more detail when necessary and uncovered gaps where additional information needed to be gathered. This step gave you the opportunity to see all of this knowledge in new ways, and you have made (and will continue to make) better decisions about information quality because of it.
The main deliverables from Step 2—Analyze Information Environment include:
- Data capture and data quality assessment plan
- Results of analyzing the information environment
- Documentation with lessons learned (such as impact to the business, potential impact to data quality, suspected root causes, and initial recommendations discovered to this point)
Additional outputs that will be used during your assessments include
- Detailed data list
- Data specifications (enough detail to understand the structure and relationships of the data so data can be extracted correctly and assessment results can be interpreted)
- Detailed data mapping (if assessing more than one application/database or if source-to-target mappings for migrating data are needed)
- Requirements
- Information roles and their descriptions
- Information Life Cycle (at the level of detail appropriate to your needs)
- Updates to your communication plan
Tracking of results was mentioned at the end of every substep within Step 2. Take the time now to organize your thoughts and document your results if you have not yet done so. (If I mention it enough times you might actually do it!) Documentation gives you the ability to easily recall results. It provides a reminder of things to look out for when conducting your assessments—you will prove or disprove the opinions about the data you have acquired as part of analyzing your information environment. Documenting your observations and theories as they are discovered will save you time when uncovering root causes and developing specific improvement recommendations and actions.
![]() Communicate
Communicate
![]() Have management, business, and stakeholders been appropriately apprised of project progress?
Have management, business, and stakeholders been appropriately apprised of project progress?
![]() Are periodic status reports being sent?
Are periodic status reports being sent?
![]() Are all members of the project team aware of progress and of the reasons for the project?
Are all members of the project team aware of progress and of the reasons for the project?
![]() Checkpoint
Checkpoint
Step 2—Analyze Information Environment
How can I tell whether I’m ready to move to the next step? Following are guidelines to determine completeness of the step:
![]() Has the information environment (the relevant data, processes, people/organizations, and technology) been analyzed at the appropriate level of detail to support the project goals?
Has the information environment (the relevant data, processes, people/organizations, and technology) been analyzed at the appropriate level of detail to support the project goals?
![]() Has the Information Life Cycle been documented at the appropriate level of detail?
Has the Information Life Cycle been documented at the appropriate level of detail?
![]() Have resources needed for assessments been identified and committed?
Have resources needed for assessments been identified and committed?
![]() If conducting a data quality assessment:
If conducting a data quality assessment:
- Have requirements, detailed data lists and mappings, and data specifications been finalized?
- Have any problems with permissions and access to data been identified?
- Is there a need to purchase any tools?
- Have training needs been identified?
- Has the data capture and assessment plan been completed and documented (including the definition of the data population to be captured and the selection criteria)?
![]() If conducting a business impact assessment:
If conducting a business impact assessment:
- Have the data quality and business issues been understood and linked sufficiently that there is confidence a detailed business impact assessment will focus in the right areas?
- Are the business processes, people/organizations, and technology related to the Apply phase of the Information Life Cycle clearly understood and documented?
![]() Have analysis results, lessons learned, and initial root causes been documented?
Have analysis results, lessons learned, and initial root causes been documented?
![]() Has the communication plan been updated?
Has the communication plan been updated?
![]() Has communication needed at this point been completed?
Has communication needed at this point been completed?
Step 3 Assess Data Quality
Introduction
You have been introduced to data quality dimensions—aspects or features of information and a way to classify information and data quality needs. Dimensions are used to define, measure, and manage the quality of the data and information. (See the Data Quality Dimensions section in Chapter 2 if you need a reminder.) As noted in Table 3.11, Step 3—Assess Data Quality provides one substep with detailed instructions for each of the 12 dimensions of quality listed in Table 3.12 (see page 111). The assessments provide a picture of the actual quality of your data and information.
The most rewarding benefit of the data quality dimension assessment will be concrete evidence of the problems that underlie the business issue you identified in Step 1—Define Business Need and Approach. The assessment results also provide background information needed to investigate root causes, correct data errors, and prevent future data errors.
If by chance you decided to skip Step 2, please reconsider! Every successful project has needed to analyze the information environment in some form or another. Feedback from project teams confirms that analyzing the information environment is essential before quality assessments and is needed to ensure meaningful results. Start at a high level of detail and work down only if needed. It is much more efficient to get at least some background prior to your quality assessment.
Approach to Step 3
The overall approach to Step 3 is straightforward: First, make a conscious decision about which dimensions to assess; second, complete the assessments for the dimensions chosen; and third, synthesize the results from your assessments (if more than one data quality assessment is performed).
Choose the Data Quality Dimensions to Assess
Familiarize yourself with the various data quality dimensions and what is required to complete an assessment for each one. Revisit your project goals and the output from Step 1—Define Business Need and Approach. Ensure that the business situation and needs have not changed. If the needs have changed, make a deliberate decision to modify your data quality approach to meet the new needs and ensure that everyone involved is informed and supportive of the modifications.
Prioritize and finalize the appropriate quality tests to be performed. If you are considering several dimensions and need to minimize the scope to meet your timeline, prioritize the tests that will return the most value. Any investment in assessing data quality will yield valuable results, the long-term benefit will only be realized when the root causes of the issues found during the assessment have been addressed.
Assess Quality for the Dimensions Chosen
Become familiar with the details of each quality dimension chosen. Review and finalize the data capture and assessment plan from Step 2.7—Design Data Capture and Assessment Plan. You may need to modify the plan based on your current scope, timeline, and resources. You will need a data capture and assessment plan for each of the quality dimensions chosen. Use the detailed instructions for each dimension to help you complete its quality assessment.
Document the lessons learned, possible impact to the business, root causes, and preliminary recommendations from each quality assessment. (See the Analyze and Document Results section in Chapter 5.) Capture these results throughout the project, not just at the end. Almost everyone has had the experience where the team has a very productive working session, results are analyzed, and good ideas about root causes or impact to the business are discovered—but no one documents what was learned. Two weeks later everyone remembers the good meeting, but can’t remember the details. In the worst case that knowledge is lost and at a minimum time has to be spent to recover what was already learned. Capture those flashes of insight when they appear!
![]() Best Practice
Best Practice
Document results throughout the project, not just at the end. Use the template in the Analyze and Document Results section in Chapter 5 to get started. This will ensure that the knowledge and insight learned during each step are retained. It will save you time when specific recommendations and action plans are prepared.
Synthesize Results from Completed Quality Assessments
Combine and analyze the results from all of the quality assessments. Look for correlations among them. For example, if you conducted a survey of the knowledge workers’ perceptions of data quality, do those perceptions match the actual quality results from other dimensions assessed? Interpret the combined results and tie them into the original business issues. (See the Analyze and Document Results section in Chapter 5 for suggestions.) Document the lessons learned, possible impact to the business, root causes, and preliminary recommendations from all quality assessments performed.
Table 3.11 • Step 3—Assess Data Quality
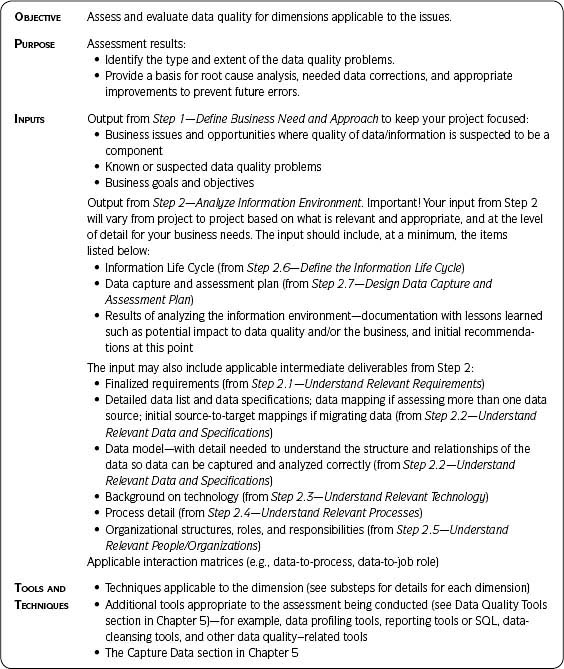
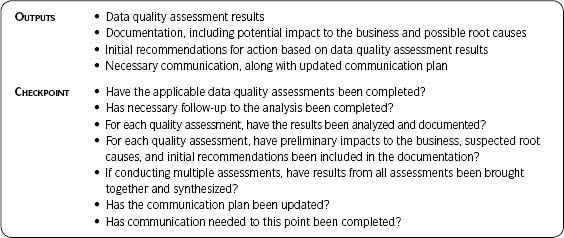
Table 3.12 • Data Quality Dimensions

Determine how the results of the quality assessment(s) will impact the rest of the project. Estimating the full project timeline before the assessment is difficult. The reason is that until you actually assess the data, you don’t know how large a problem you may have. What you find in Step 3—Assess Data Quality will impact the time needed for the remaining steps. Once completed you have actual results to determine your next steps and how they will affect the project scope, timeline, and resources needed.
Frequently Asked Questions about Data Quality Dimensions
Do Multiple Data Quality Dimensions Make Assessments more Complicated?
Having multiple dimensions actually makes the assessments less complex because you can
- Match actions against a business priority—choose only those dimensions that support the priority
- Perform tasks in the most effective order—assess dimensions in the most useful sequence with the result of
- A better defined and managed sequence of activities within time and resource constraints
- An understanding of what you will and will not get from the various quality assessments
How Do I Choose Which Dimensions of Quality to Assess?
When choosing dimensions of quality to assess, ask yourself these questions:
- Should I assess the data? Only spend time testing when you expect the results to give you actionable information related to your business needs.
- Can I assess the data? Is it possible or practical to look at this quality dimension? Sometimes you cannot assess/test the data, or the cost to do so is prohibitive.
Only assess those dimensions when you can answer yes to both questions! If you need help prioritizing, a useful technique can be found in Step 4.4—Benefit versus Cost Matrix. Table 3.25 (page 180) in the Sample Output and Templates section of that step lists decisions resulting from the use of the matrix to prioritize the data quality dimensions to be assessed. Don’t make this too difficult. Simply list each quality dimension, quickly determine the possible benefit to the business (high to low) and estimated/perceived effort (high to low), and map to the matrix. Don’t do in-depth research—make your best judgment based on what you know now.
The costs associated with assessing data quality dimensions can vary widely, depending on the dimension you choose to assess and whether you will use third-party data profiling or data cleansing tools. The best way to decide which dimensions to assess is to balance your business need against the resources available. Document the dimensions chosen, the rationale behind the decision, and the assumptions on which the decision was made.
Any Suggestions Regarding Which Dimensions to Assess First?
You will have already collected requirements in Step 2—Analyze Information Environment (see Step 2.1—Understand Relevant Requirements). Those requirements form the basis of Step 3.1—Data Specifications. You will need to take higherlevel requirements and turn them into the more detailed data specifications (or match them to already existing specifications) to ensure that you will be able to interpret the results of your data quality assessments. If you have concerns that the data specifications are missing or incomplete, you may want to start with Step 3.1.
In practice, at this point most people are ready to look at the actual data and do not want to spend time on more specifications and requirements. If you really can’t convince the team otherwise, at least have a minimum level of specifications and add to that as you go through your other assessments. If you begin data quality assessments with no requirements, just realize that the analysis will take longer as you gather the specifications needed to interpret your results.
It will not be unusual to find that poor-quality data specifications and business rules end up being one of the root causes of the data quality problems you find when assessing the other dimensions. Once you have proven the need for good data specifications, you can come back to this dimension. However, if you are fortunate enough to have support to start with data specifications, by all means do so!
Once you have your data specifications (at whatever level of detail), it is strongly recommended that you start with Step 3.2—Data Integrity Fundamentals. These are fundamental measures of validity, structure, and content, and data profiling is a technique often employed here. If you don’t know anything else about your data, you need to know what this dimension provides. Often people will say they are really interested in accuracy or in understanding levels of duplication. Even if that is your end goal, you should still profile your data first.
For example, to determine duplication you have to understand which data field or combination of data fields indicates uniqueness. If you do not know the basic completeness (or fill rate) and content of each of the data elements, you can develop an algorithm for determining duplication based on fields that are missing the data expected or that contain data you didn’t know were there. These situations lead to incorrect duplication assessment results.
Another valid approach is to conduct a survey of the knowledge workers first (Step 3.10—Perception, Relevance, and Trust) and use its results to prioritize other data quality dimensions. Still, once you start looking at the actual data, you should begin with the data integrity fundamentals and build from there.
![]() Best Practice
Best Practice
Save yourself rework! Most data quality dimensions require information found in the Data Integrity Fundamentals dimension (Step 3.2). Therefore, you will save yourself time if you start there. Once Step 3.2 is completed, move on to any other quality dimensions that address your business concerns.
One accurate measurement is worth a thousand expert opinions.
– Grace Hopper (1906–1992)
Admiral, U.S. Navy
Step 3.1 Data Specifications
Business Benefit and Context
An assessment of the Data Specifications dimension refers to a focused effort to collect and evaluate specifications and rules. You want to know if they exist, if and where they are documented, and their quality. (See the Data Specifications section in Chapter 2 for an introduction to this topic.) Data specifications provide the context for interpreting the results of your data quality assessments and provide instructions for manually entering data, designing data load programs, updating information, and developing applications.
![]() Definition
Definition
Data specifications measure the existence, completeness, quality, and documentation of data standards, data models, business rules, metadata, and reference data.
There are various ways you can apply this step:
- Gather data specifications for use in the other data quality dimensions—to provide input to data quality tests that should be conducted and to provide a standard against which to compare other data quality assessment results.
- Assess the quality of the data specifications themselves—data standards, data models, business rules, metadata, and reference data. Nonexistent or poor-quality data specifications themselves are often a cause of data quality problems.
- Assess the quality of the documentation of the data specifications—if that documentation is available, accessible, and easy to understand. Documentation quality can also be a cause of data quality problems.
When preparing for any quality assessments, you will collect at least a minimum amount of information about data specifications. This could have been completed in Step 2.1—Understand Relevant Requirements and Step 2.2—Understand Relevant Data and Specifications. Use the work done in those steps as a starting point here.
This step may be as simple as ensuring that the associated reference data are identified and will be extracted as part of your data integrity fundamentals assessment. Or it may be an in-depth articulation of business rules with which to test data being migrated as part of an ERP implementation.
Approach
1. Determine the scope of your data specifications assessment.
Decide if you will gather specifications for use in other assessments, assess the quality of the specifications themselves, or assess the quality of the specification documentation. (See Template 3.7, Data Specifications Scope, in the Sample Output and Templates section for guidance.) Apply the remaining process steps depending on your scope.
2. Develop and execute a process for gathering or creating data specifications.
If the specifications exist, which ones will be gathered? Who will collect them and by when?
If the specifications do not exist, which ones specifically need to be written or created? Who will write them and by when? This is the place where you can take higher-level requirements and turn them into more detailed instructions as they apply to your data.
In either case, in what format do the specifications need to be documented? Who will be using them for other data quality dimensions and how will they be used?
3. Develop and execute a process for evaluating the quality of the data specifications.
Determine your source of reference for comparison—Will you be comparing your data specifications within the database itself, to organizational-unit or enterprise-wide specifications, or to other sources of reference external to your company? For example, you may use ISO (International Standards Organization) codes as the source of reference for some of your domain values.
If a definitive enterprise-wide standard does not exist, look for common databases used in your particular part of the business—for example, a standard for Sales and Marketing databases. Is there a regional or worldwide data warehouse or data store that is used by several business groups that could be considered a source of reference for data specifications, such as naming standards?
Determine who will do the evaluation—Appropriate reviewers are internal auditors, data management, or data quality professionals from within the business unit whose data are being assessed. Reviewers could also come from outside the business unit. A reviewer must not have a vested interest in the specifications being reviewed—for example, he or she should not be the creator of the data definition.
Complete the data specification assessment—Use Table 3.13 in the Sample Output and Templates section for things to consider when evaluating the quality of data specifications.
4. Develop and execute a process for evaluating the quality of the documentation.
Determine who will do the evaluation of the documentation and when. Gather or gain access to the various documentation items. Complete the evaluation. (See Table 3.14 in the Sample Output and Templates section for considerations when assessing documentation quality.)
5. Analyze results of the data specifications and documentation quality assessments.
Most results will be qualitative, such as an opinion of the quality of the documentation and how that impacts the quality of the data. For example, you can expect the data to be entered inconsistently if data entry standards have not been updated in five years or if the documentation is not easily available to those doing the data entry, or if you find conflicts in data entry standards from team to team. That expected inconsistency is something to look for when assessing the quality of the data itself.
Quantify the results, if possible, such as by reporting percentage of specifications that conform to standards or percentage of existing versus expected specifications.
Does what was learned in this step impact your project timeline, resources needed, or deliverables? If so, how? Has that been communicated?
6. Track the progress of gathering or creating data specifications.
Ensure that the work is progressing according to schedule and that the documented specifications meet expectations. (Refer to Table 3.13 to help you create high-quality data specifications.)
7. Document results and recommended actions.
Highlight specifications that you will want to test in other data quality dimensions to prove or disprove assumptions. Include what was learned, potential impacts to data quality and the business, initial root causes, and preliminary recommendations.
Sample Output and Templates
This is the starting point for determining the scope of your data specifications efforts (refer to Template 3.7, Data Specifications Scope).
Table 3.13 contains a list of examples to consider when evaluating the quality of existing data specifications or when creating new ones. Table 3.14 lists things to consider when assessing the quality of current data specification documentation or when creating new documentation.
Table 3.13 • Data Specification Quality
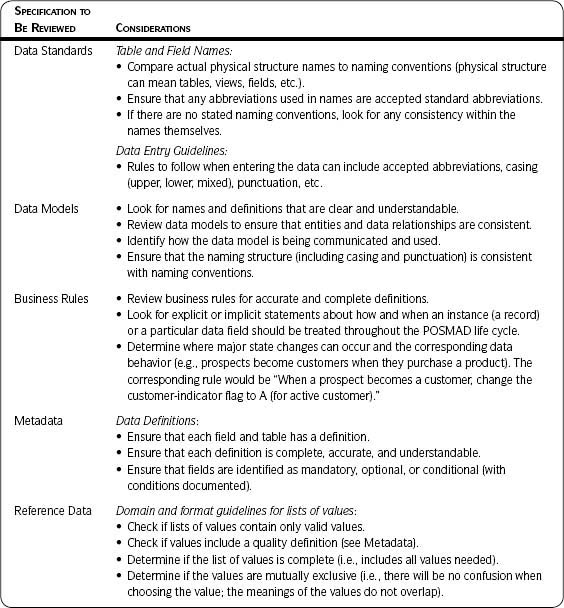
Template 3.7 • Data Specifications Scope
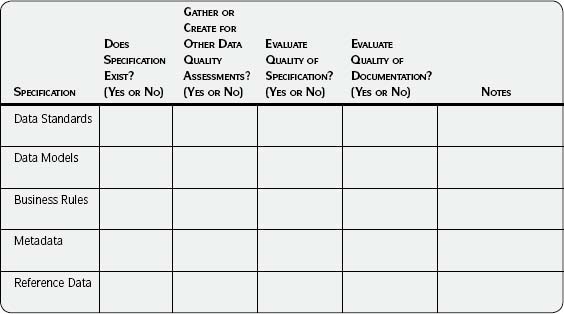
Table 3.14 • Documentation Quality
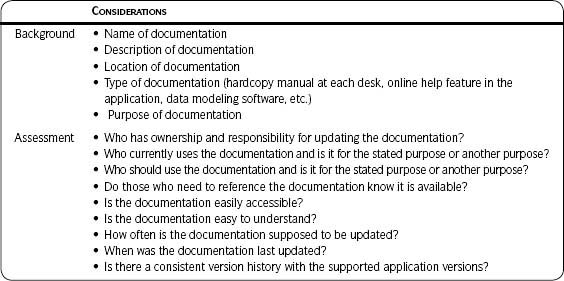
Step 3.2 Data Integrity Fundamentals
Business Benefit and Context
The Data Integrity Fundamentals dimension of quality is a measure of the existence, validity, structure, content, and other basic characteristics of data. It includes essential measures such as completeness/fill rate, validity, lists of values and frequency distributions, patterns, ranges, maximum and minimum values, and referential integrity. Michael Scofield, manager of Data Asset Development at ESRI in Redlands, California, puts it this way:
When it comes to data if you buy it, sell it, move it, transform it, integrate it, or report from it you must know what the data really means and how it behaves.
Data integrity fundamentals provide that knowledge. If you don’t know anything else about your data, you need to know what you will learn from this data quality dimension.
![]() Definition
Definition
Data integrity fundamentals: a measure of the existence, validity, structure, content, and other basic characteristics of the data.
You will need to use some type of analytical technique to discover the data’s structure, content, and quality. Tools for understanding fundamental data integrity, often referred to as data profiling or analysis tools,4 look at but do not change the data. Jack Olson defines data profiling as “the use of analytical techniques to discover the structure, content, and quality of data.” The term “profiling” is used in this step to indicate the assessment of the Data Integrity Fundamentals dimension.
It is recommended that Data Integrity Fundamentals be one of the first dimensions assessed because most of the other dimensions build on what is learned through profiling. For example, even if your top priority is to determine duplicate records, in order to get valid results from a matching algorithm, the quality and fill rate at the field, column, or data element level must be high. Any issues at the field level will be made visible through data profiling.
Profiling can be accomplished with one of the data profiling tools on the market or by other means such as SQL to write queries or some type of report writer to create ad hoc reports. Even if you are not using a purchased data profiling tool, look at the functionality of and output from such tools to help guide the queries or reports to write so you can understand the Data Integrity Fundamentals dimension.
If you are trying to establish the business case for data quality, you may write a few queries to bring visibility to data quality issues and prove the point that they exist. If you are planning on establishing a data quality baseline, are part of a large-scale integration project, or are serious about an ongoing data quality program, I highly recommend purchasing a data profiling tool.
At times, data profiling tools are looked at with disdain or suspicion by developers or others who enjoy writing queries. (“I can write a profiling application this weekend.”) However, for large-scale or ongoing quality efforts you cannot write a profiling application that will run the multitude of queries needed, present the results, and store the results for future use the way already existing profiling tools can within any reasonable period of time. Let the profiling tools do the basics (which they are very good at).
Put your developers’ skills to work supplementing what cannot be automatically done by the profiling tools, such as in-depth checking of business rules or relationships. Some of the advanced work can be done within the profiling tools, but requires human intervention; sometimes it requires work outside the tools. This is a much more effective use of your deep knowledge of your data and your business. I would much rather see people spend their time analyzing and taking action on the profiling results instead of writing queries to obtain them.
Uses of Data Profiling
Profiling can be used to assess an existing data source for suspected quality problems, in a solution development project such as building a data warehouse or a transactional application, when migrating data to an ERP, or when moving or integrating data. As outlined in the following list, profiling can be used to assess any data source and to provide input, information, and insight.
Uses of Data Profiling
Create or validate a data model—Profiling allows the creation of new models that support data to be moved into a new application, and it exposes structural differences between an existing target data model and the source data to be moved.
Inventory data assets—Profiling provides visibility to create an inventory of your company’s data assets—that is, the ability to identify or validate the existence and availability of information. It provides rapid assessment of which fields are consistently populated compared to expectations and can provide input to determining whether your company already has the needed data or if external data need to be purchased.
Check data coming from external data sources—Profiling provides input to determine whether to purchase data from sources external to your company. Once data are purchased, profiling can be used to check the data source each time prior to loading to the company’s databases.
Improve source-to-target mappings—Profiling shows the data content of fields and the inconsistencies between column headings and content. Use of data profiling results for source-to-target mappings yields better mappings in a shorter time than a traditional mapping method in which only column headings are looked at. Without visibility of the data content, incorrect mappings are often not discovered until testing.
Uncover specific data quality problems—Profiling provides visibility of the actual location and magnitude of data quality errors. This provides input for root cause analysis and allows the business to prioritize actions for preventing future problems and correcting current ones.
Confirm selection criteria—Profiling uncovers data that may be unknown to the subject matter expert. It provides the visibility to make good decisions on data (both fields and records) that should or should not be migrated.
Determine system of record—Profiling provides input to decisions about the best system to use.
Compare, analyze, and understand source, target, and transitional data stores (e.g., files, staging areas)—Profiling source, target, and transitional data stores shows the state of the data in any system, highlighting differences and their magnitude and pointing out where to focus cleansing, correction, transformation, or synchronization. A special case of looking at source and target systems is when integrating data from two companies because of mergers and acquisitions.
Identify transformation rules—Profiling highlights the differences between source data and target system data requirements. It leads to more accurate and comprehensive transformation rules so that data will load properly.
Control test data—When application functionality testing fails, time is spent investigating root causes because it is not known if the source is related to data or software functionality. Data profiling helps in the first step of testing to catch data errors prior to the testing cycle. By using good-quality data for testing, less time is spent searching for errors and there is more focus on the application’s functionality needs.
Initial step to finding root causes—Profiling is the first step to identifying root causes of data quality issues because the actual data content is made visible.
Support ongoing data quality monitoring—Profiling results provide the basis for continuous improvement. After the initial baseline profiling, project teams typically choose the data quality issues with the most impact for regular monitoring.
Benefits from Data Profiling
Data profiling will
- Improve predictability of project timelines. Data quality issues often delay timelines and take the project team by surprise. Uncovering issues early helps prevent costly surprises and lowers the risk of design changes late in the project.
- Focus resources and efforts where they are really needed. Expensive, large-scale data clean-up is often begun based on opinions. By profiling and seeing the actual quality of the data, investments in data quality can be focused where they will provide the most benefit.
- Determine whether your company already has needed data or if external data need to be purchased.
- Support data integration and migration testing.
- Support compliance and audit requirements.
- Improve visibility of the quality of the data that support business decision making, providing input to determine where to assess business impact and where to focus root cause analysis for data deemed to be of high impact.
Typical Profiling Functionality
Typical profiling functionality lets you look at your data from different viewpoints.5 (See Figure 3.8.)
1. Column Profiling—Analyzes each column6 in a record, surveying all records in the data set. Column profiling will provide results such as completeness/fill rates, data type, size/length, list of unique values and frequency distribution, patterns, and maximum and minimum ranges. This may also be referred to as domain analysis or content analysis. It enables you to discover true metadata and content quality problems, validate if the data conform to expectations, and compare actual data to target requirements.
2. Profiling within a Table or File—Discovers relationships between columns within a table or file, which enables you to discover actual data structures, functional dependencies, primary keys, and data structure quality problems. You can also test user-expected dependencies against the data. This is also referred to as dependency profiling.
3. Profiling across Tables or Files—Compares data between tables or files, determines overlapping or identical sets of values, identifies duplicate values, or indicates foreign keys. Profiling results can help a data modeler build a third normal form data model, in which unwanted redundancies are eliminated. The model can be used for designing a staging area that will facilitate the movement and transformation of data from one source to a target database such as an operational data store or data warehouse.
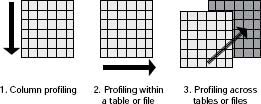
Approach
1. Finalize your data capture and assessment plan.
See Step 2.7—Design Data Capture and Assessment Plan and the Capture Data section in Chapter 5 for additional information. Update and finalize your plan if you started it earlier. Create and finalize it if not yet begun.
2. Access or extract the data.
3. Profile the data.
Use the tools that best meet your needs. As mentioned earlier, data can be profiled using a commercial data profiling tool, a query program such as SQL, a report-writing program, or a statistical analysis tool. However, if your company is serious about data quality and you are rigorously establishing a baseline for continuous improvement, strongly consider purchasing a data profiling tool. Get appropriate training and use any best practices available from your tool vendor.
When beginning the profiling and analysis of a data file, consider how much risk the data entail. Data considered to be critical that are extracted from an unreliable source require more focused analysis than less critical data extracted from a reliable source. Considering risk will help in determining the depth of the analysis to be performed or whether additional profiling is necessary.
4. Analyze the results.
No matter which tools you use, refer to Table 3.15, which describes various characteristics of data to be tested, their definitions, and examples of analysis and potential action. You will get into in-depth root cause analysis later (see Step 5—Identify Root Causes), but at this point start asking yourself why the data look the way they do.
Include subject matter experts, data experts, and technical experts to interpret what you are seeing in the profiling results. Be prepared to conduct additional profiling tests based on your initial analysis.
5. Document results and recommended actions.
Capture your profiling assessment results and lessons learned (including confirmation of opinions and surprises). Include possible impact to the business revealed through your analysis, potential root causes, and preliminary recommendations for addressing the issues found.
Table 3.15 • Data Integrity Fundamentals—Tests, Analysis, and Action


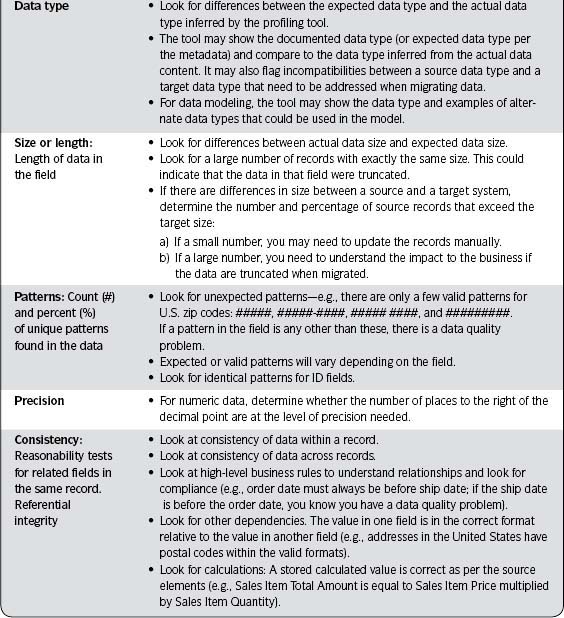
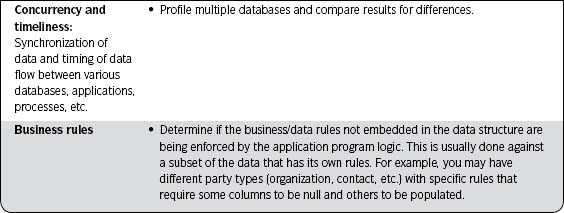
![]() Best Practice
Best Practice
Profiling
- Document anomalies and decisions.
- Have a subject matter expert available at all stages of the process to ensure rapid answers to questions and resolution of open issues.
- Because the actual data show what is really happening, always refer to them if there are differences of opinion about what exists. Let the data tell “the rest of the story.”
Step 3.3 Duplication
Business Benefit and Context
There are many hidden costs associated with duplicate data. Following are a few reasons why it is important to avoid duplicates:
- As companies’ credit limits change, they are updated on one account and usually remain static on any duplicate accounts. The customer may be told the credit limit based on one record and later find the credit constrained by the amount on a different record.
- Multiple records for the same customer can, in effect, multiply the extended credit limit two or more times depending on the number of duplicate records, exposing the company to unnecessary credit risks.
- Customer service representatives have difficulty locating a transaction placed on a duplicate account. This can result in delayed shipments or confusing messages to customers.
- Web integration for accounts and sites becomes difficult if multiple records exist for the same customer. Customers and the company can become confused.
- Multiple records for the same customer make it hard to determine the value of that customer to the business.
![]() Definition
Definition
Duplication is a measure of unwanted duplication existing within or across systems for a particular field, record, or data set.
Checking for duplicates is the process of determining uniqueness. Some third-party tools are available to help reveal whether there are duplicate records or fields, within or across databases. These tools are usually referred to as data cleansing tools, and they serve several functions—identifying duplicates is one of the more popular. (See the Data Quality Tools section in Chapter 5 for more information on tools and terms used.)
![]() Definition
Definition
Uniqueness means that the record, entity, or transaction is the one and only version of itself that exists—it has no duplicates.
“Matching” is a term sometimes used to mean de-duplication and sometimes used to mean linking. In either case, de-duplication identifies two or more records that represent the same real-world object, such as multiple records representing the same customer, employee, supplier, or product.
Linking associates records through a user-defined or common algorithm. For example, householding is a linking concept often used by banks to understand the relationships among various customers. All records associated with a particular household are linked, such as that of a young adult with a new checking account linked to that of his or her parents, who may have a number of accounts with the bank. Linking is also used to identify households with multiple investment accounts with the same company so only one privacy notice is sent to each household, therefore saving printing and mailing costs (and helping our environment also).
Both linking and de-duplication require an algorithm for matching, which is some combination of fields that identify unique records. Weights can be set for the individuals fields, if needed, to indicate which are more important and should have more bearing in the algorithm. The better the quality of the data in these fields, the better the tool will identify matches. Standardizing and/or parsing the data prior to running the matching algorithms (also referred to as match routines) results in better matching, linking, and identification of duplicates.
Once the potential duplicates are identified, someone has to decide which of them are real duplicates, which record should survive, and which pieces of the records should be carried into a new combined record. This is also referred to as “survivorship” or “match-merge.”
The process of identifying duplicates will take many rounds of testing and manual intervention before you can be satisfied with the results of the algorithms. It takes additional testing to be satisfied with the automated merge or survivorship process. Finding duplicates can never be 100 percent automated, but over time, with testing and adjusting match algorithms and threshold levels, trust in the match-merge results should increase.
Matching Definitions
Real World
- Match—Two or more records represent the same real-world thing.
- Nonmatch—A unique record; no other record in the population represents the same real-world thing.
Representation of the Real World through Business Rules and Tool Usage
- True Match—Business rules as implemented within the tool have identified a match that is confirmed by business review.
- Nonmatch—Business rules as implemented within the tool have identified a unique record that is confirmed by business review.
- False Negative—Cases have been classified as unmatched, but should have been matched—that is, missed matches. The results are impacted by the business rules and use of the tool.
- False Positive—Cases have been incorrectly classified as matches. They are actually nonmatches—that is, mismatches. The results are impacted by the business rules and use of the tool.
When you use an automated tool, results will show those records that are not matches and those records that are. There is always a “gray” area where the matches and nonmatches overlap, which means that it is not clear if the particular item is a match or a nonmatch. The further you move away from the gray area (in either direction), the more confident you are that the matches are true matches and the nonmatches are really nonmatches (as illustrated in Figure 3.9).
Look closely at the gray area in Figure 3.10. When you look at the detail there you can see the difference between the false negatives (the matches that have been missed) and the false positives (nonmatches incorrectly classified as matches). The threshold is the point at which two objects are sufficiently alike to be considered potential duplicates; it can be adjusted.
Balancing Act
Setting the threshold is as much an art as a science. The list that follows on the next page contains a few ways to think about the trade-offs.
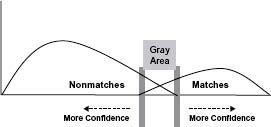

- Moving the threshold to the left maximizes matches, but increases incorrect matches (false positives) while decreasing missed matches (false negatives).
- Moving the threshold to the right increases the number of missed matches (false negatives) while minimizing the number of incorrect matches (false positives).
- If the business does not want to miss the true matches, it must see more incorrect matches (false positives).
Approach
1. State the expected goals of the de-duplication activity.
In the planning of a de-duping project, there needs to be a clear idea of the expected outcome and the people or processes that will be impacted by it. For example, in one company a high-level duplicate assessment was conducted in order to provide input for a decision on which application should be considered the source of reference for customer data. This required only an initial assessment.
In another project, a new Customer Master was being created from several sources. The records from this Customer Master were to be migrated into a new ERP application. This required months of work and intensive use of a data cleansing tool.
If the end result is to reduce data duplicates within source systems:
- All impacted systems will need to be identified and appropriate changes to those systems incorporated into the project plan. How will you handle transactional records (such as invoices or sales orders) that are still open and linked to master records that have been identified as duplicates? You may have to flag the duplicate master record so that it will no longer be used, and then delete it after all the associated transactional records have been closed.
- A complete cross-reference of old to new identifiers should be maintained throughout the project and retained for future reference. (One ERP project used the cross-references for months after the project was over.)
- The analysis step will need to include survivorship processing (more detail on survivorship shortly).
- However, if the objective is to provide metrics from which decisions can be made relative to an actual data cleansing effort, there may be no need to examine duplicate sets for survivorship.
2. Determine how the business looks at uniqueness and list the rules.
How does the business determine if a record is a duplicate of another record? What combination of data elements constitutes a unique record?
For example, does a unique combination of sold-to, ship-to, and bill-to addresses constitute one unique record? Should there be only one occurrence of a particular customer name in the database? (Refer to your review of the data model in Step 2.2—Understand Relevant Data and Specifications for input.)
Decide at which level to test for uniqueness:
Record level—For instance, there should only be one occurrence of a particular customer in the database. Do you care about sites and/or contacts? For uniqueness of sites, you may want to look at combinations of address fields. For uniqueness of persons, you may want to look at combinations of name and address fields.
Field level—For instance, phone numbers should generally be unique unless you are assessing site phone numbers where there is one central number for all contacts at that site. ID numbers should be unique. Simple field level uniqueness based on exact string matches can be accomplished using a data profiling tool. If you need a more sophisticated algorithm, use a data cleansing tool.
3. Determine the tool(s) to use for finding duplicates and testing for uniqueness.
This is where you will most likely use a third-party tool—the process of finding duplicates is best automated. A data profiling tool can provide some high-level checks for uniqueness (usually based on an exact string match). It can easily show if all records in an ID field are unique. Anything more rigorous than that requires a specialized tool.
As previously mentioned, specialized tools are often called data cleansing tools and sometimes called data quality tools. With cleansing tools you have the option of looking at and also changing the data.
If you have no tool, this step can be quite time consuming as you will need to go through whatever process your company requires for software acquisition (research options, determine tool selection criteria, schedule demos, make a purchase decision, negotiate and finalize the contract, obtain and install the software). If a tool is currently available, check your licensing agreement and ensure that the contract is up to date.
In either case, you will need training in order to use the particular tool. All explanations in this step are for a general understanding of the concepts behind duplication; features and a particular approach to de-duplication may vary depending on the tool you use.
4. Analyze the data to be de-duplicated.
The more you know about your data, the better you will be able to customize the standardization and matching routines required by your tool. Profiling is a great way to understand the data. Everything learned from profiling will provide input to customizing your standardization and matching routines. (See Step 3.2—Data Integrity Fundamentals for more on understanding your data.)
Most tools come with out-of-the-box algorithms, but they need to be tuned to your specific data. You will need to translate business needs to the rules and algorithms the tool requires:
- Determine fields to be compared and match criteria.
- Determine standardization rules, de-duplication algorithms, weights, and thresholds.
- Expect several rounds of testing to get your standardization and matching routines to an acceptable level.
Expect difficulty in preparing the data and matching across languages. In countries like Switzerland, where multiple languages are spoken, it is difficult to programmatically see what language is being used in order to standardize the data, so you will have to use different algorithms and thresholds for different languages and address formats.
You will also have to deal with differences in how the data were entered and the point of reference and knowledge of the person who performed the data entry. For example, a person in France entering a French address and a person in Germany entering the same address often do so in very different ways.
Allow plenty of time for analysis activities. This is critical to obtaining successful results when you are ready to perform the matching.
5. Design the duplicate assessment process.
Include the following:
- What is your population of interest and associated selection criteria (both business and technical)?
- Who will extract the data and when; what output format is needed?
- Who will run the data through the de-duplication tool and when?
- Who will review the results of de-duplication and when?
- Who will report the results of testing and analysis and when?
- What metrics will be gathered and what reporting is required?
6. Extract the data.
Refer to the Capture Data section in Chapter 5 to ensure that you are extracting the correct set of data.
7. Test the data for duplicates.
Use the tools that best meet your needs. For your initial assessments, you will probably only look at the matching results. Do not automate data changes until you have thoroughly tested and refined those results. Be appropriately trained and use any best practices available from your tool vendor.
Manage and adjust standardization routines, threshold levels, and matching algorithms as needed. Do not be surprised if you have to go through the cycle of reviewing results/adjusting algorithms several times before you are satisfied. Flag those records that show as duplicates but are acceptable to leave as is. Report your metrics and discuss the impact.
Plan more time into your schedule if you want to automate the survivorship process. Even if survivorship will be done manually by people reviewing results and choosing the surviving records, you must have some guidelines for what records or fields take precedence. Document the rules and provide training in order to get more consistent results from survivorship.
In hindsight, one project recommended keeping the standardized data in a separate field from the original data field. The standardized data were used to help with the matching. If the team made adjustments to the standardization routines, the data could be restandardized using the updated algorithms. If you don’t have the original data, it will not be possible to do this.
Another recommendation is to keep the cross-reference data you will receive after matching. In one data migration, new source systems that were found needed to be updated with the new identifiers that had been assigned by previous matching. The project team could match the additional source data to the cross-reference file and then assign a new customer number.
Many of these are things you learn from experience, but a few are presented here to give an idea of the complexity of de-duplication. Even so, the cost of de-duping is still less than the cost of the impact of duplicates.
8. Analyze the results and determine next steps.
Keep the goals of your de-duplication effort in mind. Following are questions to consider:
- What is the level of duplication found? Does duplication vary by country, geographic region, or some other category that is meaningful to your company?
- Is the level of duplication found significant? What is the impact of the duplicates to the business? Has anything learned during the assessment provided enough information about impact to determine if it is worthwhile to continue addressing duplicates?
- Do you expect this to be a one-time assessment only? Have you learned anything about duplicates that will change that plan?
- How will you handle the clean-up of duplicate records? How will you handle transactional records (such as invoices or sales orders) that are still open and are linked to master records that have been identified as duplicates? You may have to coordinate across systems such as by flagging the duplicate master record so it can no longer be used, and then delete it after all the associated transactional records have been closed.
- How can you prevent the creation of duplicate records?
- How will de-duplication be handled in the future? On an ad-hoc basis? As a scheduled batch job on a regular basis? Integrated into another application and used in real time?
- How much of the process will be automated? If instituting de-duplication as part of an ongoing process, you may decide to eventually automate the identification piece and use manual review for only some match categories. You can then decide whether to fully or partially automate the merge process.
9. Document results and recommended actions.
Include lessons learned such as potential impact to the business from the duplicates, possible root causes, and preliminary recommendations.
Determine whether you want to continue using the data cleansing tool. Initial assessment is only one of its uses. Tools can be built into production processes to prevent future data errors (Step 7—Prevent Future Data Errors) or used to correct current data errors (Step 8—Correct Current Data Errors). They may also be used when implementing ongoing controls (Step 9—Implement Controls).
Step 3.4 Accuracy
Business Benefit and Context
It’s easy to associate data quality with data accuracy. It seems obvious that the goal of data quality should be to produce correct data. However, for the purpose of assessing and managing data quality it is important to make a distinction between the dimension of Accuracy and other data quality dimensions.
Accuracy differs from data integrity fundamentals in that the latter refer to the basic measures of data validity, structure, and content. Data accuracy requires comparing the data to what they represent (the authoritative source of reference). Conducting this assessment is usually a manual process.
![]() Definition
Definition
Accuracy is a measure of the correctness of the content of the data (which requires an authoritative source of reference to be identified and accessible).
For example, assume you are looking at the quality of item master records. The data profile assessment reveals the following:
- The percentage of records that contain a value in the item number field
- The percentage of records in which the item number conforms to an acceptable pattern
- That all records contain a value of M (for make) or B (for buy) in the item type field
- That the business confirmed that M and B are the only two valid values for item type
These are all fundamental aspects of data quality and are important to know. However, only someone who is familiar with a specific item can say if it is really a make part or a buy part—that is, if it accurately reflects what it represents.
Accuracy requires an authoritative source of reference and a comparison of the data to it. That comparison can take the form of a survey (such as a phone call to a customer or an emailed questionnaire) or an inspection (such as a comparison of the inventory count in the database to the actual inventory on the shelf).
Now assume you are checking the quality of customer records. You use profiling tools or run queries to determine if a zip code is in the zip code field and if it conforms to the acceptable pattern indicating a valid U.S. zip code. Using the right tools you can also check if each city, state, and zip code group creates a valid combination. But only the customer can tell you if that particular zip code is his or hers—once again, this is accuracy. The authoritative source of reference is the customer.
When deciding where to assess accuracy, ask yourself these questions:
What is the authoritative source of reference?—For inventory levels, accuracy can only be verified through physical counts of the product inventory. For accuracy of business names and company hierarchies you may decide to verify through an industry source such as Dun and Bradstreet.
Is the source of reference available and accessible?—There is often no way to corroborate data gathered some time in the past. Another issue may be regulations that constrain direct contact of customers to verify their information in your database.
Do you know the number of records that the business can afford to check for accuracy?—Because of the expense of determining accuracy, accuracy checks are usually done against a sampling of records, while with profiling tools you can often check all records. If a problem with accuracy is found in the sample, at that point the business can determine if accuracy updates on all the data are worth their cost.
Approach
Start an accuracy assessment by preparing for the inspection or survey, completing the inspection, and scoring and analyzing the results. Do not perform updates to the database while inspecting. You may lose important context and information needed when you research root causes. Make corrections at a later date.
Prepare
Complete the following items prior to executing your accuracy survey/assessment/inspection.
1. Decide which data elements can be assessed for accuracy.
Is there an authoritative source of reference? Discover what or who is the authoritative source of reference for the data. Important! More examples:
- A customer may be the authoritative source of reference for customer information.
- A scanned application and resume may contain the authoritative data for personnel-recruiting information.
- An administrative contact may be able to verify site information.
- Product itself may be the source for a product description.
- An upstream order system may contain authoritative data about orders that are passed onto a warehouse.
- A generally accepted “Golden Copy” (controlled and validated version) might serve as an authoritative source of reference.
- A recognized industry-wide standard, such as Dun and Bradstreet for company names and hierarchies.
Is that source of reference accessible? Are there any constraints (such as privacy or security) that would prevent you from accessing the source for an accuracy comparison?
2. Decide which method of assessment to use.
You will use tools to capture the results of the assessment, but the assessment itself usually cannot be performed by an automated tool. Examples of survey and inspection methods include:
- Telephone survey—expensive, but a greater chance for confirmation
- Mailed survey—less expensive, but less chance for confirmation (Some contacts may not respond or may not be reached because of address errors. Telephone follow-up, if allowed, can offset a lack of response.)
- Physical inspection of objects
- Manual comparison of data in the database against a printed source of reference
Consider the following factors when finalizing the method of assessment:
- Cultural—What is acceptable in your environment?
- Response—What is the best way to obtain input from the authoritative source?
- Schedule—How quickly do you need a response? For example, mailed surveys have a much slower turnaround time than phone surveys.
- Constraints—Are there any legal requirements that restrict you from using a particular source of reference?
- Cost—What are the costs for the various approaches?
3. Determine who will be involved in conducting the accuracy assessment.
Involve those familiar with, but not responsible for, the data being assessed. For example, an inspection of inventory may be done by an objective third party who understands inventory systems.
4. Determine the sampling method.
Sampling is a technique in which representative members of a population are selected for testing. The results are then inferred to be representative of the population as a whole. The sample has to be representative so that the accuracy of the sampled records will approximate the accuracy of all those in the population.
There are two characteristics of a sample that determine how well it represents the population:
- Size relative to population—What is the minimum required number of records that need to be checked and completed in order to provide statistically valid results for the population?
- Stability—If a sample size produces a result and if it is increased and produces the same results, the sample has stability.
There are different sampling methods, but random sampling is very common. Random means that every member of the population has an equal chance of being chosen to be part of the sample.
Important: Involve someone experienced in statistics to ensure that your sampling methods are valid! For example, your software quality assurance group may already have best practices for sampling.
5. Develop the survey instrument, survey scenarios, record dispositions, and update reasons.
The survey instrument is the set of questions used for assessing accuracy, whether by questioning a respondent or by manually checking against a source of reference.
- For a telephone survey, develop the set of questions and the script for obtaining input from respondents.
- For a hardcopy, mailed, emailed, or website survey, develop the questionnaire to be completed and returned by respondents.
- For manual comparisons, decide what forms will be used to capture results and how the data from the database will be presented to facilitate easy comparison to the source.
- Determine if questions should have predefined answer choices. For instance, product questions may correspond to a product table in the database. If so, ensure that your list of choices matches the valid reference in the database.
Survey scenarios are possible situations the surveyor might encounter throughout the survey period. An example for a survey of customers includes the following: “Unable to contact customer”; “Contacted customer but customer declines to participate”; “Customer starts survey but does not complete it”; and “Customer completes survey.” Assign a code that corresponds to the status of each record at a particular state. These codes are referred to as record dispositions. For example, if the surveyor is able to verify the status of each data element within the record, the disposition for that record is “fully checked.” Other record dispositions include “partially checked” or “not checked,” “contact not located,” “declined,” and so forth. Only those records with the disposition “fully checked” are later scored for accuracy. However, tracking ALL record disposition types can yield an additional important quality measure.
Update reasons explain the results of the comparison between the information in the database and the information supplied by the source of reference. You may want to track an update reason for each field that is compared for accuracy. For example, the update reasons could be
- Correct—No updates are needed; the information provided by the source of reference is the same as that contained in the database.
- Incomplete—The information in the database is blank; the source of reference provided the missing information.
- Wrong—The information provided by the source is different from the information in the database.
- Format—The content of the information is correct, but the formatting is incorrect.
- Not applicable—The information was not validated with the source.
Update reasons are noted while the inspection is being performed or the survey is being conducted.
6. Develop the survey or inspection process.
The survey or inspection process is the standard process that will be used for comparing the data with the source of reference and capturing the results. Determine
- Overall process flow—If the survey is to be sent, determine where and how it is to be distributed, returned, and processed. If the accuracy assessment involves inspection, determine when and how the inspection will take place.
- Overall timing—any key dependencies (For example, the data in the database should be extracted at a time as close as possible to the time the assessment starts.)
- That the update reasons, scoring guidelines, survey scenarios, and record dispositions have been finalized and documented.
- That any list of choices and corresponding codes are correct.
7. Develop reports and the process for reporting results.
Reporting needs must be clarified up-front to ensure that the correct information is collected and readily available on the back end. Reports should include how the data from the database will be extracted and formatted, and in what form the information will be available for those conducting the inspection or survey.
- At a minimum, include output for every record showing a before and after picture of each data element (Output should include information about every record assessment, whether fully checked or not.)
- The number and percentage of records for each of the record dispositions
- Mock-ups of the reports to ensure agreement on the content and format of the information to be reported
- Finalization of the reports
8. Prepare the process for scoring accuracy.
Scoring quantifies the results of the accuracy assessment. Scoring guidelines are the rules that determine whether the update reasons will be scored as correct or incorrect. Each field compared for accuracy will be scored as correct or incorrect. The scoring guidelines are applied to the survey or inspection results after the survey or inspection has been completed.
In order to score the accuracy results, follow these steps:
Prioritize and weight the data—Decide which data are the most important and assign a ranking of value relative to other data elements (e.g., low, medium, high, or 1, 2, 3).
Create scoring guidelines—The scoring guidelines are the rules that determine the score to be assigned to each update reason. For example, a field with an update reason code of “correct,” “blank,” or “format” may be assigned a score of 1, while a field with an update reason code of “wrong” may be assigned a score of 0. Whether the record is a 1 or a 0 is determined when the scoring is completed. The scores are put into the scoring mechanism (such as a spreadsheet) to calculate accuracy statistics.
Create a scoring mechanism—This may be a spreadsheet that calculates the data element, record level, and overall accuracy statistics based on the assessment.
9. Extract the appropriate records and fields for assessment.
Verify that the extracted data meet your selection criteria and that the sample is random and representative of the population. Refer to the Capture Data section in Chapter 5 to ensure that you are correctly extracting the data needed for the accuracy assessment.
10. Train those who are conducting assessments.
Assessments carried out by multiple people must be conducted consistently to ensure correct results.
11. Run and test the inspection or survey process from beginning to end.
Make changes to the process, survey instrument, survey scenarios, record dispositions, scoring methods, and reports as needed.
Execute
Complete the following while the assessment is being conducted.
1. Collect results.
If too much time has passed between initially extracting the data and finalizing your assessment plan, you may need to extract the data again to ensure that the most recent data are being assessed. Capture assessment results throughout the survey period.
2. Monitor the progress of the assessment throughout the survey period.
This will allow you to confirm if the work is on schedule and is being done correctly and consistently. It is important to find problem areas early on. If needed, stop and make adjustments to the survey instrument, provide additional training to surveyors, and so forth.
3. Stop the assessment when the desired number of completed (fully checked) records has been reached.
Analyze
Finish the following items after the survey has been completed.
1. Obtain final reports.
2. Score the survey according to your scoring guidelines.
Scoring refers to evaluating the differences between what was originally in the database with what was found during the assessment, assigning a score, and calculating the accuracy levels.
- Choose an objective third party to do the scoring.
- Prepare materials and document the process for scoring so it can be done consistently.
- Only score records that have been “fully checked.”
- Compare what is in the database against the assessment or survey results and apply a score for each data element.
3. Analyze results of the survey.
Look at accuracy at the data element and record level. Also look at overall sample accuracy. Analyze the record disposition statistics—the number and percentage of records for each disposition. Other considerations:
- What is the accuracy level? If you have targets for accuracy, compare the actual results to them.
- How do results compare with your expectations? Any surprises?
- Do accuracy results vary by country, geographic region, or some other category that is meaningful to your company?
- Has anything been learned during the assessment that provides enough information about impact to determine if it is worthwhile to continue addressing accuracy?
- Did you expect this to be a one-time assessment only? Have you learned anything about accuracy that will change that plan?
- How will you handle the correction of records found to be inaccurate? Who will do this and when?
- How can you prevent the creation of inaccurate records? Any ideas on root cause?
See the Analyze and Document Results section in Chapter 5 for additional suggestions.
4. Document results and recommended actions.
Include lessons learned such as potential impact to the business from the accuracy results, possible root causes, and preliminary recommendations.
Step 3.5 Consistency and Synchronization
Business Benefit and Context
Consistency refers to the fact that the same data stored and used in various places in the company should be equivalent—that is, the same data should represent the same fact.
Equivalence is the degree to which data stored in multiple places is conceptually equal. It indicates that the data have equal values and meanings or are in essence the same. Synchronization is “the process of making the data equivalent” (Larry English).
![]() Definition
Definition
Consistency and synchronization are measures of the equivalence of information stored or used in various data stores, applications, and systems, and the processes for making data equivalent.
For example, your company makes (manufactures) some parts for building products and buys other parts. A make part is indicated in the first database as M. In another database a make part is coded as 44. Any make part record moved from the first database with a value of M should be stored in the second database with a value of 44. If not, there is a data quality problem with consistency (how the data are stored) and synchronization.
An example of being consistent, but not directly equivalent, may be in a hierarchy where one system shows medical specialty as breast cancer and another shows medical specialty as oncology. They are not equivalent but consistent.
This type of assessment looks at equivalent information throughout its life cycle as stored or used in various data stores, applications, processes, and the like, and determines if it is consistent.
Consistency and synchronization are important because the same data are often stored in many different places in the company. Any use of the data should be based on those data having the same meaning. It is not uncommon for management reports on the same topic to have different results. This leaves management in the uncomfortable position of not really knowing the “truth” of what is happening in the company and makes effective decisions difficult.
Approach
1. Identify the databases where data are stored redundantly.
Refer to the results from Step 2.6—Define the Information Life Cycle to determine the various locations where the data are stored. (Note: Whether the redundancy is necessary or not is not determined at this point.)
2. For each field of interest identify the detail about it for each database where it resides.
This is a detailed mapping of the same data as they are stored in each database. Refer to Step 2.2—Understand Relevant Data and Specifications.
3. Extract the data from the first database and select the corresponding records from each redundant database.
Use the Capture Data section in Chapter 5 to ensure that the right data are being extracted.
4. Compare the data from each redundant database with the data in the original database.
Determine if one database is considered the authoritative source of reference.
5. Analyze and report the consistency results.
Note where unwanted redundancy exists.
6. Document results and recommended actions.
Include lessons learned such as potential impact to the business from the accuracy results, possible root causes, and preliminary recommendations.
Sample Output and Templates
The Situation
Background—Sales reps in your company are one of the main vehicles for obtaining customer information. That information eventually makes its way through various processes and ends up in the Customer Master Database, where it is further moved and used in transactional and reporting systems. The project team looked at the high-level Information Life Cycle that was an output of Step 2—Analyze Information Environment to determine all systems where the data were stored. Because of resource constraints they could not look at every system at this time.
Focus—The team decided to focus on the front end of the Information Life Cycle and test data for consistency between the Customer Master Database and one of the transactional systems that uses the customer data—the Service and Repair Application (SRA).
Inquiry, the “override” flag—The project team paid particular attention to what is called the “override” flag. The SRA allowed the phone reps to override the data pulled in from the Customer Master Database when creating service orders. The team wanted to understand the magnitude of the differences for those records with the override flag set to yes (Y) and the nature of the differences in the data.
Extract records—The project team extracted records from the SRA where the override flag was set to Y. They then extracted the associated records from the Customer Master Database. When performing the comparisons, the Customer Master Database was considered the system of record. The project team used a data profiling tool to run column profiling (content profiling) against both sets of data and then compared the data for equivalence.
Method—random sample and manual comparison—For some data elements (such as Company Name and Address) the comparison was done manually. In addition, the team wanted to further segment the results to see if there were significant differences between countries in the SRA. A random sample of the population from profiling for each country was selected for the manual comparison.
(See Step 3.6—Timeliness and Availability for a continuation of this example that includes the timeliness dimension.)
The Results
Table 3.16 shows the results of the manual comparisons for consistency.
Table 3.16 • Consistency Results

Step 3.6 Timeliness and Availability
Business Benefit and Context
Data values change over time and there will always be a gap between when the real-world object changes and when the data that represent it are updated in a database and made available for use. This gap is referred to as information float. There can be manual float (the delay from when a fact becomes known to when it is first captured electronically) and electronic float (time from when a fact is first captured electronically to when it is moved or copied to various databases that make it available to those interested in accessing it).
The phrase “use as specified” in the definition of this dimension refers to having the data available when the business requires them. Another way to describe timeliness is as
[A] measure of the degree to which an information chain or process is completed within a pre-specified date or time. Timeliness is related to currency—data are current if they are up-to-date and are the usual result of a timely information chain.
–Tom Redman7
![]() Definition
Definition
Timeliness and availability are measures of the degree to which data are current and available for use as specified and in the time frame in which they are expected.
Approach
1. Confirm the Information Life Cycle.
Review the Information Life Cycle developed in Step 2.6—Define the Information Life Cycle and update if necessary. (See the example in the Sample Output and Templates section at the end of this step.)
2. Determine which phases of the Information Life Cycle to assess for timeliness and availability.
You may want to focus on only a portion of the life cycle.
3. Determine the process for measuring information float throughout the process.
Work with your information technology group to understand database updates and load schedules. If necessary, have data producers keep a log of date and time when specific occurrences of data become known during the assessment period.
4. Select a random sample of records to trace through the Information Life Cycle.
You may be moving either forward or backward through the life cycle.
5. Determine the time elapsed between the steps in the process for each of the records.
Document the start time, stop time, and elapsed time for each step in the process. Be sure to take geographic locations and time zones into account.
6. Compile and analyze results of the timeliness test.
Consider the following:
- What are the timeliness requirements? When does the information need to be available at each step of the process?
- Are processes and responsibilities completed in a timely manner? If not, why?
- Is there anything that can be changed to help?
7. Document results and recommended actions.
Include assessment results, lessons learned, possible impact on the business, suggested root causes, and preliminary recommendations.
Sample Output and Templates
The situation: This example continues the example from Step 3.5—Consistency and Synchronization. Assume an assessment for consistency was completed. Now the business wants to understand the timing of events in the process as the data move through the life cycle. A subset of the life cycle for one country was examined in detail for timeliness and availability.
The requirement: Changes to customer information must be reflected in the Customer Master Database and made available for transactional use within 24 hours of knowledge of the change. All sales reps should synchronize their personal handheld databases with the central database every evening (Monday through Friday) by 6 p.m. U.S. Pacific Time.
Table 3.17 shows the results of tracking one record through the process. Table 3.18 shows results after compiling and analyzing output from all records tracked for timeliness.
Table 3.17 • Tracking and Recording Timeliness
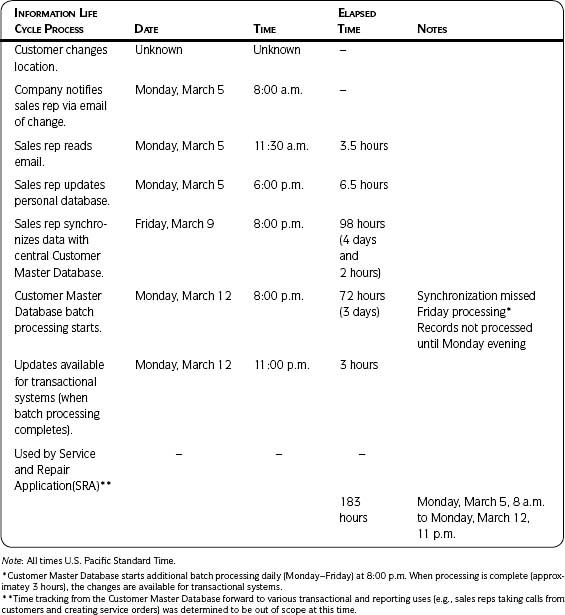
Table 3.18 • Timeliness Results and Initial Recommendations

Step 3.7 Ease of Use and Maintainability
Business Benefit and Context
Having the data available in the database so they can be used is not the same as how easy it is to use them. For example, sales information may be available in various databases, but the ability to pull the information together for a report may not be a simple matter.
Executives may request information on their top ten accounts, knowing that the information exists in the company databases. What is not known is that it takes a small team of people five working days each month to pull together what appears to be a simple report. In many cases if managers knew how long it took to get the information, they would either decide it was not worth the time spent or give their people time to determine how to make it easier to generate.
As with the example of use, it may also be important to understand how easy (or difficult) it is to maintain data. Knowing the degree of maintainability coupled with how important the data are to the business will help businesses make better decisions on investments in managing those data.
![]() Definition
Definition
Ease of use and maintainability are measures of the degree to which data can be accessed and used, and the degree to which data can be updated, maintained, and managed.
Ease of use and maintainability are closely related to timeliness and availability, and you may do much of the work for these dimensions together. They are separated here to make it easier for you to determine which aspects are most important to assess at any given time. If you have completed Step 4.5—Ranking and Prioritization AND have included the ability to collect and maintain the data as one of the criteria for ranking and prioritization, use those results for this assessment.
Ease of use and maintainability are impacted by the data model. Proper data architecture allows data reuse and availability.
Approach
1. Determine which data or information you want to assess for ease of use and why.
For example, you may have completed an assessment on duplication. You found that the knowledge workers create duplicates because it is easier to create a new record than it is to find an existing one. This would be a reason to focus on ease of use and maintainability for that process.
2. Evaluate the data for ease of use.
- Reference your information life cycle for any clues that are relevant to ease of use.
- You will most likely need to interview knowledge workers and have them show you their processes.
- Ensure that both knowledge workers and managers agree on the time being spent in interviews.
- Document and time the process steps.
3. Evaluate the data for maintainability.
See the suggestions for evaluating ease of use just given; they also apply when evaluating for maintainability.
4. Document results and recommended actions.
Include lessons learned, possible impact to the business, suggested root causes, and preliminary recommendations.
Step 3.8 Data Coverage
Business Benefit and Context
Coverage is concerned with how comprehensive the data available to the company are in accounting for the total population of interest. In other words, how well does the database capture the total population of interest and reflect it to the business? The idea of coverage can also be used when determining what population should or should not be included in any particular assessment, process, or project. (See the Capture Data section in Chapter 5.)
Approach
1. Define coverage in the context of your project, total population, and goals as it relates to business needs.
The following are examples of specific project definitions for coverage and total population:
Coverage—an estimate of the percentage of active installed equipment collected in the customer database.
- Total population: This is the installed base market (either customers or installed products) that exists in Asia Pacific.
- Goal: Determine how well the database being measured captures and reflects the total installed base market within the region.
![]() Definition
Definition
Data coverage is a measure of the availability and comprehensiveness of data compared to the total data universe or population of interest.
Coverage—an estimate of the percentage of all sites collected in the customer database.
- Total population: This is all U.S. sites for a specified strategic account that purchases your company’s products.
- Goal: Determine how well the database being measured captures and reflects the sites for the specified strategic account.
2. Estimate the total size of the population or data universe.
For example, assume you want to determine the installed market (either customers or installed products) that exists in a country for each product line. This will give you an idea of how large your database should be if all customers and/or installed products are to be captured in it. You may look at orders and shipments over the past few years to determine the number of customers. Work with your Sales and Marketing department and utilize the figures they already have.
3. Measure the size of the database population.
Perform record counts for records that reflect the population of interest.
4. Calculate coverage.
Divide the number of records obtained from doing step 3 by the estimated total population. This provides the percentage coverage in your database.
5. Analyze the results.
Determine if the coverage is enough to meet business needs. It is possible that the coverage will be greater than 100 percent. This indicates as much of a problem as a very low figure, such as 25 percent. Specifically, coverage numbers greater than 100 percent indicate other data quality problems such as duplicate records.
Consider if there is a connection between coverage and ease of use and maintainability. Does difficulty in use affect coverage? For example, assume that a sales rep is the source of customer information and the only way those data get into the database is by syncing the database and the rep’s handheld. How difficult is that process? Does the synchronization complete smoothly and in a timely manner? Is the sales rep reluctant to share information?
In one company, the sales reps did not want to share their customer information because from their point of view those data went into a “black box.” Once moved into the central database, the reps knew the data were being updated and transformed, but they had no visibility to what was happening and did not trust the data that came back to them through the synchronization process.
6. Document results and recommended actions.
Document assessment results, lessons learned, possible impact on the business, suggested root causes, and preliminary recommendations.
Step 3.9 Presentation Quality
Business Benefit and Context
Presentation quality refers to the manner in which information is presented. Presentation quality affects information when it is collected and when it is reported.
Reporting can mean presenting results of a quality assessment using graphs and charts, a file of data records with columns that are clearly labeled, a report showing sales results for the last month, and so on.
Assessing presentation quality involves two perspectives: the assessor’s perspective and the perspective of those using the information—the knowledge workers. For the assessor to understand the knowledge workers’ perspective, he or she must become familiar with how the information is being applied (its purpose) and the context of that usage (what happens when and where it is used). If there are inconsistencies, mistakes, or a design that facilitates misunderstanding, the assessor can then recommend that presentation quality be improved.
Important: Presenting information (for both collecting and reporting) in a way that is easy and effective from the knowledge workers’ perspective increases overall information quality.
![]() Definition
Definition
Presentation quality is a measure of how information is presented to and collected from those who utilize it. (Format and appearance support the appropriate use of the information.)
Approach
1. Define the information and associated presentation media.
- Decide which information will be checked for presentation quality.
- Discover when and where it is presented, and the media associated with its presentation.
- Find out who applies the information.
Refer to your Information Life Cycle:
- What are the various ways those data are obtained? For example, check user interface screens.
- What are the the original sources?
- When is information presented?
- Who are the people who use the information and for what reason?
You may be looking only at one medium, or you may be looking at multiple media that collect or store the same information. For example, you may want to compare all the ways that customers provide information about themselves, and the media may be an email campaign, an online Web survey, and a hardcopy response form completed during an in-person customer seminar. (See Example 1 in the Sample Output and Templates section.)
![]() Definition
Definition
Media are the various means of communication, including (but not limited to) user guides, Web surveys, hardcopy forms, and database-entry interfaces.
2. Outline the assessment process.
Plan a consistent process for the assessment. Decide who will perform it. Ensure that all those performing the assessment are trained and that they and their managers understand and support the activity.
3. Analyze the information and format for quality.
- Interview users to find out if they have trouble using the medium correctly.
- Compare information gathered through several media to determine whether any of the media are affecting information collection.
Use the following questions to evaluate presentation quality:
- Is the form design easy to follow?
- Are the data being requested clearly defined?
- Are the questions clear? Does the respondent understand what is being asked?
- Where appropriate, are there lists of possible answers (e.g., these may be shown as a dropdown list on a screen or as a list with checkboxes on a hardcopy)?
- Are there redundant questions?
- Are the possible answers complete—do they cover all potential responses?
- Are the possible answers mutually exclusive—is there only one correct response for one answer?
- Does the presentation require interpretation that could introduce errors?
- Are there complete process instructions?
If looking at presentation quality of reports, consider the following:
- Are report titles concise and representative of the report content?
- If using tables, are column and row headings concise and representative of the content?
4. Document results and recommended actions.
Include lessons learned, possible impact to the business, suggested root causes, and preliminary recommendations. For example, you may want to meet with the contacts responsible for each of the media, discuss the differences, determine what needs to be changed, and ensure that the database can support what is needed.
Sample Output and Templates
Example 1
One company conducted a data profiling assessment and found some quality issues. Through root cause analysis, they determined that some of their data quality problems were due to the many different methods of collecting customer information, particularly company revenue, number of employees, department, position level, and so on. Each of the various media presented the questions and offered possible responses in a different way. There was no process for standardizing responses and developing the questions. Table 3.19 gives an example.
Because there was no consistency in how the data were gathered, there were issues with how the data were entered and issues with being able to use the data later.
![]() Best Practice
Best Practice
Always consider who will be using the information, their purposes, and what makes sense for them when thinking about presentation.
Table 3.19 • Presentation Quality Comparison

Example 2
Collecting credit card information is common when ordering via a website. There are many ways to request credit card expiration dates, as shown in Table 3.20. How could these different ways of presenting and capturing dates affect the quality of the customer credit card information?
Table 3.20 • Presentation Quality—Collecting Credit Card Information
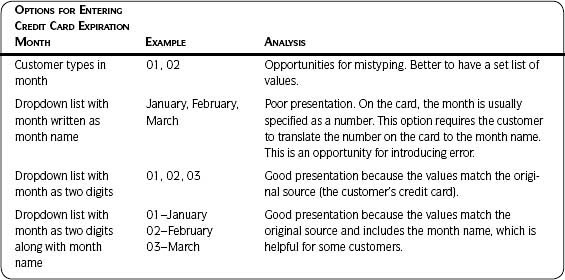
Step 3.10 Perception, Relevance, and Trust
Business Benefit and Context
It is often said that perception is reality. If users believe that data quality is poor, they will not use the data. This assessment looks at the quality of data from the knowledge workers’ point of view. It can be used to
- Understand which data are of most value to the business and therefore which data should have first priority in management and maintenance.
- Understand the data quality issues affecting the knowledge workers in order to prioritize them in a focused data quality project.
- Understand, from the knowledge workers’ point of view, the impact of poor-quality data on job responsibilities. Use the information to help build a business case for data quality efforts.
- Understand how knowledge workers feel about the data and then compare their perception to actual data quality assessment results.
- Address any gaps between perception and reality through communication.
This assessment takes the form of a knowledge worker survey. An effective means of conducting this type of survey is usually person to person, in the form of an interview using consistent questions and encouraging additional dialogue.
![]() Definition
Definition
Perception, relevance, and trust are measures of the perception of and confidence in the quality of the data; the importance, value, and relevance of the data to the business needs.
Approach
Prepare
Complete the following items prior to conducting your survey.
1. Define the goal of the survey.
Determine what decisions will be supported and what answers need to be obtained. What do you need to know and at what level of detail? Decide if answers need to be on a general business level or on a more detailed data subject level. (A field-by-field survey is often not effective; you will find resistance to answering the survey and will not get more useful results than you would if you asked questions from a broader perspective.)
2. Determine survey participants.
Select representative knowledge workers to participate in the survey. Determine whether you want only those who apply the information or those who also create and maintain the data. Document and include job title/function, name of participant, and total number of similar knowledge workers within the group.
3. Decide which survey method to use.
Examples include telephone, mailing, Web, email, and focus group.
4. Develop the survey instrument.
The survey instrument is the standard list of questions and possible answers with which you capture the survey responses. The format can be hardcopy or softcopy.
Your survey may be a few open-ended questions, where you want to encourage dialogue, rather than a structured set of questions. See the Sample Output and Templates section for an example of how such an approach was successfully used.
Keep in mind the people being surveyed and how they are using the data. Some will not have a tolerance for detail. You may have different surveys for different knowledge workers. For instance, a survey for someone doing data entry or using the data at the field level may be more detailed than a survey of a sales rep using the information for customer contacts. Even for those creating data, it may be more helpful to understand perceptions at a high level than at a detailed level.
If you are asking more questions in a more ordered fashion, consider the following suggestions to ensure that the information is presented clearly and that the survey respondents have enough background to complete the survey. Include
Introduction—This should have a customer service focus, call attention to the confidentiality of the survey (if that is true), and describe the benefit to the respondent, or the organization represented by the respondent. Include a deadline for returning the survey, who to call with questions, and so forth.
Body—This is the question-and-response section. It should be designed to be comprehensive but concise. Responses should be in a format easy for the respondent to complete and easy for those collecting the data to store and document. Questions should draw out the information you need to support your goals.
Conclusion—This should give the respondent the ability to provide additional information, insights, or feedback. End with a genuine thank you.
Determine the scale to be used for answering the questions. (See example at bottom of this page.)
General question statements for scaling could include:
- This information is important to me in performing my job. (Indicates relevance or value.)
- In my opinion, this information is reliable. (Indicates perception of quality.)
If needed, solicit the help of someone experienced in creating and administering surveys.
5. Develop the process for conducting the survey and capturing results.
Recruit those who will conduct the survey. Ensure that they have background on the survey and on why it is being conducted. Gain their support and enthusiastic participation. Provide training as needed to those conducting the survey so they can encourage participation and provide consistent results. Develop the method for capturing results and the process for reporting results.
6. Test the survey process.
Test for clarity to ensure that respondents understand and can answer appropriately. Revise as needed to create a participant-friendly questionnaire. Test entering the results into a survey tool, if one is being used. Test for ease of data entry and for the ability to analyze the survey results properly. Revise the survey as needed to create an effective data-gathering device.
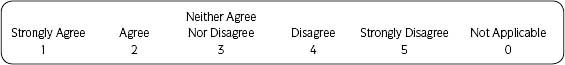
7. Create or extract the list of those to survey.
One project decided to survey knowledge workers who used a particular application. The results were going to be used to prioritize the data quality issues to address. The project team pulled a list of those with logins, only to find that the list was outdated. People had left the job, changed responsibilities, or shared logins and passwords with coworkers. A clean-up effort on the logins and the list of users had to be completed before the survey could be started!
Execute
While the survey is being conducted, remember these points.
1. Collect results.
2. Monitor the responses throughout the survey period to confirm that the survey is on track.
3. Stop the survey when the desired number of knowledge workers has been surveyed or the time period has ended.
Analyze
After the survey has been completed, do the following.
1. Confirm that all responses have been entered and documented.
2. Analyze results.
Compare perceptions of quality with the actual quality results from other data quality assessments. If asking the two general questions about importance/value and reliability/quality, you may want to plot results to an importance/reliability matrix and look for trends.
![]() Best Practice
Best Practice
Encourage candid responses: When performing a person-to-person survey, it is less intrusive to capture results by taking notes and then enter them into the survey tool later.
3. Document results and recommended actions.
Include a copy of the survey, those surveyed, those conducting the survey, the process used, and the number of respondents. Include specific survey results, lessons learned, impact to the business, suggested root causes of data quality problems, and preliminary recommendations.
4. Communicate.
Provide feedback to the survey participants. You may choose to hold a focus group meeting with respondents to discuss responses and perceptions. Use the survey results to achieve project goals.
Sample Output and Templates
To document the impact of data quality from a knowledge worker’s point of view, C. Lwanga Yonke, Information Quality Process Manager at Aera Energy LLC, conducted a survey of stakeholders. The survey was sent to more than 60 knowledge workers (engineers, geoscientists, technicians, etc.) and consisted of two requests: (1) “Describe an example where bad things happened because of poor quality information. If possible describe the impact in operational terms, then quantify it in terms of production loss and in terms of dollars”; and (2) “Repeat, but provide examples of good things that happened because you had quality information available.”
The anecdotes and examples received were compiled into one document, which was then widely distributed throughout the company. The power of the document came from the fact that it captured the voice of the information customers, not that of IT or the information quality team. All the anecdotes were from knowledge workers—the people best placed to describe the impact of information quality on their ability to execute the company’s work processes.
The document served several purposes:
- It helped build the case for action for various data quality improvement projects.
- It helped solidify wide support for Aera’s data quality process in general.
- It was used as a training manual to show others how to quantify the cost of poor quality information and the return on investment of information quality–improvement projects. Lwanga fondly recalls, for example, how the leader of one Enterprise Architecture Implementation project drew on several stories to rally support for incorporating specific data quality process improvements and data remediation work into his project plan.
Also see Step 4.1—Anecdotes for another example of how results from a similar survey were used to secure approval and funding for Aera’s Enterprise Architecture Implementation program.
Step 3.11 Data Decay
Business Benefit and Context
Data decay is also known as data erosion. It is a useful measure for high-priority data that are subject to change as a result of events outside a system’s control. Knowing data decay rates helps determine whether mechanisms should be installed to maintain the data and the frequency of updates. Volatile data requiring high reliability would require more frequent updates than less important data with lower decay rates.
Arcady Maydanchik, in his book Data Quality Assessment, presents 13 categories of processes that cause data problems (2007, p. 7). Five are processes causing data decay: Changes Not Captured, System Upgrades, New Data Uses, Loss of Expertise, and Process Automation. If you see these processes in your environment, you can be sure your data are decaying. If the business is dependent on data known to change quickly, do not spend time determining the decay rate—spend time on ways to keep the data up to date.
This step is less about the actual measure of data decay than it is about situations that may cause that decay and generally which data may decay most quickly. Combine that with your understanding of which data are most important and you can focus data quality prevention, improvement, correction, and management on them.
![]() Definition
Definition
Data decay is a measure of the rate of negative change to the data.
Approach
1. Quickly examine your environment for processes that cause data to decay and for data already known to decay quickly.
Some data are widely known to change quickly—for instance, in the United States, phone numbers and email addresses. If your business is dependent on phone numbers or email addresses, immediately put processes into place to keep the data up to date. Also, use what you learned from prior work on your Information Life Cycle.
2. Use results from prior assessments to determine data decay.
Reference statistics that include changes over time from previous data assessments, such as data integrity fundamentals, accuracy, and concurrency and timeliness. If you have profiled your data, you may have visibility to last update dates. Categorize by useful date ranges. If you have conducted an accuracy survey, use the data samples and assessment results for accuracy. (See Figure 3.11 in the Sample Output and Templates section.)
Look for information about rates of change from external sources. For example, does the postal service in your country publish rates about how quickly addresses change?
While data decay focuses on the rate of negative change to the data, also consider the rate of change from a data creation point of view. How quickly are records being created? If you are analyzing last update dates, you may want to analyze create dates at the same time.
3. Use processes already in place to determine data decay.
For example, one marketing group surveys their resellers every four months to update reseller profiles, contact name and job title information, and product sold. The vendor that administers the survey determines during data entry if the contact name has been added, deleted, or modified, or if it is unchanged. This information is used to see percent changes to reseller data.
4. Analyze results.
If you are also looking at create dates, look at the rate of new records being created. Is it more than you expected? Are you staffed to handle the rate of creation? Are new records being created because existing records are not being found? If so, are duplicate records increasing?
5. Document assessment results and recommended actions.
Include lessons learned, possible impact on the business, suggested root causes, and preliminary recommendations.
Sample Output and Templates
Figure 3.11 compares the results of updates in two countries for the same application. The application had a field called Customer Contact Validation Date that was supposed to be updated whenever the customer information manager contacted the customer. By looking at that field, some assumptions could be made about the rate of customer data decay.
In Country 1, 88 percent of the records had not been updated for more than 60 months (that is, 5 years) and only 12 percent had been updated in the last 18 months. Contrast that with Country 2, where 22 percent of the records had not been updated for more than 5 years, and 64 percent had been updated in the last 18 months.
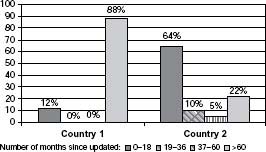
It would appear that Country 1 had had contact activity more than 5 years ago, yet the efforts had languished until 18 months prior to the analysis, when it appeared that renewed efforts were taking place. Another factor that came into play (which the numbers do not show) is that the customer contact validation date had to be manually updated.
The field for updating was not easily available and it was known that customers had in fact sometimes been contacted but the date had not been updated. This led to one recommendation that user screens be changed (presentation quality) to make the Customer Contact Validation Date field readily available to those contacting customers.
Step 3.12 Transactability
Business Benefit and Context
Even if the right people have defined the business requirements and prepared the data to meet them, it is important that the data produce the expected outcome: Can the invoice be correctly generated? Can a sales order be completed?
This type of assessment would usually be included in a standard project life cycle as part of testing. It is mentioned here to point out that those developing requirements, creating transform rules, and cleaning source data need to be involved in testing the data they helped clean or create. None of the standards or requirements are any good if the business processes cannot be completed satisfactorily.
Approach
1. Enlist the support of your project testing team.
This step cannot be done in isolation. Work closely with the testing team.
2. Ensure that the data you are testing are data that meet requirements.
This is a good use of data profiling to quickly look at the data prior to running them through the process.
![]() Definition
Definition
Transactability is a measure of the degree to which data will produce the desired business transaction or outcome.
3. Ensure that there is a feedback loop from the testers to those responsible for the data.
It is not unusual to find that data are changed in the course of testing to complete the transaction successfully. However, this fact does not always make it to those responsible for creating the data so they can learn from the changes and thus update data requirements.
4. Update data requirements based on the results and retest.
5. Document assessment results and actions.
Quick action should be taken in this step, as it should be in any standard testing cycle. Ensure that any needed changes are made to transformation rules or source data clean-up activities that may be part of the project.
Step 3 Summary
Congratulations! You have completed your data quality assessments (or have learned about them in preparation for an assessment). This is an important milestone in your project. Remember to communicate and document results and preliminary recommendations. Use the data dimensions when conducting an initial data quality assessment, setting a baseline for improvement, and implementing controls such as ongoing data quality monitoring and metrics.
You can also use the concepts of the data quality dimensions (not the step-by-step implementation). For instance, use the data quality dimension concepts when capturing highlevel requirements from business analysts. See Projects and The Ten Steps in Chapter 4 for a good example of how to use these concepts in requirements gathering.
Review the questions in the checkpoint box to help you determine if you are finished and ready to move to the next step.
![]() Communicate
Communicate
![]() Have stakeholders been apprised of quality assessment results, preliminary impact to the business, suspected root causes, and initial recommendations? What are the stakeholders’ reactions to what has been learned and your current plan of action?
Have stakeholders been apprised of quality assessment results, preliminary impact to the business, suspected root causes, and initial recommendations? What are the stakeholders’ reactions to what has been learned and your current plan of action?
![]() Are all members of the project team aware of the same information? What are the team members’ reactions?
Are all members of the project team aware of the same information? What are the team members’ reactions?
![]() Have you communicated possible impact or changes to project scope, timeline, and resources based on what was learned during the data quality assessment?
Have you communicated possible impact or changes to project scope, timeline, and resources based on what was learned during the data quality assessment?
![]() Checkpoint
Checkpoint
Step 3—Assess Data Quality
How can I tell whether I’m ready to move to the next step? Following are guidelines to determine completeness of the step:
![]() Have the applicable data quality assessments been completed?
Have the applicable data quality assessments been completed?
![]() Has necessary follow-up to the analysis been completed?
Has necessary follow-up to the analysis been completed?
![]() For each quality assessment, have the results been analyzed and documented?
For each quality assessment, have the results been analyzed and documented?
![]() For each quality assessment, have preliminary impact to the business, suspected root causes, and initial recommendations been included in the documentation?
For each quality assessment, have preliminary impact to the business, suspected root causes, and initial recommendations been included in the documentation?
![]() I f conducting multiple assessments, have results from all assessments been brought together and synthesized?
I f conducting multiple assessments, have results from all assessments been brought together and synthesized?
![]() Has the communication plan been updated?
Has the communication plan been updated?
![]() Has communication needed to this point been completed?
Has communication needed to this point been completed?