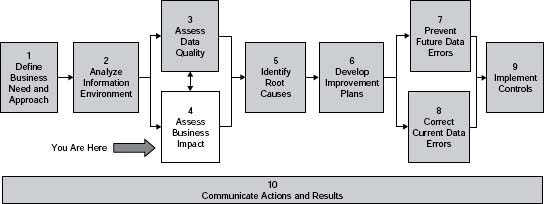
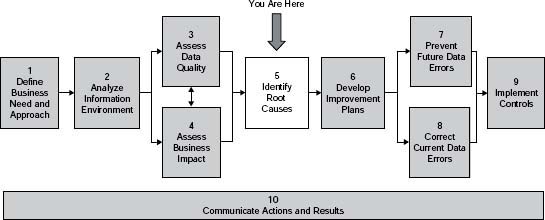
Step 4 Assess Business Impact
Introduction
Anything known about data quality issues immediately leads to the “So what” and “So why” questions—”What impact does this have on the business?” and “Why does this matter?” Add the question “What’s the return on my investment?” and you can see why assessing business impact is so important. Step 4—Assess Business Impact (see Table 3.21) provides a variety of techniques for answering those questions by determining the impact of poor-quality data on your company (see Table 3.22, page 165).
The techniques are presented in terms of relative effort from less complicated (1) to more complex (8). In this step, you assess the business impact of data quality problems using the techniques that are the most appropriate to your situation and time and resources available. There is one substep with detailed instructions for each of the eight business impact techniques (Steps 4.1–4.8).
As discussed in Chapter 2, business impact techniques are both quantitative and qualitative. Business impact is primarily based on how the information is used since that is when its value is realized. Remember the Apply phase of the Information Life Cycle? Impact can also be shown in other phases of the Information Life Cycle (e.g., impact due to increased maintenance costs—the Maintain phase).
If you have completed any data quality assessments, you should have documented potential impacts to the business as they were discovered. The synthesis from those assessments compiles all initial thoughts about impacts. Sometimes the thoughts differ—that is not unexpected and it is important to capture all points of view.
If you know specific results and the magnitude of the data quality issues, use that knowledge in this step assessment. You may want to assess data where there are a high number of errors or where the subject matter expert has already assigned a high priority. Use all of these results as input—now is the time to look at business impact specifically.
Table 3.21 • Step 4—Assess Business Impact

Table 3.22 • Business Impact Techniques

If a data quality assessment has not been conducted, but there are specific data quality issues of which the business is aware, you can still apply the techniques in this step to determine their impact. You may need to determine whether it is worthwhile to correct those issues, determine root causes, and prevent the issues in the future. In another case, your focus may be on building a business case for starting data quality activities.
With few exceptions, data quality should not be viewed in terms of obtaining a state of “zero defect” or perfect data. This very high level of quality entails cost and can take considerable time. More cost efficient is a balanced, risk-based approach that defines data quality needs and investments in improvements based on business impacts and risks.
Understanding the impact to the business of any data quality issues will help you establish the business case for information quality, gain support for investing in information quality, and make informed investment decisions.
Table 3.22 lists eight techniques for assessing business impact. (See also the Business Impact Techniques section in Chapter 2.)
Figure 3.12 shows a continuum of the relative time and effort for each technique, from generally less complex and taking less time (technique 1) to more complex and taking more time (technique 8).
The overall approach to this step is straightforward. First determine the techniques to use; second, assess the business impact using the techniques you have chosen; and third, synthesize results from the completed assessments if more than one has been done.
Choose Business Impact Techniques to Use
Become familiar with the various techniques and what is required for each. Determine which data issues you need to assess for business impact. Make an informed and conscious decision about which techniques to use and choose the ones that support your situation and data issues.
Think about relative time and effort. Note that the continuum shows relative effort—not relative results. You can understand business impact even without completing a full cost–benefit analysis. Less complicated does not necessarily mean less useful results; more complex does not necessarily mean more useful results (and vice versa).
The best results come from using the techniques most appropriate to your situation, time, and resources available. Many of them can be used alone or provide input to other techniques. Briefly document the techniques chosen, the rationale behind the decision, and the assumptions upon which the decision was made. See the Business Impact Techniques section in Chapter 2 for more considerations.
Assess Business Impact Using the Techniques Chosen
Complete the business impact assessment for each technique chosen using the detailed instructions provided in the substeps (Steps 4.1–4.8). Always document lessons learned, anything discovered about possible root causes, and preliminary recommendations.
![]() Best Practice
Best Practice
Be aware of what business impact means to different people and organizations. Do they want to see results in terms of
- Increased revenue (data quality will help us make more sales)
- Money saved (data quality will save us x dollars in costs)
- Operational efficiency (data quality will decrease production time by two days)
- Headcount (data quality will save us x number people)
- Risk (data quality will lower the risk of xyz)
- Other?
Try to translate and express your business impact results in the ways most meaningful to those from whom you need support.
Synthesize Results from All Business Impact Assessments Completed
Combine and analyze results from the assessments you have completed. Determine how the results will influence your recommendations, communication, and the rest of the project. You may find that data quality issues have more impact than thought. Develop and document recommendations, possible root causes, and other lessons learned from synthesizing results. Use these results to determine your next steps (e.g., communication needed, business action required, adjustments to project scope, timeline, and resources needed).
Step 4.1 Anecdotes
Business Benefit and Context
Collecting stories is the easiest and most low-cost way of assessing business impact. However, it can still produce good results. Stories are a way to provoke interest in a topic in a way that listeners can relate to their own experiences. The right story can engage leadership quickly—especially when it provides context for facts and figures. Even without quantitative data, a story can still be useful.
![]() Definition
Definition
Anecdotes are examples or stories of the impact of poor data quality.
Approach
1. Collect anecdotes.
Anecdotes are useful for immediate issues where the business is trying to get a first understanding of data quality impact. You can also document and save anecdotes as you collect them. When you hear about problems at your company caused by data quality, investigate and find out the specifics—who, what, when, where, and why. The anecdotes will be useful for future communication.
Collect examples or stories from news sources, websites, and industry that relate to your company, and specific company examples about actual business events.
See the Information Anecdote template (Template 3.8) in the Sample Output and Templates section for an easy way to collect anecdote specifics. Caution: Use the template for collecting results, not for presenting them. You will tell the story based on your audience and the point you need to make.
2. Get specific.
Use the following questions to get more specific as to the impacts learned through a particular incident:
Critical business decisions—What information is required to make those decisions? What happens if the information is wrong? How does that impact the business?
Key processes or key business flows—What information is required to carry out those processes? What happens if the information is wrong—to the immediate transaction, to other processes, to reporting, to decisions made from those reports, and so forth?
Business impact—What is the impact if the data are wrong (e.g., poor decisions, impact to customers, lost sales, increased rework, data correction)?
Master data (e.g., customer, vendor, item master, bills of material)—What processes or other transactions are dependent on the integrity of the master data? What will happen to the transactions if the master data are wrong? Are the data used to support transactions consistent with the system of record? Are other categories of data also impacted?
Transactional data—What will happen if the transactional records are wrong (e.g., the purchase order or the invoice is wrong)?
Required fields—How does the knowledge worker get those data? What happens if they are not available at the time the record is created? What will happen if incorrect data are entered just to satisfy a system requirement for an entry in a field?
3. Quantify the impact, if possible.
Quickly quantify parts of the anecdote, if possible. This is all about what you can learn with the least amount of time and effort, but you may be able to quantify the impact by asking questions such as “How often does this happen?” and “How many people were affected?” You can further analyze the impact of what you have found by using other techniques in this step.
4. Generalize the impact.
Take the isolated anecdote and determine the impact if the same experience were to be applied across the organization.
5. Determine how to tell the story.
Be creative. See the Sample Output and Templates section for an example of how one company used anecdotes to obtain funding for an Enterprise Architecture Plan supported by a comprehensive data quality program.
Use the anecdotes to support your communication needs. For example, do you have 30 seconds, or 3 minutes to tell the story? What does the audience need to hear? What point are you emphasizing?8 (See Step 10—Communicate Actions and Results.)
![]() Key Concept
Key Concept
Not long ago a manager was explaining how often management and investment decisions are based on real anecdotes and said: “Never underestimate the power of a good story!”
I had one manager tell me that many important business decisions are based on stories. Collecting and using anecdotes is a low-cost way of showing business impact.
6. Document your results.
Document the anecdotes along with source and supporting information. Include tangible and intangible impact quantified in numbers and dollars, if possible.
Sample Output and Templates
Template 3.8, along with Tables 3.23 and 3.24, illustrate how to document anecdotes on business impact.
![]() Warning
Warning
DO NOT use the Information Anecdote template in presentations! Use it to collect content, but don’t present it. Tell the story in your presentation in a way that will engage your audience.
The narrative that follows describes one company’s experience with using anecdotes to assess business impact (see pages 171–172).
Template 3.8 ∠ Information Anecdote

Table 3.23 • Information Anecdote—Example 1
TITLE: Duplicate Customer Master Records
DATA: Customer Master Records and Associated Transactional Records
PROCESSES: Order Management
PEOPLE: Customer Service Representatives
TECHNOLOGY: System A
SCENARIO:
- There are a large number of duplicate customer master records. Business transactions for one customer are associated with multiple master records.
- The company does not have one view of the customer and cannot make effective decisions to help the customer.
IMPACT (quantify if possible):
- When purchases by one company are associated with duplicate customer master records, the credit limit for that company can be unknowingly exceeded. This exposes our company to unnecessary credit risks.
- Customer service reps have difficulty locating a transaction placed on a duplicate account. This delays shipments or sends confusing messages to the customer.
- Duplicate records for one customer will contain differing information—it is not known which is correct.
- Duplicates increase costs of managing unnecessary records.
Submitted by:_________________
Contact information:________________ Date: __________________
Table 3.24 • Information Anecdote—Example 2
TITLE: Legal Requirement to Prove Pricing
DATA: Pricing for Government Contracts
PROCESSES: Procurement
PEOPLE: Purchasing Agents
TECHNOLOGY: System A
SCENARIO:
- For government contracts, the company has a legal requirement to prove pricing for the last ten years from the expiration of a contract. The only way to prove compliance is through pricing history.
- In the system, the pricing history is not created automatically—the audit trail is a single layer meaning that it only tracks one previous change. Therefore, in the system the only way to create the required history is to create a new price list line instead of changing the data for the existing line.
- Knowledge workers figure out quickly that an existing price list line can easily be updated—probably faster than adding a new one. Unless they know the reasons for adding the new line they will take the quickest route, with the result that pricing history is missing or incomplete—and the company is legally required to have this information.
IMPACT (quantify if possible):
- Compliance to legal requirements is at risk if this manual process is not followed. Check with legal about the penalty for noncompliance.
INITIAL RECOMMENDATIONS OR NEXT STEPS:
- Investigate technical solutions (modifications to system) to support this requirement.
- If possible, address the issue through complete audit trails at the database level so that complete histories are generated, regardless of training or access method.
- Address the issue through training. When teaching how to create and update price list lines, also include this process of creating new price list lines instead of changing the data for the existing line. Emphasize why the process needs to be done this way (compliance to legal requirements).
Submitted by:_________________
Contact information:________________ Date: __________________
Information Anecdote—Example 3
A popular story used at Aera Energy LLC, an oil company based in Bakersfield, California, revolved around the Winchester Mystery House in San Jose. As the story goes, Sarah Winchester, widow of the inventor of the Winchester rifle, believed her family was cursed and was told by a medium that she was being haunted by the ghosts of individuals killed by the Winchester rifle. The medium further advised her to move, build a new house, and keep that house under perpetual construction as a way to appease said ghosts. And so she did, spearheading a 38-year construction project with no apparent master plan; it only stopped when she died.
The result was a jumbled floor plan and strange features such as stairs that lead directly to ceilings, doors that opened to walls, and so on. In his book, Enterprise Architecture Planning,9 Steven Spewak draws an analogy between that house and information systems in most organizations, asserting that those systems are built like the Winchester Mystery House: a bunch of components poorly connected, poorly integrated, redundant, and disparate because there was no plan, no architecture, just a commitment to build.
Members of Aera’s Enterprise Architecture Plan (EAP) team used the story and Spewak’s analogy to build a case for enterprise architecture. The story became well known and popular in the company because it illustrated in simple terms that everyone could understand the importance of building an information systems architecture. Aera also used internally generated data to assess the financial impact of poor information quality.
As part of the process, the EAP team conducted an assessment of the time enterprise knowledge workers spent finding, cleaning, and formatting data before they could analyze them and make decisions that create value. The average time quoted was 40 percent. This statistic convinced Aera management of the need to implement the Enterprise Architecture Plan. The salary cost alone for everyone in the enterprise spending that much non-value-added time would pay for the project. However, the real opportunity was the increased time available for knowledge workers to spend on analysis and decision making.
The assessment consisted of a survey of well-respected engineers, geoscientists, and other knowledge workers in the company, chosen because of their credibility with their peers and with company leaders—the executives who had final authority over whether Aera was going to invest in enterprise architecture implementation and data quality.
Each of those interviewed was asked: (1) their opinion about the data quality at Aera and (2) specifically what percent of their time they spent looking for, reconciling, and correcting data before they could use it for analysis and decision making. Survey participants were also individually photographed in their work environments.
The stories and pictures were compiled and presented in a very creative way. Imagine a series of slides, each one containing the picture of one knowledge worker, the person’s name and pithy quote about data quality at Aera, and the percentage of time that person spent dealing with bad data. In the various presentations where the slides were used, their cumulative impact was the same: For most managers, knowing that their valuable engineers and geoscientists were spending 40 percent of their time dealing with bad data instead of making value-adding decisions provided a convincing argument for a radical change.
With the Winchester Mystery House anecdote and the internal pictures and interview results, Aera built compelling business impact stories, which resulted in the approval of a five-year, multimillion dollar project. The core of the subsequent Enterprise Architecture Implementation (EAI) program was an ambitious system development schedule, supported by a comprehensive data quality process. Since 2000, Aera has successfully replaced hundreds of disparate legacy systems with robust applications, as defined in their Application Architecture. Each project included specific plans to standardize work processes, prevent future data quality errors, and correct the existing data errors. Time spent finding, cleaning, and formatting data was reduced significantly.
Also see the story in Step 3.10—Perception, Relevance, and Trust about a survey of knowledge workers.
Step 4.2 Usage
Business Benefit and Context
Another easy way to show business impact is to list how the information is currently being used and its planned future uses.
- Current uses come from the Apply stage phase of the POSMAD life cycle. The Apply phase refers to any retrieval and use of the information, such as completing transactions, creating reports, making decisions, running automated processes, or providing an ongoing source of data for another downstream application.
- Future uses come from business strategic plans or road maps.
Documenting these uses is a low-cost way to show that the data have an impact on the business simply because of the number of ways they are used.
![]() Definition
Definition
Usage: Inventory of the current and/or future uses of the data.
Approach
1. List current uses.
Reference the Apply phase of the life cycle. Include actual uses of the information, the people and/or organizations using it, and the technical applications where it is accessed.
2. List future uses.
Look at business plans and road maps. Talk to the managers of the business process areas or the technical applications.
3. Quantify uses as much as possible.
Try to quantify current uses as much as possible. For example, determine the number of people using the information or the technical application, or the number of times it is being used. If those who apply the information have to access it through someone else, such as via a request to a reporting team, quantify the number of requests, how often, for how many records, and so forth. If the use is through a particular report, determine how many people receive the report and how often.
4. Document the results.
Capture the uses along with the sources and supporting data, tangible and intangible impact, any aspects that can be quantified, what was learned (any surprises?), and initial recommendations.
Even though most people know, at some level, that the information supports what they are doing, often even a simple list can startle the business into paying attention. One company, just by seeing a list of how the customer data were being utilized (account management, sales rep assignments, inquiry/interaction history, Customer Relationship Management (CRM), literature requests, direct mail projects, and event registration), needed very little additional motivation to support a project that would address known data quality issues.
![]() Best Practice
Best Practice
Be creative. Illustrate usage in an interesting way or craft a story that can be quickly told that demonstrates the business impact based on usage.
Sample Output and Templates
One company kept hearing that no one was using their Customer Master data. Upon investigation, however, it was found that those data were being used in the following ways:
- Market planning
- Web marketing
- Targeting
- Product launch teams
- Brand teams
- Data acquisition
- Customer finance and compliance
- As the base universe for other projects
After further questioning, it was also found that managers were already aware of how the information was currently being utilized, but the real value of the Customer Master data was as a foundational building block of the business strategy for the upcoming year. As a result, both current and future uses were included in any communication about business impact.
Step 4.3 Five “Whys” for Business Impact
Business Benefit and Context
The Five “Whys” are an easy technique that can be used by an individual, group, or team. It is often used in manufacturing to get to root causes (used in Step 5.1—Five “Whys” for Root Cause). In this step the same technique will be used by starting with the known data quality issue and asking “Why” five times to determine business impact.
![]() Definition
Definition
The Five Whys ask “Why” five times to get to the real business impact.
![]() Best Practice
Best Practice
Combine this technique with gathering information anecdotes. Once you get to the final “Why,” collect details about a specific situation, so you can better tell the story.
Approach
1. State the issue associated with poor data quality.
This can be an issue uncovered during a data quality assessment (Step 3—Assess Data
Quality) or some other known data quality problem where the specific data have not yet been assessed.
2. Ask “Why” five times.
Ask “Why” five times until you get to business impact. (See the examples in the Sample Output and Templates section.) You may do this exercise yourself or involve a few others. If working with others, explain what you are trying to accomplish. Make it an easy conversation. You don’t have to use the word “why” each time if another phrase will accomplish the same result. (Otherwise, you may start sounding like a two-year-old who constantly peppers his parents with “Why?” “Why?” “Why?”)
3. Document the results.
Capture what you have learned along with the source and supporting data, tangible and intangible impact, any aspects that could be quantified, what was learned (any surprises?), and initial recommendations.
Sample Output and Templates
Example 1
Issue
There are complaints about the quality of information in reports coming out of the data warehouse.
Ask: Why does the data quality matter?
- Answer: The data are used in reports.
Ask: What reports?
- Answer: The weekly sales reports.
Ask: Why do the weekly sales reports matter?
- Answer: Compensation for sales reps is based on these reports.
Ask: Why does that matter?
- Answer: If the data are wrong a highly effective sales rep may be undercompensated or another may be overcompensated.
Ask: Why does that matter?
- Answer: If the sales reps do not trust their compensation, they will spend time checking and rechecking the compensation figures—time better spent selling.
Being able to discuss poor information quality in terms of impact to sales reps is much more meaningful than saying, “The report is wrong.”
Example 2
Issue
Inventory data are incorrect.
Ask: Why does the inventory data matter?
- Answer: Inventory data are used in inventory reports.
Ask: Why do the inventory reports matter?
- Answer: Procurement uses the inventory reports.
Ask: Why (or how) does procurement use the inventory reports?
- Answer: Procurement makes decisions about purchases based on the inventory reports. Procurement orders (or does not order) parts and materials for manufacturing.
Ask: Why do procurement decisions matter?
- Answer: If the inventory data are wrong, then procurement may not purchase at the right time. Lack of parts and materials can impact the manufacturing schedule and delay products being sent to customers. This affects company revenue and cash flow.
Once again, being able to discuss poor information quality in terms of the impact of bad data on inventory levels, manufacturing schedules, and product time to customer is much more meaningful than saying, “The report is wrong.”
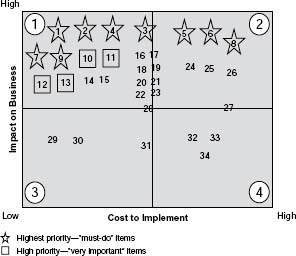
Step 4.4 Benefit versus Cost Matrix
Business Benefit and Context
This technique looks at relationships between benefits and costs. (See Figure 3.13 in the Sample Output and Templates section.) As it relates to data quality improvement, use it anytime you need to quickly review and prioritize solutions by comparing cost and benefits—for example, to determine which issues to address in your project in Step 1—Understand Business Need and Approach, to determine quality dimensions to assess in Step 3—Assess Data Quality, or to prioritize which recommendations to implement in Step 6—Develop Improvement Plans.
While this technique can be used on the basis of a thorough cost–benefit analysis, it is most useful with a first-pass “gut feeling” approach, in the form of a priority-ranking exercise. Ranking shows the relative business impact of the various options.
![]() Definition
Definition
Benefit versus Cost Matrix: Analyze and rate the relationship between benefits and costs of issues, recommendations, or improvements.
Approach
1. Determine who will be involved in the priority-ranking exercise.
Prepare those attending so that they have the background needed, support what you are trying to accomplish, and come prepared to participate. Determine the method for discussing and capturing rankings. Be creative. Use a whiteboard or large sheets of paper with sticky notes or dots, or use a presentation program such as PowerPoint.
Any method that allows a quick change to rankings if needed and that will enhance, not hinder, the flow of the prioritization, is suitable.
2. List and clarify each item, action, or recommendation to be prioritized.
Be clear on what is being prioritized. Bring a documented list of items to be prioritized for each of the attendees.
3. Define and name each axis on the matrix—what benefit and cost mean.
Use the terms that are most meaningful to those doing the prioritizing. Give examples so everyone is clear on meanings. Come to the meeting with your recommendation, but be prepared to make adjustments if needed. (See Figure 3.13 in the Sample Output and Templates section.)
Benefit may mean
- Impact—positive impact to the business if the recommendation is implemented
- Payoff—performance and features
- Any other definition of benefit that is meaningful to your company
Cost may mean
- Effort—the relative effort to implement a recommendation
- Cost—the relative outlay in dollars
- Any other definition of cost that is meaningful to your company
4. Determine criteria for assessing the benefit and cost for each item to be prioritized.
Criteria can be qualitative (e.g., customer perspective) or quantitative (e.g., effects on cycle time). Discuss what is important to your particular organization or processes.
Use the following examples of criteria to get you thinking:
- Support of the business issue (keep it visible)
- Improved customer satisfaction
- Report availability—decreased time from receiving data to having them available in reports
- Simplified business or data management processes
- Time to implement the recommendation
- Cost versus expected profits or savings
- Skills and resources required to implement the solution
For example, if customer satisfaction is an important criterion for benefit, you would ask when ranking: “What is the impact of recommendation number one on customer satisfaction (low to high)?
If time to implement is an important criterion for cost, ask: “What is the time to implement for recommendation one (from low to high)?” You can have multiple criteria to balance when ranking, but make it a manageable number.
5. Rank and place each recommendation.
Use the criteria previously identified. Ranking can be done by the team as a whole or individually. One approach is to let each individual quickly write down his or her ranking and then discuss the rankings as a group. Another is to place the various options on the matrix so the varying opinions can be seen and discussed and then agreement reached on final placement. The goal is to reach agreement for each of the placements fairly rapidly. Ensure that the final ranking is visually placed on the matrix.
6. Evaluate results.
Discuss the results of the placement. Evaluate each item according to the definitions within each quadrant. (See Figure 3.14 in the Sample Output and Templates section.) Agree on final placement on the matrix.
7. Document results.
Include any important assumptions or considerations used to determine the rankings and final priority.
Sample Output and Templates
Example 1
Figure 3.15 shows how the Benefit versus Cost Matrix in Figure 3.13 is used to prioritize 34 specific recommendations that came out of a data quality assessment project. The recommendations were placed on the chart. The team then analyzed and prioritized them.
The result was nine top “Must-Do” recommendations to implement and four “Very Important” recommendations. All recommendations were documented. The remaining 21 recommendations were listed by the impact/cost priority.


Example 2
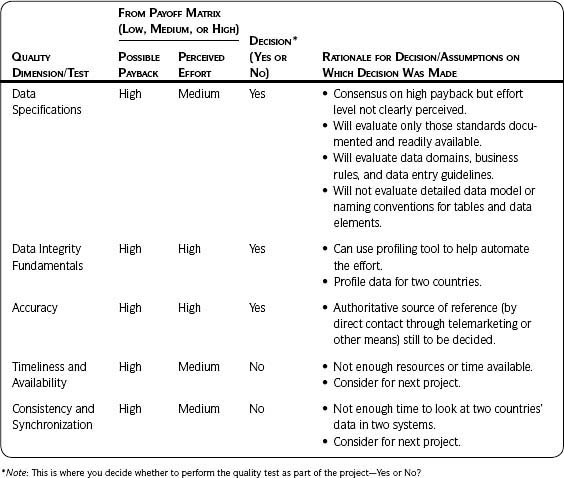
Table 3.25 shows the documentation of results from using the Benefit versus Cost Matrix to prioritize which dimensions of quality should be assessed. Note that the terms “Possible Payback” and “Perceived Effort” were the definitions used for Benefit and Cost, respectively, and the matrix was called a “Payoff” matrix. Each of the data quality dimensions was discussed and ranked.
Table 3.25 • Example 2—Prioritized Data Quality Tests
Step 4.5 Ranking and Prioritization
Business Benefit and Context
Prioritization indicates relative importance or value. Thus, anything that has a higher priority than any other thing implicitly has a higher impact on the business. This step ranks the impact on business processes when the data are missing or incorrect. You can use it to help determine which data are worth assessing for data quality.
![]() Definition
Definition
Ranking and prioritization is the ranking of the impact of missing and incorrect data on specific business processes.
Key elements in determining the importance of data are usage and the business risks and opportunities associated with it. The importance of data quality will vary for different data and for different uses of the same data. Ranking and determining business impact are best performed by those who actually use the data or those who are designing new business processes and practices that will reshape data usage.
The task is to rank the impact of missing and incorrect data on specific business processes using the approach described here, once again a priority-ranking exercise.
Approach
1. Determine the business processes and the uses of the information that will be prioritized.
Focus on the business processes that use and retrieve the information. Refer to the Apply phase in the Information Life Cycle POSMAD. A facilitated session is the most effective method for conducting the ranking. Preparation is required to determine business focus and the specific processes and data to rank.
The ranking can be applied to specific information or data groupings consisting of several related elements.
Examples
- To complete a mailing to a customer, one must have complete name and address information.
- To make a sale of a high-priced product, one must know the technical buyer name, the decision maker, the sales cycle state, and so forth.
- To establish a CRM program, in addition to customer name and address, one must know the customer profile with attributes about a customer’s behavior.
- To pay a vendor, one must have complete and current invoice information.
2. Determine who will be involved in the prioritization exercise.
Based on the business processes and on information usage, decide who to invite to the session.
It helps to involve people representing various interests, including senior managers. Then the very process of considering these questions becomes a way to facilitate understanding of the various uses and importance of data, build data quality awareness, and support data quality improvement.
Prepare those attending so they have the background needed, support what you are trying to accomplish, and come prepared to participate. Determine the method for discussing and capturing the rankings. Use one where you can quickly change the rankings if needed. The method should enhance, not hinder, the flow of the prioritization.
3. In the ranking session, agree on the final processes and information to be ranked.
Ensure that there is understanding and agreement among the participants on what is to be ranked and why. Explain the process of ranking, and give examples from your business of each ranking on the scale to be used (see Table 3.26). For instance, an incorrect prefix in a name would not cause complete failure of the mailing process (i.e., the ability to deliver the mail) and so it may be ranked a C or a D. However, an incorrect zip code would cause complete failure (i.e., mail could not be delivered) and so it would be ranked an A.
4. Rank the data for each business process.
The facilitator will lead the attendees through the ranking. For each process, discuss the impact of poor-quality data by asking: “If this information were missing or incorrect,10 what would the impact be on the process?”
For example, if “Contact Name” were missing or incorrect, what would be the impact to the Mailings process? What would be the impact to the Territory Assignments process?”
As each of these questions is answered, a value judgment is made by the individual attendees. Go through each piece of information and each process. The leader should encourage discussion as the ranking continues.
The questions can apply to the organization as a whole, to a specific division, or to business processes. You may choose an alternate scale such as high, medium, low, or 1, 2, 3.
Consider the following additional questions:
- What decisions do we make that rely significantly on these data?
What are the impacts of these decisions in terms of
– Lost revenue?
– Increased costs?
– Delays in responding to changing business conditions?
– Regulatory and legal exposure and risk?
– Relations with customers, suppliers, and other external parties?
– Public embarrassment and corporate standing?
– Business process halts or unacceptable delays?
– Substantial misapplication of resources?
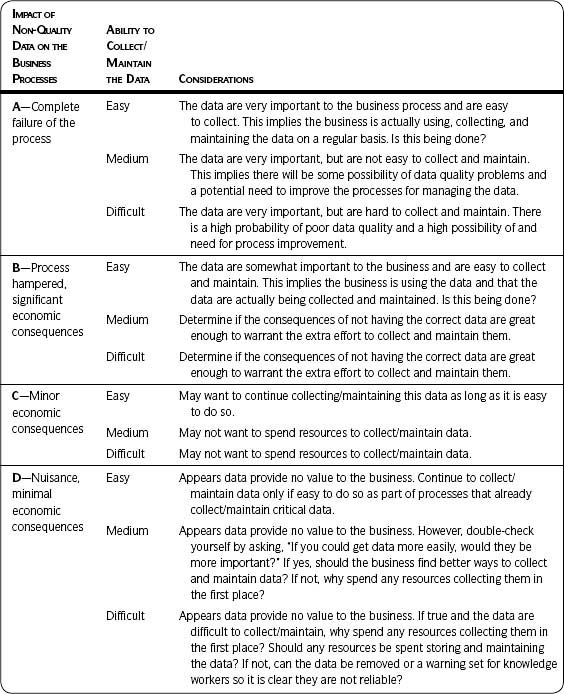
Table 3.26 • Scale for Ranking Data
| A | = | Complete failure of the process or unacceptable financial, compliance, legal, or other risk is likely. |
| B | = | Process will be hampered and significant economic consequences will result. |
| C | = | Minor economic consequences will result. |
| D | = | Nuisance, but minimal economic consequences, will result. |
| N/A | = | Not applicable. |
This is a subjective process, but it has proven to be very effective. There is no “correct” ranking; it depends on the use of the data and personal opinion. The process does not call for in-depth analyses. The initial “gut feel” ranking is usually correct and should be the one used.
Participants in the exercise will not always rank data the same way. If you are ranking for different uses or processes, let each participant rank the data individually. For instance, the customer’s job title for reporting may be given a high ranking by a sales rep who personally contacts that customer. Or a marketing group may rank job title low if they are not using it in their mailing process. Realize that the given data should be managed to the highest level of business impact indicated. A ranking of C by one business process and a ranking of A by a different process indicates that the data should be treated as an A.
![]() Warning
Warning
Avoid “analysis paralysis” in this technique by moving quickly through the rankings and relying on your initial reactions.
5. Complete an additional level of ranking, if needed.
Rank each data element based upon the ability to collect and maintain it:
1 = easy; 2 = medium; 3 = difficult.
Rank the ability to collect and maintain separately only if they seem to differ significantly.
6. Assign a final overall ranking.
There will be differences in the individual rankings. The final overall ranking is the highest one given by any of the processes. (See Table 3.27, Example—Ranking Results, in the Sample Output and Templates section.)
7. Analyze the rankings.
The analysis shows the impact to the business and can be used to prioritize what information is important enough to improve. (See Table 3.28.)
8. Document the results.
Capture what was learned (including both surprises and confirmations of opinion) and initial recommendations based on the results. In one session, the area sales manager found that his sales reps were responsible for collecting information that they didn’t use, but which they passed through to Marketing. The information was essential to the marketing processes. This knowledge resulted in a promise by the area sales manager to convey and motivate his sales reps to spend the time required to ensure the accuracy of the information.
![]() Key Concept
Key Concept
While the rankings themselves are very useful, one of the biggest benefits from this technique is the conversation between those who utilize or affect the quality of the same information, yet may not usually interact with each other. A successful session will result in increased understanding and cooperation between those who are responsible for the quality of the information and those who depend on the information.
Sample Output and Templates
Situation: The business wanted to understand the impact of poor-quality customer data to its processes. One representative from each team (Sales, Marketing, and Data Management) participated in a focused session. Prior to this facilitated session, each of the representatives had been educated about the reasons for the session and had agreed that the time spent would be worthwhile; they came prepared to participate.
One critical business process from each of the areas was chosen for ranking:
- Marketing chose mailings (for special events, promotions, subscriptions, etc.).
- Sales chose territory management (for maintaining sales rep geographic assignments within each district).
- Data management chose reports (for making business decisions, such as account lists and territory assignments).
Each piece of information was discussed, using the approach outlined in this step. Table 3.27 summarizes the outcome. The column Final Overall Ranking uses the highest-ranked impact from any of the processes. For example, if one process ranked the impact of missing or incorrect data as A and another ranked it as C, the final overall ranking was A, not the average (B).
Note that you may choose to rank impact alone. Rank the ability to collect/maintain the information only if you think the knowledge gained will help you make decisions and take action in some way. Table 3.28 will help you interpret the ranking results and provide input to possible actions.
Table 3.27 • Example—Ranking Results
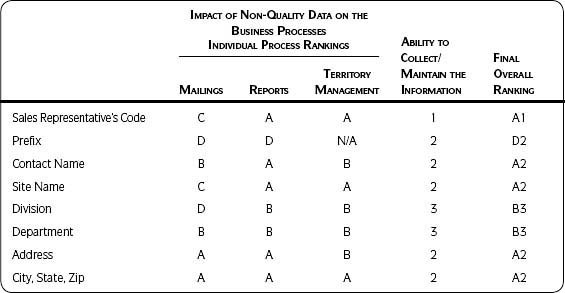
Table 3.28 • Ranking Analysis
Step 4.6 Process Impact
Business Benefit and Context
Workarounds hide poor-quality data. They become a normal part of business processes, and people don’t realize that change is possible—that poor-quality data cause costly problems and distractions that are not necessary. By showing the effect on the processes and the resulting costs, the business can make informed decisions about improving issues that were previously unclear.
This technique will most likely be done by a single person working with other individuals or by a small team with knowledge of the business processes.
![]() Definition
Definition
Process impact illustrates the effects of poor-quality data on business processes.
Approach
1. Outline the business process when good data are used.
Use the Information Life Cycle from Step 2—Analyze Information Environment as a starting point to detail the business process first with high-quality data. (See Figure 3.16 in the Sample Output and Templates section.)
2. Outline the Information Life Cycle with poor-quality data.
Include additional support roles and activities needed to deal with the bad data. (See Figure 3.17 in the Sample Output and Templates section.)
3. Analyze the differences to the process with good data and compromised data.
Often just by illustrating the differences, it becomes clear that action needs to be taken. It does not always require that costs be quantified. Capture any recommendations for improving the business processes.
4. Quantify the impact, if needed and if possible.
Look at steps in the process that lend themselves to quantifying. Using the example in the Sample Output and Templates section, how much time is spent investigating and resolving rejection issues? Who is responsible and how much is that person’s time worth? Look at Step 4.7—Cost of Low-Quality Data for additional ideas for quantifying impact.
5. Document the results.
Ensure that your documentation includes supporting data needed to understand the results, any tangible and intangible impact, and quantified impact in dollars, if possible. Include initial recommendations for improving the business processes.
Sample Output and Templates
Example
In this example a supplier master record is required in the ERP (Enterprise Resource Planning) system to place supplier orders, pay invoices, and reimburse employee expenses.
- Company buyers or employees submit a request for a supplier master record setup through an application outside the ERP.
- A central data administration team uses the requests to create the supplier master record in the ERP.
- If the setup request is complete, the central data administration team creates the supplier master record in the ERP so that orders, invoice payments, and reimbursements can be processed.
Figure 3.16 shows an Information Life Cycle process with good data. Analysis demonstrated that setup requests could be rejected for a number of reasons:
- Incomplete or wrong information
- Duplicate request
- Not approved
- No document
- Incorrect employee request
- Other
The majority of setup request rejections were the result of incomplete or wrong information.
Figure 3.17 shows the same process with poor data. What is the impact of rejected setup requests?
- Time delay in placing orders with suppliers, paying supplier invoices, and reimbursing employees for expenses
- Rework by the central data administration team (rejecting the request, ensuring investigation and resolution, re-reviewing the updated request)
- Rework by the requestor who submitted the original request (to investigate and resubmit)
- Rework by the support employee (to investigate and resolve)
- Frustrated employees
- Frustrated suppliers, many of whom are also customers of the company
- Loss of service to the company because payment has not been made

Step 4.7 Cost of Low-Quality Data
Business Benefit and Context
Poor-quality data cost the business in many ways: waste and rework; missed revenue opportunities; lost business, and so forth. This step quantifies the costs that may have only been understood by stories or observation. Quantifying costs shows impact with a measure best understood by the business—money.
![]() Definition
Definition
Cost of low-quality data: Quantify the costs and revenue impact of poor-quality data.
Approach
1. Identify the key indicator of poor data quality.
The key indicator provides the basis for your research and calculations. One example is the mailing process, which could be mailing catalogs or other promotional material to customers. Marketing groups track the specific mailing events, the nature of the mailing (catalog, letter, brochure, etc.), the total pieces mailed, the number of returns (undeliverable), and positive responses, if applicable.
The number of returns or undeliverables could be used as an indicator of poor-quality data, since mail is returned if the address is incorrect. If there are issues with undeliverable mail for other processes (such as a high number of returns when mailing invoices or mailing responses to insurance claims), those can also be included in an assessment.
The following can provide input for selecting your key indicators:
- Issues identified during your data quality assessment in Step 3—Assess Data Quality
- Other data quality issues known to impact the business but for which no formal data quality assessment has been conducted
- Processes known to be suboptimal and data are likely contributors
- Other business performance measures based on business vision, mission, strategy, and goals and objectives—where the poor quality of information appears to have a significant impact
- Results from other business impact assessments, if applicable
For example, if you have completed Step 4.5—Ranking and Prioritization, you may decide to concentrate on information ranked as having a high impact on the business processes.
Find where the business is feeling the pain and connect your key indicator to that. Start with one business process or one area to determine if the impact is significant. You may then want to add in other business processes or areas to show a broader impact across the enterprise.
2. Define/verify the Information Life Cycle of the key indicator.
Reference any work done in Step 2—Analyze Information Environment that will help you understand other processes or uses of the information that are associated with the key indicator.
3. Determine the types of costs to include in the calculations.
Of course it is the goal of every for-profit organization to maximize revenues and minimize costs. But we need to get more specific in order to quantify costs. Nonprofits or other organizations may have different goals, but the suggestions that follow from two data quality experts can help you identify the kinds of costs most important to your organization and therefore where you should concentrate your business impact assessment. I recommend going to the sources and reading their explanations in depth to help you further understand the items listed.
David Loshin discusses (1) hard impacts—those that can be measured, and (2) soft impacts—those evident to the observer but difficult to measure. He further explains impacts to operational, tactical, and strategic domains. Table 3.29 outlines costs due to poor-quality data for each of these categories.
Loshin also characterizes the impacts of poor-quality data in four categories, those that (3) decrease revenue, (4) increase costs, (5) increase risk, and (6) lower confidence. Table 3.30 outlines costs due to poor-quality data for each of these categories.
Larry English presents three categories of costs: (1) process failure costs—a process does not perform properly as a result of poor-quality information; (2) information scrap and rework costs—where scrap means rejecting or marking data in error and rework means the cleansing of defective data; and (3) lost and missed-opportunity costs—revenue and profit not realized because of poor information quality. Table 3.31 summarizes costs due to poor-quality data within each of these categories.
Table 3.29 • Loshin’s Poor-Quality Data Types of Costs—Categories 1 and 2
| (1) Hard impact—effects that can be measured |
|
| (2) Soft impact—effects evident to the observer, but difficult to measure |
|
| Impacts by Domain |
|
Source: David Loshin, Enterprise Knowledge Management: The Data Quality Approach (Morgan Kaufmann, 2001), pp. 83–93. Used by permission.
Table 3.30 • Loshin’s Poor-Quality Data Types of Costs—Categories 3 and 6
| (3) Decreased Revenue |
|
| (4) Increased Costs |
|
| (5) Increased Risk |
|
| (6) Lowered Confidence |
|
Source: David Loshin, “The Data Quality Business Case, Projecting Return on Investment.” Informatica White Paper, June 2006. Used by permission.
4. Calculate the costs you have chosen.
Use the Direct Cost template (Template 3.9) in the Sample Output and Templates section.
5. Calculate the impact to revenue.
Use the Missed Revenue template (Template 3.10) in the Sample Output and Templates section.
6. Document the costs and assumptions.
Document all assumptions and formulas upon which the calculations were made. If there is disagreement later, the assumptions can be changed and the numbers recalculated.
Table 3.31 • English’s Poor-Quality Data Types of Costs
| Process Failure Costs |
|
| Information Scrap and Rework Costs |
|
| Lost and Missed-Opportunity Costs |
|
Source: Larry P. English, Improving Data Warehouse and Information Quality (Wiley, 1999), pp. 209–213. Used by permission.
Sample Output and Templates
Costs
Template 3.9 provides a starting point for gathering and calculating the costs of poor-quality data. Create a spreadsheet file. You may have more than one worksheet depending on how many types of costs you will be calculating.
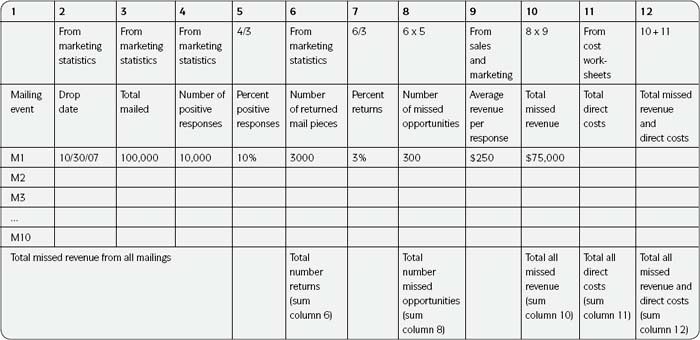
Using the previous example of mailings, let’s assume that ten mailings were completed in a one-month time period and that Marketing kept statistics about each mailing event. One spreadsheet will be used for each mailing event (M1-M10). If your time period is one month, and the activity in that one month represents an average month, you can further estimate costs on an annual basis by multiplying your results by 12.
Look at each of the mailings. What was the cost to print the piece (a catalog, a brochure, etc.). What were the postage costs? What was the cost for the return postage? Are there any labor costs that need to be included? What was the purpose of the mailing and is there a way to determine a positive response? For example, if the mailing was an invitation to a sales seminar, how many recipients responded? How many actually showed up to the event? How many of those purchased? What was each purchase worth?
Be sure to have a summary sheet that pulls together the final sums for all events of costs and impact to revenue if both are completed.
Missed Revenue
Template 3.10, Missed Revenue, is an example of calculating missed revenue based on our mailings example. A key assumption is that customers who would have received the mailing but did not (because of bad addresses) would have had the same positive response as those who did receive the mailing.
Template 3.9 • Direct Costs
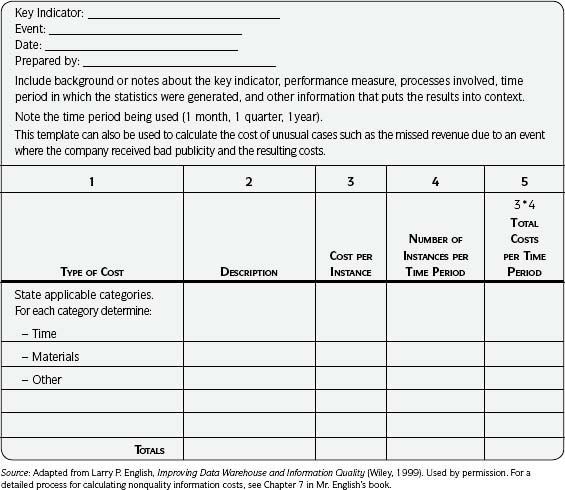
The first row indicates the column number. The second row indicates the source of the data or the formula for the calculation. Column 11 brought in costs calculated in separate worksheets using the Direct Cost template. The last line, Total Missed Revenue from All Mailings, also includes totals for other columns where it makes sense, for example, Total Number of Returns and Total Number of Missed Opportunities.
Template 3.10 • Missed Revenue
Step 4.8 Cost–Benefit Analysis
Business Benefit and Context
Cost–benefit analysis and return on investment (ROI) are standard management approaches to making financial decisions. Your company may require this type of information before considering or proceeding with any significant financial outlay—and investments in information quality improvement are often significant. Management has the responsibility to determine how money is spent and will need to weigh its investment options.
It is unlikely that a technique this involved will be necessary for most business impact assessments. It may be needed for very large investments, but I have seen large investments approved for data quality based on results from less time-consuming techniques.
![]() Definition
Definition
A cost-benefit analysis compares potential benefits of investing in data quality with anticipated costs, through an in-depth evaluation. It includes return on investment, that is, the profit calculated as a percentage of the amount invested.
Approach
Cost-Benefit Analysis
A cost-benefit analysis evaluates if the benefits of a new investment or business opportunity over a given time frame outweigh its associated costs.
1. Look for and use any standard template or form employed by your company for this purpose.
This form probably already exists somewhere. Check with your manager or someone involved in finance or the budgeting process. The form will contain sections for both costs and benefits.
2. Identify the costs associated with the new investment or business opportunity.
Include human resources, training, hardware, software, and support costs.
3. Identify the potential additional revenues and other benefits that will result.
Being able to identify the benefits of high-quality data has been a perennial challenge. The value of data improvements and the cost of poor-quality data are opposite sides of the same coin. Use output from other business impact techniques to present the benefits.
4. Identify the cost savings.
Cost savings are the difference between benefits and costs.
5. Estimate a timeline for the anticipated revenues and expected costs.
6. Evaluate the benefits and costs that cannot be quantified.
Though the form may not ask for these, include them in a comment area or cover letter. Benefits and costs that cannot be quantified should still be made visible.
Return on Investment
ROI compares the benefit (or return) on an investment compared to the cost or amount of money invested. It is the profit calculated as a percentage of the invested amount.
![]() Definition
Definition
Return on investment is the profit calculated as a percentage of the amount invested.
1. Calculate the ROI.
What is included in the gains and costs can be modified to suit your situation. You may look at cost savings, incremental profit, or value appreciation. Use input from the cost–benefit analysis. The formula for calculating ROI is
2. Evaluate the ROI.
The investment should have a positive return.
3. Compare your ROI to the ROI of other opportunities.
Having a positive ROI is not enough. The investment will also be compared to the ROI of other opportunities before being undertaken. Be aware of the competition for money and resources within the company.
Step 4 Summary
Congratulations! Assessing business impact is yet another important milestone in your project. Remember to communicate and document results and recommendations. Use the results to make good decisions about your next steps—communication needed, business action and effect on project goals, scope, timeline, and resources needed. Review the questions in the checkpoint box to help you determine if you are finished or ready to move to the next step.
![]() Communicate
Communicate
![]() Have management, business, and stakeholders been apprised of quality assessment results, impact to the business, root causes, and initial recommendations?
Have management, business, and stakeholders been apprised of quality assessment results, impact to the business, root causes, and initial recommendations?
![]() Do all members of the project team have the same information?
Do all members of the project team have the same information?
![]() Have you communicated the impact of the quality results to the rest of the project team, along with impact on project scope, timeline, and resources?
Have you communicated the impact of the quality results to the rest of the project team, along with impact on project scope, timeline, and resources?
![]() Checkpoint
Checkpoint
Step 4—Assess Business Impact
How can I tell whether I’m ready to move to the next step? Following are guidelines to determine completeness of the step:
![]() Have impacts to the business been assessed?
Have impacts to the business been assessed?
![]() For each business impact assessment, have the results been analyzed and documented?
For each business impact assessment, have the results been analyzed and documented?
![]() Has necessary follow-up to the analysis been completed?
Has necessary follow-up to the analysis been completed?
![]() For each impact assessment, have initial recommendations and anything learned that could effect possible root causes been documented?
For each impact assessment, have initial recommendations and anything learned that could effect possible root causes been documented?
![]() If conducting multiple assessments, have results from all assessments been brought together and synthesized?
If conducting multiple assessments, have results from all assessments been brought together and synthesized?
![]() Has the communication plan been updated?
Has the communication plan been updated?
![]() Has necessary communication been completed?
Has necessary communication been completed?
Step 5 Identify Root Causes
Introduction
There are usually multiple ways of dealing with problems that arise from data quality—all of which require different levels of time, money, and human resources. There is a tendency to jump to a solution that appears to be the most expedient in order to deal quickly with a situation. The result is that the symptoms are often treated rather than the fundamental underlying problem that caused them.
Root cause analysis looks at all possible causes of a problem, issue, or condition to determine its actual cause (see Table 3.32). Often time and effort are spent treating symptoms of a problem without determining its actual causes, which would prevent the problem from recurring. The primary goals in this step are to find out why a problem happened and what can be done to prevent it from happening again.
It is not unusual to find that when a data quality issue is uncovered the company only corrects the data—sometimes at great cost for large clean-up efforts. Then it is back to business as usual until a few years later, when those same issues cause the business to once again invest in data clean-up. This costly and unproductive cycle misses root cause analysis—which is essential for prevention.
Common Situations Needing Root Cause Analysis
Following are two common situations where root cause analysis is important.
In the Course of a Data Quality Assessment Project
Assessments of one or more data quality dimensions have been completed, either by you alone or as part of a team, and specific incorrect data have been identified and located. For the data supporting a genuine business need, you now want to identify root causes before correcting the data errors. In this case you should already have an Information Life Cycle, so use what you know at this point. You may have to go to an additional level of detail in your life cycle to get to root cause.
Table 3.32 • Step 5—Identify Root Causes
| OBJECTIVE |
|
| PURPOSE | Ensure that recommendations and future improvement plans focus on the true causes of data quality issues. |
| INPUTS | Possible root causes, lessons learned, and preliminary recommendations from all previous steps completed, such as Output from Step 2—Analyze Information Environment
Output from Step 3—Assess Data Quality
Output from Step 4—Assess Business Impact (if applicable)
Necessary communication completed, along with updated communication plan |
| TOOLS AND TECHNIQUES |
|
| OUTPUTS |
|
| CHECKPOINT |
|
To Address a Specific Issue Impacting the Business
Root cause analysis is necessary to address a specific data quality issue that has been identified. This issue is most often related to an urgent problem that has recently caused major impacts to the business—services cannot be provided, a production line is down, products are not shipped, orders cannot be taken—and it is suspected that data quality is a significant factor. Once the issue itself has been addressed, management wants to ensure that it will not happen again.
It may be that the specific issue did not cause an emergency but is something that everyone knows about and has accepted as a cost of doing business. You may decide to spend time on root cause analysis to address the issue with the hope of stopping the constant waste of time and money it creates. In this case, you probably don’t have an Information Life Cycle, so you will need to define one, at least at a high level.
Approaches to Root Cause Analysis
Three of the approaches to root cause analysis (Table 3.33) are detailed in this step. Depending on the urgency of the business issue and the complexity of the root causes you discover, you may want to use just one approach; combinations of the three; or the fastest approach, the Five “Whys,” to get started.
Note that the instructions for the root cause techniques include less detail than in other steps. This is not because root causes are not important but because you should have already been collecting potential root causes as you went through your project and should have some ideas about what to do at this point. This applies whether you have gone through Steps 1 to 4 at a high level or at a more detailed level. Suggestions regarding potential root causes can be found in the previous steps and examples.
You may have a number of data quality issues and need to prioritize which are most important to look at first for root cause. After that, what is needed is a commitment to gather the right people and work through the root cause process.
Once you get to the root causes, you will want to evaluate the best way to fix them so that the problem won’t happen again and your current condition will be improved. For this reason, specific recommendations should be the output of this step.
Table 3.33 • Root Cause Techniques
| 1 | Five “Whys” for Root Cause | Ask “Why” five times to get to root cause. |
| 2 | Track and Trace | Identify location of the problem by tracking data through the Information Life Cycle and determining root causes where the problem first appears. |
| 3 | Cause-and-Effect/Fishbone Diagram | Identify, explore, and graphically display all possible causes of an issue by using a standard quality technique. |
Step 5.1 Five “Whys” for Root Cause
Business Benefit and Context
The five “Whys” is a technique often used to get to root causes in manufacturing. It can also be applied to information quality and can be used by an individual, group, or team. This technique is also used in Step 4.3—Five “Whys” for Business Impact.
![]() Definition
Definition
The Five “Whys” for Root Cause ask “Why” five times to get to root cause.
Approach
1. State the issue associated with poor data quality.
Gather any pertinent background information. The more clearly you state the issue, the more easily you can find the root causes.
2. Ask “Why” five times.
Start with the stated issue and ask, “Why did we get this result?” or “Why did this situation occur?” From that answer repeat the question again five times. (See the example in the Sample Output and Templates section.)
3. Analyze the results.
Are there multiple root causes? Are there common features found among the root causes?
4. Make specific recommendations to address the root causes.
Develop specific actions to address the root causes found. If you need to prioritize a number of recommendations, use the prioritization technique in Step 4.4—Benefit versus Cost Matrix.
5. Document the results.
Include the root causes, the recommendations for addressing them, and how conclusions were reached. Also include any additional impacts to the business, tangible and intangible, that were uncovered or verified while going through this process.
Sample Output and Templates
Example 1
The issue—There is a concern about duplicate customer master records. (Note: You may or may not have done an assessment to determine the actual percentage of duplicates.)
Ask: Why are there duplicate records?
- Answer: Customer service reps create new master records instead of using existing ones.
Ask: Why do they create new records instead of using existing records?
- Answer: The reps don’t want to search for existing records.
Ask: Why don’t the reps want to search for existing records?
- Answer: It takes too long to enter the search request and get results back.
Ask: Why is the search time too long?
- Answer: The reps have not been trained in the proper search techniques and system performance is poor.
Ask: Why is the long search time a problem?
- Answer: The reps are measured by how quickly they create the records and complete the transaction. Data quality is not rewarded, and the reps have no visibility or understanding of why duplicate records are a problem to other parts of the business.
You may find more than one root cause and need to continue questioning along each of the branches. Decide which ones can be addressed, considering the results of the five whys, and which require further investigation before a solution can be implemented. In this example, you may have enough information to put together a short training course on search techniques for the reps. However, further investigation is needed to understand any system performance problems.
If needed, use the techniques in Steps 5.2 and 5.3 to explore more detail on root cause analysis.
Step 5.2 Track and Trace
Business Benefit and Context
This technique identifies the specific location of a problem by tracking the data through the Information Life Cycle and identifying where it first appears. Once you have identified the location you can use the other techniques to get to the root causes.
![]() Definition
Definition
Track and trace is a way to identify the location of the problem by tracking data through the Information Life Cycle and determining root causes where the problem first appears.
Approach
1. State the issue associated with poor data quality.
Gather any pertinent background information. The more clearly you state the issue, the more easily you can find the root causes.
2. Agree on the Information Life Cycle and the route for tracing the information.
Remember to use the work already done with the life cycle as a starting point. You will probably go to an additional level of detail in order to trace information for your root cause analysis.
3. Compare the data at the entry and exit points for each step through the process.
Do a careful job of capturing and comparing the data. (See the Data Capture section in Chapter 5.) One technique is profiling the data at the entry and exit points and comparing the results. You will eventually find the place where the data are correct when entering a process step but incorrect when exiting it.
4. Determine what needs to be changed to ensure that the data will be correct.
Analyze activities at the problem location. Identify the activities impacting the data between the point of entry (where correct) and the point of exit (where incorrect). Apply the other root cause techniques as needed.
You may decide to use the Five “Whys” for Root Cause or the Cause-and-Effect/Fishbone diagram here.
5. Make specific recommendations to address the root causes.
Develop specific actions to address the root causes found. If you need to prioritize a number of recommendations, use the prioritization technique in Step 4.4—Benefit versus Cost Matrix.
6. Document the results.
Include the root causes, the recommendations for addressing them, and how conclusions were reached. Also include any additional impacts to the business, tangible and intangible, that were uncovered or verified while going through this process.
Step 5.3 Cause-and-Effect/Fishbone Diagram
Business Benefit and Context
The Cause-and-Effect diagram comes from Kaoru Ishikawa, a Japanese quality control statistician and highly regarded quality management expert. Also known as the Ishikawa diagram, or Fishbone diagram,11 the technique is used to identify, explore, and arrange the causes of an event, problem, condition, or outcome in which the relationships between causes are illustrated according to their level of importance or detail. The approach is well known and effective and has been used in manufacturing. It can be applied to information as well.
You may want to use it once you have isolated the specific location of the problem through Track and Trace. The Cause-and-Effect diagram considers more than the most obvious causes and takes advantage of the knowledge of the group.
![]() Definition
Definition
A Cause-and-Effect/Fishbone Diagram identifies, explores, and graphically displays all possible causes of an issue by using a standard quality technique.
Approach
1. Create your team and prepare for the meeting.
Gather any information pertinent to the issue (most of it output from previous steps). Provide any needed background prior to the meeting so the team comes to it supporting the goals and are prepared to participate. Ensure that the physical setup of the meeting space is conducive to discussion and encourages collaboration.
2. State the issue associated with the poor data quality.
Explain the purpose of the meeting. The more clearly you state the issue, the more easily you can find the root causes. Allow time for discussion so everyone agrees on the issue to be analyzed. State the defect/issue/problem. This is indicated as the “effect,” which appears as the head of the fishbone.
Start drawing the diagram by writing the effect in a box on the right side of the diagram. Use a whiteboard or a large sheet of paper that everyone can see.
3. List categories of the problem.
You may start with categories of common causes and place them on the diagram. Table 3.34 lists categories you can use (see page 206). You can also include possible causes found throughout your project.
Alternatively, you may take a brainstorming approach and have attendees list all possible causes on sticky notes. Include the possible causes you have documented throughout the project and then categorize the causes and place them together on the diagram.
Draw a horizontal line to the left of the stated effect (the head). (See Figure 3.18 on page 206.) Then draw bones off the line and label them with the major categories. Use the categories that fit the problem—there is no perfect set or number. You may have to prioritize with which of the major categories to continue your questioning.
4. Continue questioning until you get to the root causes.
For each of the categories ask, “What is affecting or causing the problem? Why does this happen?” For example, “What people/organizational issues are causing the problem and why do the problems happen?” List these as smaller bones off the major bones. Reference the root causes you collected throughout your assessment.
5. State the root causes found.
Document and agree on the root causes found.
6. Make specific recommendations to address the root causes.
Develop specific actions to address the root causes found. If you need to prioritize a number of recommendations, use the prioritization technique in Step 4.4—Benefit versus Cost Matrix.
When analyzing causes, also consider the distinction between chronic and acute problems. Chronic problems have been around for a long time and have been ignored. Acute problems have come up recently and are putting new pressures on the system or the business.12
7. Document the results.
Include the root causes, the recommendations for addressing them, and how conclusions were reached. Also include any additional impacts to the business, tangible and intangible, that were uncovered or verified while going through this process.
![]() Best Practice
Best Practice
When determining the cause of the problem, David Loshin suggests looking for
- Chronic problems—those that have been around for a long time and ignored
- Acute problems—those that have cropped up recently and are putting new pressures on the system
Sample Output and Templates
Table 3.34 lists common categories of root causes. There is no perfect set or number of categories—use the categories that fit the issue.
Step 5 Summary
Discovering root causes is one of the most important milestones in your project—a main goal for all of your previous work. Now you can make informed decisions about your next steps—business action and communication needed—and see how discovery of root causes affects project goals, scope, timeline, and resources needed.
After your root cause analysis, you may need to spend more time conducting tests to verify potential root causes, or you may be confident enough that you can institute changes based on what you discovered. In either case, your recommendations should flow naturally to developing improvement plans. In some cases you may go directly to implementing controls. You decide.
Of course, remember to document results and recommendations. Review the questions in the checkpoint box to help you determine if you are finished or ready to move to the next step.
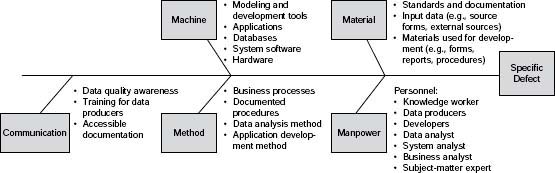
Table 3.34 • Common Categories of Root Causes
| The 4 M’s—often used in production processes* |
|
| The 4 P’s—often used in production processes* |
|
| Production and service processes often also use* |
|
| From the Framework for Information Quality (discussed in Chapter 2) (These may be used as categories in your root cause analysis.) |
|
*Reprinted with permission of GOAL/QPC, Salem NH 03079; www.memoryjogger.com.
![]() Best Practice
Best Practice
An often overlooked root cause—architecture and constraints. A good data model combined with constraints at every level of the execution of it—database design, application interaction, and accessibility—will help produce quality, reusable data, and prevent many postproduction data quality problems (e.g., redundancy, conflicting data definitions, and difficulty in sharing data across applications). An optimum architecture and constraint design puts the appropriate constraints at the correct levels of the data and application architecture. Rules about validation and constraints should be considered and implemented across the enterprise, whether for applications developed in house or for those purchased from vendors.
- Constraints at the database level must be general enough for all uses of the data by all applications, but only the DBA should be able to override them.
- At the application layer, nuances of usage may be enforced.
- Some accessibility rules may be enforced in the middle layer(s).
![]() Communicate
Communicate
![]() Have you communicated the root causes and preliminary recommendations from this step?
Have you communicated the root causes and preliminary recommendations from this step?
![]() Are you including project sponsors and stakeholders with appropriate updates throughout the project?
Are you including project sponsors and stakeholders with appropriate updates throughout the project?
![]() Are you starting to include management of other teams who could be called upon in the future to help implement recommendations? Don’t wait too long to let them know what is happening.
Are you starting to include management of other teams who could be called upon in the future to help implement recommendations? Don’t wait too long to let them know what is happening.
![]() Checkpoint
Checkpoint
Step 5—ldentify Root Causes
How can l tell whether I’m ready to move to the next step? Following are guidelines to determine completeness of the step:
![]() Have the root causes of the data quality issues been identified and documented?
Have the root causes of the data quality issues been identified and documented?
![]() Have specific recommendations for addressing those root causes been determined and documented?
Have specific recommendations for addressing those root causes been determined and documented?
![]() Has any additional learning about impact to the business been documented?
Has any additional learning about impact to the business been documented?
![]() If applicable, have specific recommendations and next steps based on business impact results been determined and documented?
If applicable, have specific recommendations and next steps based on business impact results been determined and documented?
![]() Has the communication plan been updated?
Has the communication plan been updated?
![]() Has necessary communication been completed?
Has necessary communication been completed?
Step 6 Develop Improvement Plans

Business Benefit and Context
Specific recommendations for improvement may have already been determined during Step 5—Identify Root Causes. Or you may be developing both specific recommendations and improvement plans in this step. (See Table 3.35.)
This is a critical point in the project where communication is key to ensuring that final recommendations are implemented. Because ownership of implementation often lies with groups outside the project team who completed the assessments this step may entail (1) developing improvement plans that can be implemented by the existing project team, (2) developing specific recommendations or high-level improvement plans that can only be implemented by others, and (3) increased communication activity. Plans and recommendations may be both short-term and one-time activities, or may require a new project for implementation.
Communication is an important part of this step to share results of the assessments and to obtain buy-in from those who can see that the recommendations are implemented. Do not underestimate the effort to prepare and communicate project results.
Approach
1. Gather results from each of the assessments and root cause activities.
If you have been documenting results and lessons learned throughout the project, then gathering results will be quite easy. If you have not been documenting results along the way, then you may want to look at the Analyze and Document Results section in Chapter 5 for suggestions. Go back to any documentation from each of the prior steps and compile it.
Table 3.35 • Step 6—Develop Improvement Plans
| OBJECTIVE | Develop an action plan based on the recommendations from the data quality and/or business impact assessment results and from root cause analysis. |
| PURPOSE | Ensure that the data quality assessment and business impact results and recommendations are turned into action plans. |
| INPUTS | For data quality assessments:
For business impact assessments:
|
| TOOLS AND TECHNIQUES |
|
| OUTPUTS |
|
| CHECKPOINT |
|
2. Develop and prioritize specific recommendations to address the issues found.
You may have done this as part of a root cause analysis. If not, do it now by synthesizing results from it and from each assessment; expect several recommendations. Every improvement doesn’t need to be a full project to be implemented. Look for quick wins and short-term activities that will provide benefits.
Look for similarities across the recommendations. (For example, are they related to the same business processes?) You may want to group them before prioritization. Prioritize the recommendations using an approach such as a cost–benefit matrix. See Step 4.4—Benefit versus Cost Matrix for more detail about this technique.
Ensure that improvement plans include prevention, correction, and communication. A conscious effort to raise awareness and “sell” the plans will need to be made to turn recommendations into action.
![]() Key Concept
Key Concept
Expect to see both improvement activities that do not require a project and plans for additional projects or small-scale pilots to implement changes.
3. Identify accountability and develop plans.
Identify the personnel and organizations most likely to be accountable for implementing the recommendations. For recommendations that can be implemented
By the existing project team—With the team, develop improvement plans using the project management skills you have learned working as a group.
By those outside the project team—Develop communication to share results of the project and your recommendations. Ideally those you suspect will be impacted will have been kept informed throughout the project and the fact that they are being asked to help implement recommendations will come as no surprise. The more involved people are throughout the project, the less likely they will be to reject efforts to include them in solving the problems found.
What I call a “magic moment” occurred during one of the final team meetings to prioritize specific recommendations from a data quality project. As responsibility for the recommendations were being assigned, the data management team leader agreed that Data Management should institute some of them. But she lamented that there was no money to spare for recommendation implementation.
The marketing manager was also in attendance. Because she had been appropriately involved and informed throughout the project, she was aware of the recommendations’ value to company (and her) marketing goals. She asked, “How much will it cost for your team to institute these recommendations?” The data manager replied with an estimate. The marketing manager laughed, “I waste more money than that in one marketing campaign. I’ll pay for those changes!”
As you can see from this true story, it is well worth the effort required to communicate and ensure that the right people are involved throughout the project.
Don’t try to fix everything at once, but be sure the plans you put in place will address the root cause. Don’t let the solutions miss the root cause because of preconceived notions about them.
4. Document and communicate results.
See suggestions in the Communicate box in this step’s summary.
![]() Best Practice
Best Practice
Sustaining information and data quality requires management support. Make sure your plans include the appropriate communication to ensure that support.
Sample Output and Templates
Template 3.11, Recommendations for Action, can be used to capture specific recommendations for action that you have developed from compiling and synthesizing all project results to this point. The recommendations and resulting improvement plans will vary. In the list that follows are a few examples of the range you may expect to find.
Template 3.11 • Recommendations for Action

Root cause analysis activities—One data quality accuracy project team was surprised to learn that 36 percent of their contacts could not be located (via telemarketing). A high-priority recommendation was to investigate the causes of this situation. Ideally, that investigation would have taken place earlier; but now was the time to obtain agreement to actually get to root causes using the techniques in Step 5—Identify Root Causes.
Small project team—In one project, the root cause of many data quality issues in the Customer Master Database was suspected to lie in data entry. The real root cause was found to be a variety of methods through which customer information was collected. Analysis showed that the same question was often asked in different ways with different answer choices. Or questions were unclear or presentation quality prevented customers from providing accurate information. In this case, the proposal was for a specific project that would (1) improve the clarity, content, and phrasing of questions so customers could understand how to answer each question; (2) standardize questions for consistency and effectiveness of data collection and use; and (3) obtain buy-in to change the various forms, websites, and so forth. This recommendation was ranked as having a high impact but being fairly low cost to implement. It could not be done in just a few days, but could probably be accomplished over several weeks with a small project team.
Data correction—While other prevention measures were under way, a clean-up campaign to address widespread data errors was needed. Since a clean-up would entail the purchase of data-cleansing tools for identifying duplicates, this improvement, while considered high impact, was also high cost.
Step 6 Summary
![]() Communicate
Communicate
![]() Are you getting buy-in for improvement plans?
Are you getting buy-in for improvement plans?
![]() Are you raising awareness among those who will be impacted by the improvements identified?
Are you raising awareness among those who will be impacted by the improvements identified?
![]() Have you updated your communication plan?
Have you updated your communication plan?
![]() Checkpoint
Checkpoint
Step 6—Develop Improvement Plans
How can l tell whether l’m ready to move to the next step? Following are guidelines to determine completeness of the step:
![]() Have the improvement plans been developed and documented?
Have the improvement plans been developed and documented?
![]() Have results of the project and recommendations been communicated?
Have results of the project and recommendations been communicated?
![]() Has support for the improvement plans and recommended action been obtained?
Has support for the improvement plans and recommended action been obtained?
![]() Has other necessary communication been completed?
Has other necessary communication been completed?
![]() Has the communication plan been updated?
Has the communication plan been updated?
Step 7 Prevent Future Data Errors

Business Benefit and Context
This is the step where you will start to see the fruits of your assessment labors. Preventing future data errors means that a business can install processes that produce quality data, instead of facing future data-cleansing activities (see Table 3.36). Improving information quality is an iterative endeavor, but preventing known errors can help build a foundation of quality from which to further improve information processes.
The natural tendency is to skip prevention and start immediately on correcting current errors—that is why prevention is Step 7 and correction is Step 8. Prevention reaps long-term benefits and increases trust in information quality. If a company is going to ignore prevention, it should do so consciously only after it has been able to justify cleansing the data without any effort to prevent those problems from recurring.
The Human Element
Improvement project participants will also be encouraged by success—and preventing future data errors is ongoing success. While not every error can be prevented, vastly improved information will raise morale throughout the business and raise expectations for the success of subsequent improvement projects.
Approach
1. Ensure that improvement activities or projects focus on root causes.
Review the causes discovered in Step 5—Identify Root Causes. This is particularly important if some time has passed between implementation and the original assessments and root cause analysis. Ensure that the improvement activities still apply to the current environment.
Table 3.36 • Step 7—Prevent Future Data Errors
| OBJECTIVE |
|
| PURPOSE |
|
| INPUTS | Output from Step 6—Develop Improvement Plan:
|
| TOOLS AND TECHNIQUES |
|
| OUTPUTS |
|
| CHECKPOINT |
|
2. Refer to the Framework for Information Quality (FIQ) for factors that impact information quality.
Table 3.37 provides additional ideas for preventing information quality problems based on the RRISCC section of the FIQ.
3. Identify which improvements need to be implemented.
Ask if there are urgent and important changes that need to be pursued and if there are projects that would yield long-term benefit. Expect many of the improvements to be related to processes. After all, data are products of business processes. Some improvements will take the form of “quick-win” activities that can easily be implemented; others will require more resource-intensive effort.
If the number of prevention improvements needed is overwhelming, quickly prioritize your options. Use the Benefit versus Cost Matrix (in Step 4.4—Benefit versus Cost Matrix) to determine where to focus your efforts first.
Following are examples of prevention activities and projects:
- Train customer service reps in data entry standards.13 Include awareness of the dependency that other parts of the business have on the quality of the data they collect, and awareness of the impact to the company if the quality is poor.
- Institute a governance process for developing and enforcing data standards. Include business impact to help sell the changes that will be required.
- Implement metrics for data quality that complement the business metrics for quick customer call turnaround—often the only metric that currently exists for customer service reps. Ensure that managers of the Support Center are aligned with the new metrics to be implemented.
- Ensure that data quality–related activities are included in the customer service reps’ job responsibilities and are part of their annual performance review.
- Work to increase trust in and thus usage of the Customer Master database by developing communication with its users. Include results of the initial baseline assessment, prevention activities currently under way, correction activities already completed, and business impact results that created the motivation for improvement. Engage executive management in the communication sessions with individual contributors.
Table 3.37 • RRISCC Questions for Prevention
| REQUIREMENTS | Do requirements need to be understood and documented? |
| RESPONSIBILITY | Does clear accountability, with appropriate motivation and rewards for ensuring information quality, need to be insitituted? |
| IMPROVEMENT AND PREVENTION | Do processes for monitoring data quality along with key metrics need to be implemented? |
| STRUCTURE AND MEANING | Do clear definitions, standards, business rules, and models need to be documented and made easily available? Do processes for keeping them updated need to be put into place? Does a data model need to be documented? |
| COMMUNICATION | Does training need to be updated or developed and delivered? Does an effective communication plan need to be developed and carried out? |
| CHANGE | Are there any organizational changes that need to be made to ensure data quality? Do any roles and responsibilities need to be updated or put into place? Is a standard change control process in effect? |
4. Finalize an implementation plan for each of the prevention improvements.
You can use the table approach to the Information Life Cycle (Chapter 5) to carefully plan and implement your improvements to ensure that harmful side effects do not result from the correction work. Reference the Framework for Information Quality to ensure that you have accounted for components that will affect your plan.
For example, make sure that you have accounted for the people/organizations that will be responsible for improvements. Look at the POSMAD Interaction Matrix Detail—Sample Questions in the Appendix or Figure 2.3 in Chapter 2 to help you plan effective improvements.
5. Ensure that improvements are assigned and implemented.
All the same principles for good project management addressed in Step 1—Determine Business Need and Approach apply here. You don’t need a project charter for each improvement activity, but you may need one for large-scale improvements.
6. Communicate results.
The same suggestions for communication outlined in Step 10—Communicate Actions and Results apply here.
Step 7 Summary
![]() Communicate
Communicate
![]() Have you obtained final buy-in for prevention plans to be implemented?
Have you obtained final buy-in for prevention plans to be implemented?
![]() Have personnel affected by the changes been trained?
Have personnel affected by the changes been trained?
![]() Do all those impacted (executives, management, project managers, individual contributors) have a consistent understanding of changes, expectations, new roles and responsibilities, new processes, and the like?
Do all those impacted (executives, management, project managers, individual contributors) have a consistent understanding of changes, expectations, new roles and responsibilities, new processes, and the like?
![]() Do they have an understanding of why these changes are being implemented?
Do they have an understanding of why these changes are being implemented?
![]() Are you addressing any resistance to the implementations?
Are you addressing any resistance to the implementations?
![]() Checkpoint
Checkpoint
Step 7—Prevent Future Data Errors
How can l tell whether l’m ready to move to the next step? Following are guidelines to determine completeness of the step:
![]() Have the solutions for addressing root causes and preventing future data errors been implemented?
Have the solutions for addressing root causes and preventing future data errors been implemented?
![]() Have changes to the current business from the new processes been documented?
Have changes to the current business from the new processes been documented?
![]() Have participants in the new processes received training?
Have participants in the new processes received training?
![]() Do all participants have a consistent understanding of changes, expectations, roles/responsibilities, and the like?
Do all participants have a consistent understanding of changes, expectations, roles/responsibilities, and the like?
![]() Have results from the changes been documented and communicated?
Have results from the changes been documented and communicated?
![]() Has other necessary communication been completed?
Has other necessary communication been completed?
![]() Has the communication plan been updated?
Has the communication plan been updated?
Step 8 Correct Current Data Errors
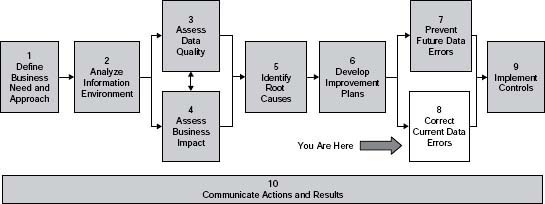
Business Benefit and Context
The correction of current data errors is an exciting milestone in the information and data quality improvement process (see Table 3.38). However, for continuous improvement it is important not only to correct current data errors, but also to prevent future ones. Larry English strongly recommends that data correction activity should be a “one-time event only, coupled with process improvement to prevent occurrence of those defects.”
What if data errors are stopping business processes? In this case they should immediately be corrected (as in the example in Step 5—Identify Root Causes where incorrect master data records were halting product shipments). Once the critical records are changed, add prevention to the improvement activities.
Approach
1. Identify the records to be changed and the specific changes needed.
Document instructions for identifying the records to be changed and the modifications expected. Train team members involved in identifying and changing the records.
2. Decide how to make the changes.
What is the best way to make the changes? Who will be involved? How long will it take? Are there other timing constraints that will affect the data correction efforts (for example, software updates to the application or needed resources that are unavailable)? Some solutions for updating:
Manual—Individuals use the standard application interfaces, screens, and keyboard.
Screen emulator—This automates the use of the standard application interfaces by replicating the keystrokes as if done manually; it is sometimes referred to as screen scraping. Data updated through this method should conform to all the internal data integrity rules of the application. Tools such as these still require human monitoring and may have poor error handling/correction.
Table 3.38 • Step 8—Correct Current Data Errors
| OBJECTIVE |
|
| PURPOSE |
|
| INPUTS |
|
| TOOLS AND TECHNIQUES |
|
| OUTPUTS |
|
| CHECKPOINT |
|
Mass update directly to the database—The caution regarding direct updates to the database is that they bypass any edits, validations, and triggers that are part of the application interface. This in itself can cause additional data quality problems and issues with the database’s referential integrity.
Data cleansing tool—Several data cleansing tools are available on the market that standardize and parse data and identify and merge duplicate records.
Custom interface programs—Sometimes the complexity and volume of changes require a custom interface program. Be wary of spending too much time on the correction piece and ensure that it will not come at the expense of preventing problems over the long term.
Following are criteria to help determine the appropriate update solution:
Volume—Lower volumes (less than 200 records) may be updated manually. Mid-level volumes (200–600) may use a screen emulator. Large volumes (more than 600) may require mass updates directly to the database or development of customized interface programs.
Complexity of changes—Consider the number of data elements being changed.
Time to make changes—The time needed to make changes manually will not be feasible.
Impact on system performance—Some changes will have more impact on system performance and should be scheduled during times of lower usage.
Dependencies—For example, changes to some supplier attributes could impact the product master.
Life of the solution—Balance the investment in the particular solution with how long you anticipate being able to use it.
3. Determine who will make the changes and when.
The method you choose to make the changes will drive the choice of who implements them. Take into account any dependencies from a time point of view—for example, avoid making data changes during the last few days of the quarter when you don’t want any potential impact on system performance to delay sales orders. Ensure downstream processes are prepared to accept the new data as corrected.
4. Make the changes.
Use the documentation to ensure consistency of changes—particularly if more than one person is making them. Use an analysis of data dependencies to make sure that the changes themselves don’t produce data quality problems, and stay alert—the changes may have affects on downstream processes that you did not predict.
![]() Best Practice
Best Practice
Correcting data is another phase of the Information Life Cycle. Use the table approach to the life cycle (see Chapter 5) to carefully plan and implement your changes so that harmful side effects are not created as a result of the correction work.
Consider changes to master data versus transactional data. For example, merging duplicate master records may not be possible until all associated open transactional records are closed. You may have to flag a duplicate record as not to be used before it can be merged or deleted—pending all associated transactional record closings. Take into consideration any other system dependencies or timing constraints.
5. Document the changes.
Describe the changes in structured documents so that future improvement teams can follow the data correction process. Structured documents mean an organized method of collecting, storing, and sharing the information such as through an enterprise knowledge management system or website. It does not mean storing documents on your hard drive, making them accessible only to you.
6. Communicate results.
The structured documents that describe the changes should be used to inform future technical teams; however, the results of data correction should be communicated to the data and information stakeholders as well. This kind of communication will emphasize the success of the data correction and describe how it will benefit the business in the future. Furthermore, all of the knowledge workers need to know how the changes will affect the data they receive.
Step 8 Summary
![]() Communicate
Communicate
![]() Is management aware of the resources needed to correct data errors?
Is management aware of the resources needed to correct data errors?
![]() Has management agreed to provide those resources?
Has management agreed to provide those resources?
![]() Are those making the changes aware of how and why these activities are happening?
Are those making the changes aware of how and why these activities are happening?
![]() Checkpoint
Checkpoint
Step 8—Correct Current Data Errors
How can I tell whether I’m ready to move to the next step? Following are guidelines to determine completeness of the step:
![]() Have the current data errors been corrected?
Have the current data errors been corrected?
![]() Have the results been documented and communicated?
Have the results been documented and communicated?
![]() Has other necessary communication been completed?
Has other necessary communication been completed?
![]() Has the communication plan been updated?
Has the communication plan been updated?
Step 9 Implement Controls
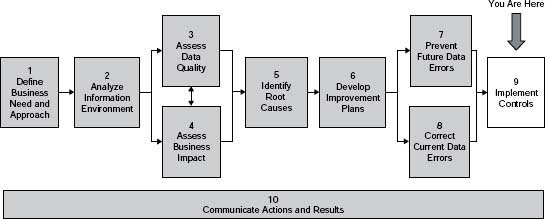
Business Benefit and Context
As Juran notes: “The control process is a feedback loop through which we measure actual performance, compare it with a standard, and act on the difference.”14 While this step is focused on implementing controls, understand that quality does not come from inspection and it is not a monitoring process. Rather, quality should be built into the information processes—hence the emphasis on earlier steps to identify root causes and implement improvements to prevent errors. The best prevention is to build in data quality controls (see Table 3.39) as new solutions are identified and deployed.
There will always be some type of assessment, inspection, and review. Businesses need visibility to what needs to be managed and therefore measured. Any controls should point to understanding the processes and determining if improvements made have led to the intended results.
![]() Key Concept
Key Concept
The best control is to prevent data quality problems in the first place.
Approach
1. Plan and implement controls.
Appropriate controls will vary widely depending on your issues, the scope of the project, and previous work done. Look at your specific improvement recommendations and the root causes discovered, and determine which data quality dimensions need to be assessed regularly.
Table 3.39 • Step 9—Implement Controls
| OBJECTIVE |
|
| PURPOSE |
|
| INPUTS |
|
| TOOLS AND TECHNIQUES |
|
| OUTPUTS |
|
| CHECKPOINT |
|
There are many methods for evaluating improvements to your data quality. Data are the output (artifacts) of your processes, and your controls should assess the dimension of quality that will reflect the improvements you put into place.
Use the data quality dimensions—Metrics should be indicators of process improvements and of the fact that other root causes have been addressed. (See the Metrics section in Chapter 5.) How you actually measure data quality will be the same as how you measure the applicable data quality dimensions—it is just done on a recurring basis. The processes and techniques for ongoing monitoring are contained in Step 3—Assess Data Quality.
If you have conducted an initial assessment, all the work done at that time can be evaluated when developing an ongoing process. Review your previous data quality assessments. Look at what worked in them. What did not work? What needs to change so that you can assess quality on an ongoing basis (versus a one-time–only basis)?
If you have not yet performed a quality assessment, go to Step 3—Assess Data Quality. Choose your dimensions, conduct your initial assessment to set the baseline data quality, and create a monitoring process. See the Metrics and RACI template (Template 3.12 on page 226). You can also use the table approach from the Information Life Cycle section in Chapter 5.
Statistical quality control—Statistical quality control (SQC), also referred to as statistical process control, was invented by Walter Shewhart in the 1920s and is an established practice in manufacturing. The purpose of SQC is to predict future process performance and to judge process stability by examining current and past performance.15
Survey knowledge workers—You may decide that periodic surveys are a good way to determine how knowledge workers and others feel about the quality and importance of the information. (See Step 3.10—Perception, Relevance, and Trust.)
Business impact—You may employ some of the business impact techniques in Step 4 to validate the value of the metrics to the business.
Include controls for reference data—Once domains of allowed values are specified and translated into edits where possible, monitor usage of the various values (to spot trends or misuse) and correct those records that fail.
Important: Use everything you have learned and the processes you have developed from your initial quality assessments to modify and implement processes for ongoing monitoring.
2. Obtain buy-in for what you are implementing.
Develop incentives for supporting the controls and for ensuring data quality. If your data quality is dependent on action from knowledge workers (such as taking the extra time to check that contact information is updated when support reps talk to customers on the phone), be sure that that responsibility is supported by their management and is a recognized part of their job description and performance evaluation.
3. Evaluate the improvements that have been implemented.
See if the expected results have occurred and determine next steps. If you (and, more important, those in the business and other stakeholders) are satisfied, and there are no negative side effects, then standardize the improvements. Ensure that the processes and controls become part of the standard operating procedure, including training, documentation, and job responsibilities. Document any final changes.
If there are any issues, such as satisfactory improvements with harmful side effects or unsatisfactory improvements (because of poor implementation or because the control itself was not a good idea), return to Step 6—Develop Improvement Plans, Step 7—Prevent Future Data Errors, or Step 9—Implement Controls to reassess your implementation plan or the improvement itself.
4. Communicate, communicate, and communicate some more!
Market the benefits through education and feedback. Celebrate and advertise success. Promote the value provided to the business and the team’s success with the project.
5. Identify the next potential area for data and information quality improvements.
Start again using The Ten Steps process and make use of work done in previous projects.
You may want to go back to the list of recommendations from Step 5—Identify Root Causes and Step 6—Develop Improvement Plans. Determine whether the recommendations still apply to the current environment, reprioritize, and implement more improvements.
Sample Output and Templates
The Metrics and RACI template (Template 3.12) combines the RACI technique (See Step 10—Communicate Actions and Results) with specific actions related to ongoing reporting and follow-up. This is a useful template for planning your metrics process.
In the template, “Accountable” indicates the overall owner of the specified activity. That person could also be answerable for all aspects of the metrics process. Names should be entered into the Accountable, Responsible, Consult, and Inform columns. It is possible that N/A (for Not Applicable) will appear in some places. Examples of timing are monthly or weekly—by Thursday 4 p.m. PST.
Step 9 Summary
![]() Communicate
Communicate
![]() Have you obtained buy-in at all levels for implementing controls?
Have you obtained buy-in at all levels for implementing controls?
![]() Have personnel affected by the changes been trained? Do you continue to have regular checkpoint meetings or status communication meetings with interested parties and supporters?
Have personnel affected by the changes been trained? Do you continue to have regular checkpoint meetings or status communication meetings with interested parties and supporters?
![]() Are you addressing any resistance to the continuous improvement you are encouraging?
Are you addressing any resistance to the continuous improvement you are encouraging?
![]() Are you marketing benefits and celebrating successes?
Are you marketing benefits and celebrating successes?
![]() Checkpoint
Checkpoint
Step 9—Implement Controls
How can I tell whether I’m ready to move to the next step? Following are guidelines to determine completeness of the step:
![]() Have the controls been implemented?
Have the controls been implemented?
![]() Have improvements been monitored and verified?
Have improvements been monitored and verified?
![]() Have all results (both positive and negative) been documented?
Have all results (both positive and negative) been documented?
![]() Have the successful improvements been standardized?
Have the successful improvements been standardized?
![]() Has necessary communication been completed?
Has necessary communication been completed?
![]() Has the communication plan been updated?
Has the communication plan been updated?
Template 3.12 • Metrics and RACI
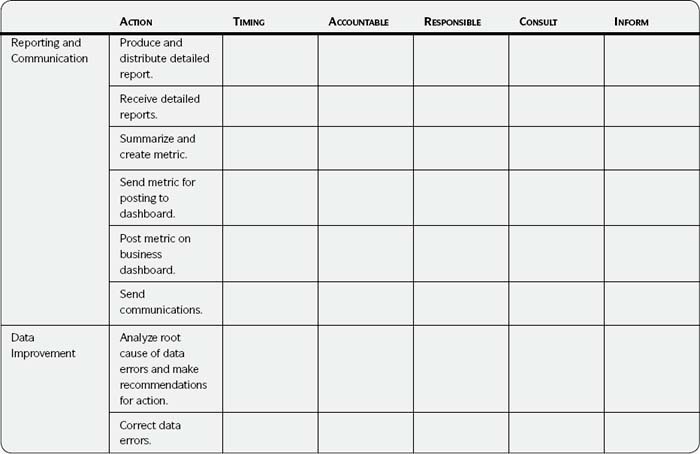
Step 10 Communicate Actions and Results
Business Benefit and Context
Communication is essential to the success of any information and data quality improvement project (see Table 3.40). For example, communicate with
- Sponsors of your data quality project, to keep them apprised of progress
- Stakeholders, to demonstrate the value of information and data quality improvement
- Process owners, to gain cooperation in data correction and data error prevention
- Knowledge workers (those dependent on the information to perform their jobs), to let them know how continuous improvement will affect how they use the data.
Refer to the Communicate boxes throughout The Ten Steps process for advice about communicating during each step.
Approach
1. Determine who needs to be included in your communication.
RACI is a management technique, originally used to identify roles and responsibilities in a change process, that can be applied to your communication efforts. (See Table 3.41.) It can be used at the beginning of your project to determine who needs to be involved and can also be used to determine who needs to receive communications.
![]() Communicate
Communicate
If you don’t communicate, your project will fall somewhere between failing miserably and receiving only limited reception to your results and recommendations. While communicating takes time and effort, failing to do so will ensure wasted time and effort. Ignoring communication won’t get you anywhere near success.
Table 3.40 • Step 10—Communicate Actions and Results
| OBJECTIVE |
|
| PURPOSE |
|
| INPUTS |
|
| TOOLS AND TECHNIQUES |
|
| OUTPUTS |
|
| CHECKPOINT |
|
Communication must be modified to fit various audiences and timing needs (i.e., when the communication should be received). For example, those who are in the Inform role (see Table 3.41) receive communication after work is completed and less frequently than those in the Responsible, Accountable, and Consult roles.
2. Create a communication plan.
Create your plan early in the project. (See Communication Plan, Template 3.13, in the Sample Output and Templates section on page 231.) Use it, refer to it, and update it throughout the project because it is helpful as a reference tool to remind you to communicate and to document completed communication efforts. Communication is two way so be sure to include venues and vehicles for obtaining feedback from your audiences, creating the opportunity for dialogue, and dealing with questions and concerns.
Table 3.41 • RACI
| RESPONSIBLE | Person who completes or implements the work. |
| ACCOUNTABLE | Person who must answer that the work was accomplished and has ultimate responsibility. May delegate some of the work (to someone who is “responsible”), but cannot delegate accountability. |
| CONSULT | Person who provides input to the work or decision. |
| INFORM | Person who is notifi ed of the work or decision. Does not need to be consulted. |
Note: A variation on RACI adds an S (RASCI) for Supportive. This person provides resources or plays some other supporting role. If you use Supportive, be sure to describe what that means for your project.
You may want to create the overall communication plan in a spreadsheet. Additional worksheets in the same file can be used to document the details of each communication needed.
3. Develop your communication material.
When creating your communication and determining the types needed, consider the time available. Table 3.42 offers suggestions. The columns show different times allowed for a communication, from 30 seconds to 3 hours. Shown for each are suggested purpose, focus, and so forth.
4. Continue appropriate communication throughout the project.
Continue to update and modify your communication plan throughout the project to ensure that communication is accomplished. Not much more can be said here except—do it!
5. Increase your skills related to communication.
Think of communication as the starting point for the various soft skills that come into play with any information or data quality project. After all, companies are “just a collection of people”16 so the human factor cannot be ignored if you expect to be successful. Resources abound to help you increase your skills in communication and related areas.
Coaches, mentors, books, classes, professional organizations, and websites can provide assistance in such areas as presentation skills, negotiating, facilitating, listening, writing, project management, internal consulting, change management, and networking. Even consider sales and marketing since you are selling information quality and marketing your project or program.
![]() Key Concept
Key Concept
Presentations do require audience analysis, and digging. But what you are really doing is applying your knowledge strategically, so that every bit of it relates directly to the self-interest of your audience.
– Ron Hoff17
Table 3.42 • 30-3-30-3 of Selling Data Quality
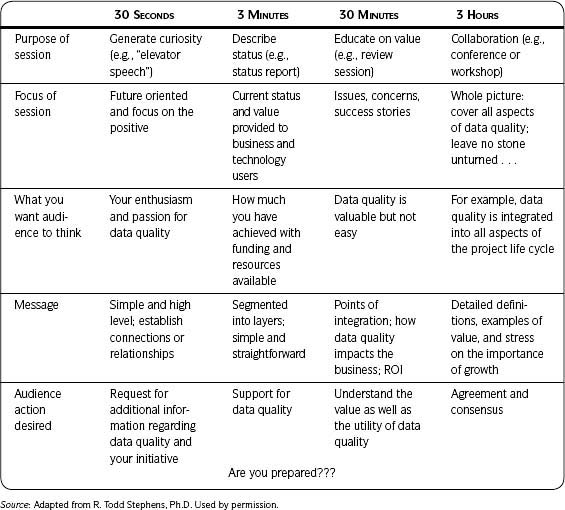
Sample Output and Templates
Use the Communication Plan template (Template 3.13) as a starting point for your communication plan.
Audience—Who needs to hear? Who will be affected? Consider organizations, teams, and individuals. Is there anyone specifically who should NOT receive the communication? Expect to have several audiences identified.
Message and desired action—What does the audience need to know? What is changing? How will the audience be impacted? What action do they need to take?
Trigger—What initiates the communication? Is it timing, an event (e.g., the first week in the quarter, a monthly management meeting, when a phase of a project is completed)?
Communication vehicle—What is the method of communication (e.g., in-person presentation, one-on-one meeting, Web seminar, email with attached files, website, newsletter article)?
Development—Who is responsible for developing and creating the communication? Who provides content and input?
Delivery—Who will present the communication (and when)?
Preparation action—What action needs to be taken to prepare for and complete the communication?
Target date—What is the planned date for the communication?
Complete date—What is the date when the communication will be completed?
Status—What is the status of the communication?
Template 3.13 • Communication Plan

Step 10 Summary
![]() Communicate
Communicate
![]() Have you communicated project progress?
Have you communicated project progress?
![]() Are you continuing contact with those who support the project?
Are you continuing contact with those who support the project?
![]() Are you addressing resistance to the project?
Are you addressing resistance to the project?
![]() Are you sharing project successes and improvements implemented?
Are you sharing project successes and improvements implemented?
![]() Checkpoint
Checkpoint
Step 10—Communicate Actions and Results
How can I tell whether I’m ready to move to the next step? Following are guidelines to determine completeness of the step:
![]() For each step in your project, were the project progress, results, and standardized improvements documented and appropriately communicated to the needed audiences?
For each step in your project, were the project progress, results, and standardized improvements documented and appropriately communicated to the needed audiences?
![]() At the end of your project, were the project results documented and appropriately communicated to the needed audiences?
At the end of your project, were the project results documented and appropriately communicated to the needed audiences?
![]() If additional activities and/or projects resulting from your project have been identified, have support and resources been committed?
If additional activities and/or projects resulting from your project have been identified, have support and resources been committed?
![]() Are you receiving the necessary support? If no, what additional communication is needed to obtain what is required?
Are you receiving the necessary support? If no, what additional communication is needed to obtain what is required?
The Ten Steps Process Summary
The Ten Steps process provides the activities, instructions, and techniques for putting the concepts of information quality into action. You have seen that you have to make good choices as to what is relevant, what is appropriate, and what is the most useful level of detail.
Go back and read the best practices and guidelines for applying the methodology that were presented at the end of Chapter 2. They will be more meaningful now that you are familiar with The Ten Steps process.
You have been given suggestions throughout The Ten Steps as to how the processes can be applied to different projects. This discussion continues in Chapter 4.
Concepts and Action—Making the Connection
Now that you know The Ten Steps process, let’s tie it into the Framework for Information Quality (FIQ). Tables 3.43 and 3.44 provide two ways of referencing and linking the concepts and the instructions, with one mapping the framework to The Ten Steps process and the other mapping The Ten Steps process to the framework.
In actuality any of the concepts may show up in any of The Ten Steps and vice versa, but the tables highlight specific connections between the two.
Use Table 3.43 if you are working in one of The Ten Steps and want to see the concepts used there. You can then use this to gather more information on those concepts. Use Table 3.44 if you are looking at the concepts and want to see how they are put into action.
Table 3.43 • Mapping The Ten Steps Process to the Framework
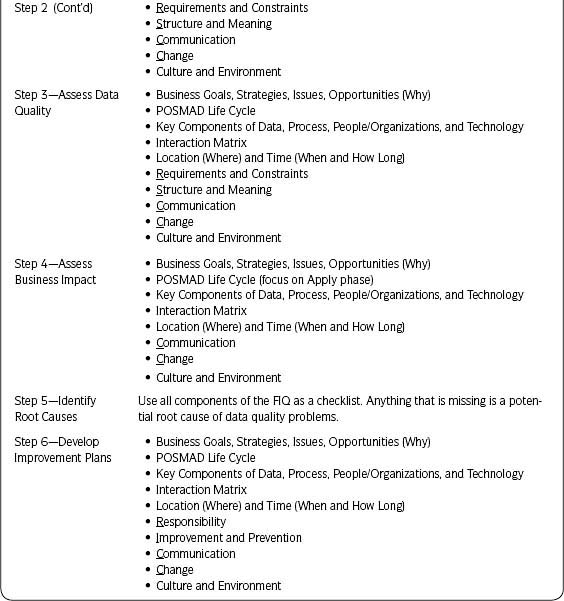
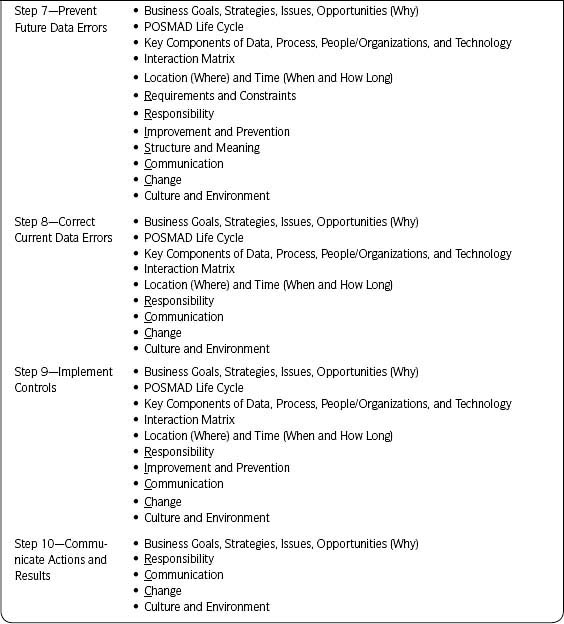
Table 3.44 • Mapping the Framework to The Ten Steps Process
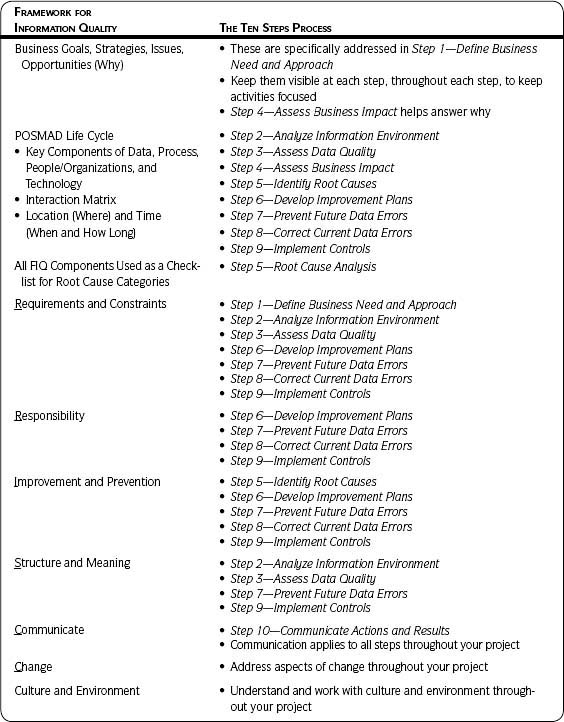
1From Combined Standards Glossary, Project Management Institute, Inc. (Third Edition, 2007). Copyright and all rights reserved. Material from this publication has been reproduced with the permission of PMI.
2Adapted from The Data Governance Institute, http://www.datagovernance.com.
3I use the word field to indicate an individual attribute, fact, column, or data element.
4I refer to profiling or analysis tools as profiling tools since that has become a fairly well-known and accepted term.
5Specific data-profiling capability, terms, and results vary depending on the particular profiling tool used.
6A column refers to a field, data element, or attribute.
7From Data Quality: The Field Guide (Digital Press, 2001), p. 227.
8If you want to explore the subject of storytelling further, Lori Silverman, in her book, Wake Me Up When the Data Is Over: How Organizations Use Storytelling to Drive Results (Jossey-Bass, 2006), shows how to increase the visibility and influence of stories and their practical application to a number of business disciplines. Resources listed in that book, along with her book Stories Trainers Tell (ASTD, Jossey-Bass/Pfeiffer, 2003), also include how to craft a story.
9Steven H. Spewak, Enterprise Architecture Planning: Developing a Blueprint for Data, Applications and Technology. Copyright © 1993 Steven H. Spewak, Ph.D. (pp. xix-xx). Reprinted with permission of John Wiley & Sons, Inc.
10Missing information refers to fields with blanks or nulls. Then, if the data exist, are they correct? Use the same ranking for both missing and incorrect data. Rank them separately only if they seem to differ significantly
11The term “fishbone” comes from the graphical nature of the output, with the stated problem being the head and the causes the bones of a fish.
12For additional questions to ask when tracking the source of chronic and acute problems, see David Loshin’s book Enterprise Knowledge Management: The Data Quality Approach (Morgan Kaufmann, 2001), pp. 389-391.
13I’m a big believer in the value of training in preventing data problems. I once worked with an individual who was responsible for a database that contained information about product sales collected from resellers. The information was used to give refunds based on certain incentives. Five years earlier she had been responsible for entering data into the database. Her comment: “If I had known then what I know now about how the data are used, I would have been a lot more careful!”
14From Joseph Juran, Juran’s Quality Control Handbook, Fourth Edition (McGraw-Hill, 1988) p. 24.2.
15Tom Redman, Data Quality for the Information Age (Artech House, 1996), pp. 155-183. Tom has written about applying SQC to information quality and has applied it in his own work.
16From Chip Conley, PEAK: How Great Companies Get Their Mojo from Maslow (Jossey-Bass, 2007).
17Reprinted from Ron Hoff, “I Can See You Naked”: A Fearless Guide to Making Great Presentations (Andrews and McMeel, 1992), p. 149. Copyright © 1992, 1988 by Ron Hoff. All rights reserved. Reproduced by permission of Browne & Miller Literary Associates, Chicago.