
Updated 6/22/08
Where the charting controls built into the Flex framework leave off is where component frameworks like the Elixir library from ILOG kick in. These frameworks provide additional 2D graphing components, like the Radar Chart and Tree Map (among others), but also provide 3D versions of some of the charts in the original Flex framework.
In this chapter, I'll demonstrate a few of these 3D charting components. To use these examples, you will need to install the data sources as well as the Elixir components. Instructions for installing all of these are in Chapter 2.
Before I begin, a word of warning about 3D. While three dimensions can look sexier than two dimensions, it's important to realize that the third dimension ideally should have some meaning or add some value to the presentation. In some of these examples, the third dimension clearly adds value, but in others, for example the pie chart, it's strictly for looks. It's up to you to make the judgment call for your application. But I recommend taking a little bit of time trying to work the 2D version before jumping into 3D, because you might not gain any additional data in the third dimension.
What most people consider a 3D chart is a 2D bar chart where the bars have an artificial depth that implies a third dimension. Elixir provides that functionality, as well as bars or lines that are stacked in three dimensions, as a 3D area chart.
An example use of the 3D area chart is shown in the application code that follows. This application uses the baseball data source and allows you to select a team. The doubles, triples, and home runs are then charted in the vertical axis against seasons in the horizontal axis. Adding the number of singles just blew the chart out.
<?xml version="1.0" encoding="utf-8"?>
<mx:Application xmlns:mx="http://www.adobe.com/2006/mxml"
  layout="absolute"
  creationComplete="baseballRO.getTeamList.send()"
  xmlns:ilog="http://www.ilog.com/2007/ilog/flex"
  xmlns:reflector="com.rictus.reflector.*"
  backgroundGradientColors="[#000000,#336666]">

<mx:Style>
.chartStyle {
  color: white;
}
</mx:Style>

<mx:Script>
<![CDATA[
import mx.charts.series.items.BubbleSeriesItem;importmx.graphics.SolidColor;importmx.charts.series.items.PlotSeriesItem;importmx.graphics.IFill;importmx.charts.ChartItem;importmx.charts.HitData;private functiononYearsResult() :void{ chart.dataProvider = baseballRO.getYearsByTeam.lastResult; }private functiononTeamsList() :void{ teamSelector.dataProvider = baseballRO.getTeamList.lastResult; teamSelector.selectedIndex = 0; }private functiononTeamChange() :void{if( teamSelector.selectedItem !=null&& teamSelector.selectedItem.teamid !=null) baseballRO.getYearsByTeam.send( teamSelector.selectedItem.teamid ); }private functionmakeDataTip( hd:HitData ):String {return "Hits <b>"+hd.item.h+"</b><br/>Doubles <b>"+hd.item['2b']+"</b>";}private varlastPt:Point =null;private functiononMouseDown( event:MouseEvent ) :void{ lastPt =newPoint( event.localX, event.localY ); }private functiononMouseUp( event:MouseEvent ) :void{ lastPt =null; }private functiononMouseMove( event:MouseEvent ) :void{if( lastPt ==null)return; chart.rotationAngle += ( event.localX - lastPt.x ) * 0.2; chart.elevationAngle += ( event.localY - lastPt.y ) * 0.2; lastPt =newPoint( event.localX, event.localY ); } ]]> </mx:Script> <mx:RemoteObject id="baseballRO" endpoint="http://localhost/amfphp/gateway.php" source="baseball.BaseballService" destination="baseball.BaseballService" showBusyCursor="true"> <mx:method name="getYearsByTeam" result="onYearsResult()">
<mx:arguments>
  <mx:Team />
</mx:arguments>
</mx:method>
<mx:method name="getTeamList" result="onTeamsList()" />
</mx:RemoteObject>

<ilog:AreaChart3D id="chart" type="overlaid" width="100%" height="70%"
  top="50"
  depthGap="10" dataTipFunction="makeDataTip" showDataTips="true"
  mouseDown="onMouseDown(event)" mouseUp="onMouseUp(event)"
  mouseMove="onMouseMove(event)"
  styleName="chartStyle">
<ilog:wallsFill>
  <mx:SolidColor color="0x666666" alpha="0.5"/>
</ilog:wallsFill>
 <ilog:horizontalAxis>
  <mx:CategoryAxis categoryField="yearid" />
</ilog:horizontalAxis>
<ilog:series>
  <ilog:AreaSeries3D xField="yearid" yField="2b"
  displayName="Doubles" />
  <ilog:AreaSeries3D xField="yearid" yField="hr"
  displayName="Homers" />
  <ilog:AreaSeries3D xField="yearid" yField="3b"
  displayName="Triples" />
</ilog:series>
</ilog:AreaChart3D>

<reflector:Reflector target="{chart}" alpha=".6"
  falloff=".3" blurAmount=".1"/>

<mx:Panel title="Teams" top="20" left="20" borderAlpha="0.4"
  backgroundAlpha="0.4">
<mx:ComboBox id="teamSelector" labelField="name"
  change="onTeamChange()" />
</mx:Panel>

</mx:Application>
The ActionScript code at the top of the application is split into two pieces. The onTeamChange, onTeamList, and onYearsResult are all related to getting the data from the server from the RemoteObject interface that is defined in the middle of the file. The application first requests the list of teams and uses that to populate the teamSelector combo box. It then makes the request to the server for the statistics for every season for the selected team when the user changes the team in the combo box. The onYearsResult is called when the statistics come back. Its job is to update the chart.
The makeDataTip method is used by the graph to present a data tip that is formatted correctly for the baseball data. The onMouseDown, onMouseUp, and onMouseMove methods allow the user to spin the graph by clicking it.
The interface itself is defined within a panel that tidies up the presentation. At the top of the panel is a combo box to select the team. Then within that is the AreaChart3D control from the Elixir framework. It contains a series array with three AreaSeries3D objects, one each for doubles, triples, and home runs.
When we bring this application up from Flex Builder 3 and select the Florida Marlins as the team, we see something like Figure 9-1.

We can click and drag on the graph to change the rotation in both the x and y axes.
Stepped area charts are pretty common, so I want to give you a few more options. Shown here is the same application, but in this case I'm using a "step" type format to show the individual seasons as bars:
<?xml version="1.0" encoding="utf-8"?>
<mx:Application xmlns:mx="http://www.adobe.com/2006/mxml"
  layout="absolute"
  creationComplete="baseballRO.getTeamList.send()"
  xmlns:ilog="http://www.ilog.com/2007/ilog/flex"
  xmlns:reflector="com.rictus.reflector.*"
  backgroundGradientColors="[#000000,#336666]">

<mx:Script>
<![CDATA[
...
]]>
</mx:Script>

<mx:RemoteObject id="baseballRO" ...>
...
</mx:RemoteObject>

<ilog:AreaChart3D id="chart" type="overlaid" width="100%"
  height="70%" top="50"
  depthGap="10" dataTipFunction="makeDataTip" showDataTips="true"
  mouseDown="onMouseDown(event)" mouseUp="onMouseUp(event)"
  mouseMove="onMouseMove(event)"
  styleName="chartStyle">
<ilog:wallsFill>
  <mx:SolidColor color="0x666666" alpha="0.5"/>
</ilog:wallsFill>
<ilog:horizontalAxis>
  <mx:CategoryAxis categoryField="yearid" />
</ilog:horizontalAxis>
<ilog:series>
  <ilog:AreaSeries3D xField="yearid" yField="2b"
  displayName="Doubles" form="step">
    <ilog:stroke>
      <mx:Stroke color="#ff0000" weight="2" />
    </ilog:stroke>
    <ilog:fill>
      <mx:SolidColor color="#ff3333" />
    </ilog:fill>
  </ilog:AreaSeries3D>
  <ilog:AreaSeries3D xField="yearid" yField="hr"
  displayName="Homers" form="step">
    <ilog:stroke>
      <mx:Stroke color="#00ff00" weight="2" />
</ilog:stroke>
<ilog:fill>
<mx:SolidColor color="#33ff33" />
</ilog:fill>
</ilog:AreaSeries3D>
<ilog:AreaSeries3D xField="yearid" yField="3b"
displayName="Triples" form="step">
<ilog:stroke>
<mx:Stroke color="#0000ff" weight="2" />
</ilog:stroke>
<ilog:fill>
<mx:SolidColor color="#3333ff" />
</ilog:fill>
</ilog:AreaSeries3D>
</ilog:series>
</ilog:AreaChart3D>
<reflector:Reflector target="{chart}" alpha=".6"
falloff=".3" blurAmount=".1"/>
<mx:Panel title="Teams" top="20" left="20" borderAlpha="0.4"
backgroundAlpha="0.4">
<mx:ComboBox id="teamSelector" labelField="name"
change="onTeamChange()" />
</mx:Panel>
</mx:Application>The only alteration in the code is the change in the series objects to use the "step" form and to specify the stroke and the color of each series. The result of these changes is shown in Figure 9-2.

Another very popular option is the stacked model of the area chart. This is where the individual series are "stacked" on top of each other. This allows the user to see the total amount in any given category, and then see the contribution of each series.
Following is the area chart application, updated one final time to show the stacked display:
<?xml version="1.0" encoding="utf-8"?>
<mx:Application xmlns:mx="http://www.adobe.com/2006/mxml"
  layout="absolute"
  creationComplete="baseballRO.getTeamList.send()"
  xmlns:ilog="http://www.ilog.com/2007/ilog/flex"
  xmlns:reflector="com.rictus.reflector.*"
  backgroundGradientColors="[#000000,#336666]">

<mx:Script>
<![CDATA[
...
]]>
</mx:Script>

<mx:RemoteObject ...>
...
</mx:RemoteObject>

<ilog:AreaChart3D id="chart" type="stacked" width="100%"
  height="70%" top="50"
  depthGap="10" dataTipFunction="makeDataTip" showDataTips="true"
  mouseDown="onMouseDown(event)" mouseUp="onMouseUp(event)"
  mouseMove="onMouseMove(event)"
  styleName="chartStyle">
<ilog:wallsFill>
  <mx:SolidColor color="0x666666" alpha="0.5"/>
</ilog:wallsFill>
<ilog:horizontalAxis>
  <mx:CategoryAxis categoryField="yearid"
  labelFunction="myLabelFunc" />
</ilog:horizontalAxis>
<ilog:series>
  <ilog:AreaSeries3D xField="yearid" yField="2b"
  displayName="Doubles" />
  <ilog:AreaSeries3D xField="yearid" yField="hr"
  displayName="Homers" />
  <ilog:AreaSeries3D xField="yearid" yField="3b"
  displayName="Triples" />
</ilog:series>
</ilog:AreaChart3D>

<reflector:Reflector target="{chart}" alpha=".6"
  falloff=".3" blurAmount=".1"/>

<mx:Panel title="Teams" top="20" left="20" borderAlpha="0.4"
  backgroundAlpha="0.4">
<mx:ComboBox id="teamSelector" labelField="name"
  change="onTeamChange()" />
</mx:Panel>

</mx:Application>
I've removed the adjustments to each of the AreaSeries3D objects and added a type attribute to the AreaChart3D object that is set to stacked. You can see the result in Figure 9-3.
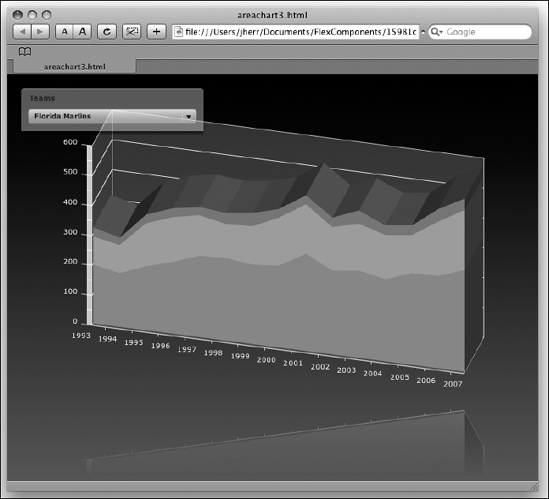
In my own opinion, I think this is the best choice for this particular visualization. You can see the relative strength of the season along the ridge line. And then get a feel for the remarkably consistent contributions of the consistent parts by looking at the individual colors.
Another alternative is the bar chart, which lays the bars out horizontally instead of vertically. The following application shows how a BarChart3D control can be applied to the baseball statistics example:
<?xml version="1.0" encoding="utf-8"?>
<mx:Application xmlns:mx="http://www.adobe.com/2006/mxml"
  layout="absolute"
  creationComplete="baseballRO.getTeamList.send()"
  xmlns:ilog="http://www.ilog.com/2007/ilog/flex"
  horizontalScrollPolicy="off" verticalScrollPolicy="off">
<mx:Script> <![CDATA[importmx.charts.series.items.BubbleSeriesItem;importmx.graphics.SolidColor;importmx.charts.series.items.PlotSeriesItem;importmx.graphics.IFill;importmx.charts.ChartItem;importmx.charts.HitData;private functiononYearsResult() :void{ chart.dataProvider = baseballRO.getYearsByTeam.lastResult; }private functiononTeamsList() :void{ teamSelector.dataProvider = baseballRO.getTeamList.lastResult; teamSelector.selectedIndex = 0; }private functiononTeamChange() :void{if( teamSelector.selectedItem !=null&& teamSelector.selectedItem.teamid != null ) baseballRO.getYearsByTeam.send( teamSelector.selectedItem.teamid ); }private functionmakeDataTip( hd:HitData ):String {return "Hits <b>"+hd.item.h+"</b><br/>Doubles <b>"+hd.item['2b']+"</b>"; }private varlastPt:Point =null;private functiononMouseDown( event:MouseEvent ) :void{ lastPt =newPoint( event.localX, event.localY ); }private functiononMouseUp( event:MouseEvent ) :void{ lastPt =null; }private functiononMouseMove( event:MouseEvent ) :void{if( lastPt ==null)return; chart.rotationAngle += ( event.localX - lastPt.x ) * 0.2; chart.elevationAngle += ( event.localY - lastPt.y ); lastPt =newPoint( event.localX, event.localY ); } ]]> </mx:Script> <mx:RemoteObject id="baseballRO" endpoint="http://localhost/amfphp/gateway.php" source="baseball.BaseballService"
destination="baseball.BaseballService"
  showBusyCursor="true">
<mx:method name="getYearsByTeam" result="onYearsResult()">
<mx:arguments>
  <mx:Team />
</mx:arguments>
</mx:method>
<mx:method name="getTeamList" result="onTeamsList()" />
</mx:RemoteObject>

<mx:Image width="1000" source="@Embed('background.jpg')">
  <mx:filters>
    <mx:BlurFilter blurX="4" blurY="4" />
  </mx:filters>
</mx:Image>

<mx:VBox paddingBottom="10" paddingLeft="10" paddingRight="19"
  paddingTop="10" verticalGap="10" width="85%" height="85%"
  top="50" left="50" borderThickness="4" borderColor="#dddddd"
  backgroundColor="white" backgroundAlpha="0.7"
  cornerRadius="15" borderStyle="solid"
  mouseDown="onMouseDown(event)" mouseUp="onMouseUp(event)"
  mouseMove="onMouseMove(event)">
<mx:ComboBox id="teamSelector" labelField="name"
  change="onTeamChange()" />
<ilog:BarChart3D id="chart" type="overlaid" width="100%" height="100%"
  depthGap="10" dataTipFunction="makeDataTip" showDataTips="true">
<ilog:wallsFill>
  <mx:SolidColor color="0x226666" alpha="0.5"/>
</ilog:wallsFill>
<ilog:verticalAxis>
  <mx:CategoryAxis categoryField="yearid" />
</ilog:verticalAxis>
<ilog:series>
  <ilog:BarSeries3D yField="yearid" xField="2b" displayName="Doubles"/>
  <ilog:BarSeries3D yField="yearid" xField="hr" displayName="Homers"/>
  <ilog:BarSeries3D yField="yearid" xField="3b" displayName="Triples"/>
</ilog:series>
</ilog:BarChart3D>
<mx:Legend dataProvider="{chart}" direction="horizontal" />
</mx:VBox>

</mx:Application>
Most of the code here remains the same as with the previous area chart examples. The difference is that the AreaChart3D control has been replaced by a BarChart3D control, and the series objects have been changed to BarSeries3D objects.
The result can be seen in Figure 9-4.
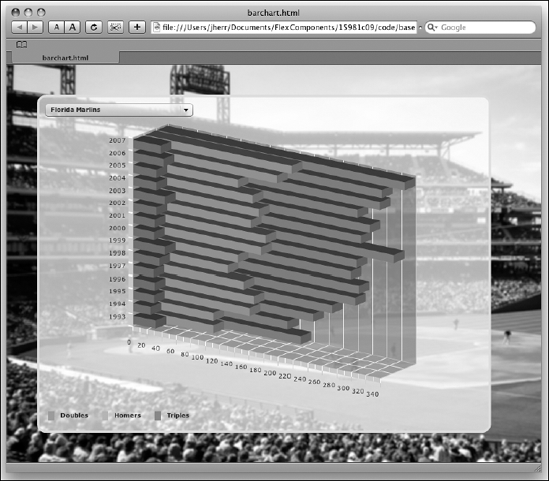
As with the AreaChart3D control, you can change the format of the chart as well as the individual series objects.
To illustrate 3D pie charts, I'm going to change the example application to use a more interesting rendering technique. We will still pick a baseball team, but in this case the application will render a list where each cell is a season and contains its own pie chart and bar chart.
This starts by creating the host application code, shown here:
<?xml version="1.0" encoding="utf-8"?>
<mx:Application xmlns:mx="http://www.adobe.com/2006/mxml"
  layout="vertical"
  creationComplete="baseballRO.getTeamList.send()"
  backgroundGradientColors="[#000000,#339933]">
<mx:Script> <![CDATA[private functiononYearsResult() :void{ chartList.dataProvider = baseballRO.getYearsByTeam.lastResult; }private functiononTeamsList() :void{ teamSelector.dataProvider = baseballRO.getTeamList.lastResult; teamSelector.selectedIndex = 0;for each ( varteam:ObjectinbaseballRO.getTeamList.lastResult )if( team.teamid =='FLO') { teamSelector.selectedItem = team; onTeamChange(); } }private functiononTeamChange() :void{if( teamSelector.selectedItem !=null&& teamSelector.selectedItem.teamid !=null) baseballRO.getYearsByTeam.send( teamSelector.selectedItem.teamid ); } ]]> </mx:Script> <mx:RemoteObject id="baseballRO" endpoint="http://localhost/amfphp/gateway.php" source="baseball.BaseballService" destination="baseball.BaseballService" showBusyCursor="true"> <mx:method name="getYearsByTeam" result="onYearsResult()"> <mx:arguments> <mx:Team /> </mx:arguments> </mx:method> <mx:method name="getTeamList" result="onTeamsList()" /> </mx:RemoteObject> <mx:VBox paddingBottom="10" paddingLeft="10" paddingRight="10" paddingTop="10" verticalGap="5" width="100%" height="100%" backgroundAlpha="0.6" borderColor="white" borderThickness="3" borderStyle="solid" cornerRadius="15" backgroundColor="white"> <mx:ComboBox id="teamSelector" labelField="name" change="onTeamChange()" /> <mx:List id="chartList" itemRenderer="PieRenderer1" width="100%" height="100%" backgroundAlpha="0.1"> </mx:List> </mx:VBox> </mx:Application>
The application handles all of the work of selecting the team, getting the data from the server, and then updating the list control to show the individual years.
The majority of the work in this example application is done in the PieRenderer1 class, which is shown here:
<?xml version="1.0" encoding="utf-8"?> <mx:Canvas xmlns:mx="http://www.adobe.com/2006/mxml" width="100%" height="160" xmlns:ilog="http://www.ilog.com/2007/ilog/flex" xmlns="http://www.degrafa.com/2007" dataChange="onDataChange()" creationComplete="onDataChange()" verticalScrollPolicy="off" horizontalScrollPolicy="off" paddingBottom="0" paddingLeft="0" paddingRight="0" paddingTop="0"> <mx:Script> <![CDATA[importmx.graphics.SolidColor;importmx.graphics.IFill;importmx.charts.ChartItem;importmx.collections.ArrayCollection;importmx.controls.List;importmx.charts.HitData;private functiononDataChange() :void{if( pieChart ==null|| !initialized || data ==null)return; pieChart.dataProvider = [ { name:'Hits', hits:data.h }, { name:'Doubles', hits:data['2b'] }, { name:'Triples', hits:data['3b'] }, { name:'Homers', hits:data.hr } ];varlist:List = parent.parentasList; yearChart.dataProvider = list.dataProvider as ArrayCollection; }private functionwinFill( item:ChartItem, index:Number ) : IFill {return newSolidColor( 0x00FF00, ( item.item.yearid == data.yearid ) ? 1 : 0.2 ); }private functionlossFill( item:ChartItem, index:Number ) : IFill {return newSolidColor( 0xFF0000, ( item.item.yearid == data.yearid ) ? 1 : 0.2 ); } ]]> </mx:Script> <Surface> <fills> <LinearGradientFill id="backColor" angle="0"> <GradientStop color="#62ABCD" alpha="0.6"/>
<GradientStop color="#62ABCD" alpha="1"/>
</LinearGradientFill>
</fills>
<strokes>
  <SolidStroke id="whiteStroke" color="#FFF" weight="1" alpha=".15"/>
</strokes>
<GeometryGroup>
<RoundedRectangle cornerRadius="12" x="20" y="20" width="800"
  height="120" fill="{backColor}" stroke="{whiteStroke}" />
</GeometryGroup>
</Surface>

<ilog:PieChart3D id="pieChart" height="160" width="200"
  zoom="1.2" left="30">
<ilog:filters>
  <mx:DropShadowFilter distance="10" alpha="0.5" />
</ilog:filters>
<ilog:series>
  <ilog:PieSeries3D displayName="Hits" field="hits"
  nameField="name" explodeRadius="0.1" />
</ilog:series>
</ilog:PieChart3D>

<mx:ColumnChart id="yearChart" height="120" width="580"
  type="100%" left="230" top="18" >
<mx:horizontalAxis>
  <mx:CategoryAxis categoryField="yearid"  />
</mx:horizontalAxis>
<mx:series>
  <mx:ColumnSeries xField="yearid" yField="w" displayName="Wins"
  fillFunction="winFill" />
  <mx:ColumnSeries xField="yearid" yField="l" displayName="Losses"
  fillFunction="lossFill" />
</mx:series>
</mx:ColumnChart>

<mx:HBox paddingBottom="2" paddingTop="2" paddingLeft="5"
  paddingRight="5" backgroundColor="#62ABCD"
  backgroundAlpha="0.6" borderColor="#62ABCD" borderStyle="solid"
  borderThickness="2" top="40" left="5">
<mx:Label text="{data.yearid}" fontWeight="bold" fontSize="14" />
</mx:HBox>

</mx:Canvas>
PieRenderer1 is an MXML component that derives from a Canvas. Within that, there is a Degrafa surface to render the background as a blue rounded rectangle. Then there are absolutely positioned PieChart3D and ColumnChart controls. The PieChart3D control shows the relative contributions of doubles, triples, and home runs. The ColumnChart (provided by the Flex framework) displays this year in the context of all of the years, where all of the years except for the current year are shown in 20% alpha to deemphasize them.
The resulting application, when run from Flex Builder 3, is shown in Figure 9-5.

This application shows the power of using renderers within the standard data display controls like the List control. List elements don't have to have text—they can have any type of control, regardless of complexity, as you can see here.
While some people were mesmerized by the computational power of Mathematica, I was blown away by the graphics. Math can produce some striking graphics, particularly in three dimensions. Flash doesn't have 3D drawing built in, but its 2D drawing API is strong enough to make quick work of rendering 3D graphics.
I found a scientific charting package online that was architected as components and had example source code. The following application uses the 3D plotting component to render a user-entered equation in 3D space:
<?xml version="1.0" encoding="utf-8"?> <mx:Application xmlns:mx="http://www.adobe.com/2006/mxml" layout="vertical" creationComplete="onStartup()"> <mx:Script> <![CDATA[importbkde.as3.boards.GraphingBoard3D;importbkde.as3.parsers.MathParser;importbkde.as3.parsers.CompiledObject;importbkde.as3.utilities.MatrixUtils;importbkde.as3.utilities.StringUtils;importbkde.as3.parsers.RangeObject;importbkde.as3.parsers.RangeParser;private varboard:GraphingBoard3D;private functiononStartup() :void{ board =newGraphingBoard3D( Math.min( plotHost.width, plotHost.height ) ); plotHost.addChild( board ); runPlot(); }private functionisLegal(a:*):Boolean {return((typeofa)!="number"|| isNaN(a) || !isFinite(a)) ==false; }private functionprepGraph() : Boolean { board.resetBoard();if( funcText.text.length == 0 )return false;varprocFun:MathParser =newMathParser(["x","y"]);varcompObj:CompiledObject = procFun.doCompile(funcText.text);if( compObj.errorStatus == 1 ) { board.showError(compObj.errorMes);return false; }varxmin:Number = −1;varxmax:Number = 1;varzmin:Number = −1;varzmax:Number = 1;varfArray:Array = [];varyArray:Array = [];for(varj:int = 0; j<=board.nMesh;j++ ) { fArray[j] = [];varcurz:Number = zmin+j*(zmax-zmin)/board.nMesh;
for(vari:int = 0; i<=board.nMesh; i++){varcurx:Number = xmin+i*(xmax-xmin)/board.nMesh;varcury:Number = procFun.doEval( compObj.PolishArray,[curz,curx]); fArray[j][i] = [curx,cury,curz];if(isLegal(cury)) yArray.push(cury); } }varymin:Number = −1;varymax:Number = 1;if( yArray.length != 0 ) { yArray.sort(Array.NUMERIC); ymin = yArray[0]; ymax = yArray[yArray.length-1]; }if( ymax == ymin ) { ymax+=0.5; ymin+=-0.5; }varsize:Number = board.getCubeSize();varpArray:Array=[];for(j=0; j<=board.nMesh;j++) { pArray[j]=[];for(i=0; i<=board.nMesh;i++) { pArray[j][i]=[ toPixel(xmin,xmax,size,fArray[j][i][0]), toPixel(ymin,ymax,size,fArray[j][i][1]), toPixel(zmin,zmax,size,fArray[j][i][2]) ];if(isLegal( fArray[j][i][1]) && fArray[j][i][1]<=ymax && fArray[j][i][1]>=ymin){ pArray[j][i][3]=0; }elsepArray[j][i][3]=1; } } board.nOpacity = opacitySlider.value; board.setPixArray(pArray);return true; }private functiontoPixel(min:Number,max:Number, size:Number,fun:Number):Number {returnsize-(max-fun)*(2*size/(max-min)); }private functionrunPlot() :void{
board.width = Math.min( plotHost.width, plotHost.height ); board.height = Math.min( plotHost.width, plotHost.height ); board.setColorType("function"); board.enableAxesLabels();varVer:Array = MatrixUtils.MatrixByVector( MatrixUtils.rotMatrix(1,0,0,-15.2*Math.sqrt(2)),[0,1,0]);variniMatrix:Array = MatrixUtils.MatrixByMatrix( MatrixUtils.rotMatrix(Ver[0],Ver[1],Ver[2],15*Math.PI/2), MatrixUtils.rotMatrix(1,0,0,-15.2*Math.sqrt(2)));if( !prepGraph() )return; board.drawSurface(iniMatrix); board.drawAxes(iniMatrix); }private functiononResize() :void{if( initialized ==false)return; runPlot(); } ]]> </mx:Script> <mx:Panel width="100%" height="100%" title="Math Plotter" paddingBottom="5" paddingLeft="5" paddingRight="5" paddingTop="5"> <mx:HBox> <mx:TextInput id="funcText" text="x^2+sin(y*5)" /> <mx:Button label="Plot" click="runPlot()" /> <mx:HSlider id="opacitySlider" minimum="0" maximum="1" value="0.7" change="runPlot()" /> </mx:HBox> <mx:UIComponent id="plotHost" width="100%" height="100%" resize="onResize()" /> </mx:Panel> </mx:Application>
I won't pretend to understand all of the math here. Suffice it to say that the runPlot and prepGraph functions are the two primary methods involved in drawing the graph. These functions use the GraphingBoard3D control that comes with the library to draw an equation, which is interpreted by the MathParser object (also part of the library).
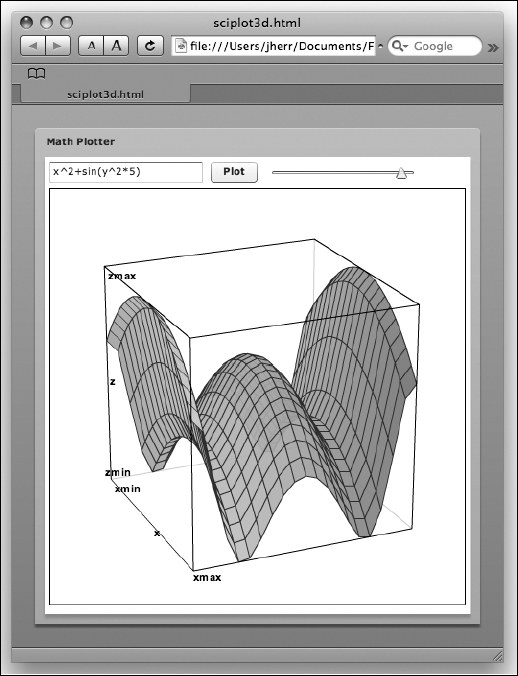
The opacity slider adjusts the opacity setting in the graph and replots to allow the user to create see-through graphs like the one shown in Figure 9-6.

If I up the opacity and type in another equation, I can get a more solid-looking graph that has a few more bumps in it—like the one shown in Figure 9-7.
With a little mouse handling code, you could have the graph spinning around on mouse control.
The nice thing about this particular library is that it comes as source code, so if you don't like the implementation, you can tweak it and send it back to the original authors.
I'd like to extend the view of components for at least this one example to include any set of tools that makes your life easier as an application developer. In this case, the tool I will include is Google's free SketchUp (http://sketchup.google.com) 3D modeling software. The problem I will solve in this example is the high CPU cost of 3D rendering.
Papervision3D is an excellent open source 3D rendering engine for Flex and Flash, no doubt. But it can be slow to render very elaborate models with lots of polygons and textures no matter how fast the machine.
Take as an example the Colonial Viper model, shown in Figure 9-8, that I downloaded from Google's 3D Warehouse (http://sketchup.google.com/3dwarehouse/).

This is a nontrivial model with a lot of polygons. The XML file to describe the model is big. And it takes a lot of time in Papervision3D to render the model with the nice shading you see here.
Now let's say that I want to allow the user to spin this model around as if she were in a car showroom and watching a car spin around on a plate on the floor. How can I do that with this complex of a model? Can I cheat? Well, yes I can.
I can script SketchUp to take a snapshot of the model at every 5 degrees for 360 degrees. Then I can flip those images like a deck of cards in response to someone dragging the mouse. The model will spin as quickly as it takes to flip an image, which is really quick. That means no matter how complex the model, it will always spin at the same rate in my application because all I'm doing is flipping pre-rendered frames (like in a movie).
SketchUp has a Ruby interpreter built in. This Ruby interpreter can be used to do all kinds of things: add components to the model, rotate the model, change the camera angle, save snapshots of the model to an image file, and so on. The following Ruby code will spin the selected model around 360 degrees by units of 5 degrees and take a snapshot after each spin:
# Install with:
# require_all( File.join( File.expand_path( "~" ), "Sketchup" ) )
require 'sketchup.rb'
class PanoBuilder3
def initialize
@distance = nil
@frame = 0
@angle = 0
end
def nextFrame(view)
v = Geom::Vector3d.new(0,0,1)
ss= Sketchup.active_model.selection
ss.each do |e|
pt = e.bounds.center
tr = Geom::Transformation.rotation(pt,v,5 * 0.0174532925)
Sketchup.active_model.active_entities.transform_entities(tr,e)
end
view.show_frame
fpath = File.join( File.expand_path( "~" ),
"Sketchup/images/#{@frame}.png" )
view.write_image( fpath, 300, 250, true )
@angle = @angle + 5
@frame = @frame + 1
@angle < 360
end
end
def buildpano3
Sketchup.active_model.active_view.animation = PanoBuilder3.new
end
if( not file_loaded?("panobuilder3.rb") )
UI.menu("Camera").add_item("Build Panorama 3") {buildpano3}
end
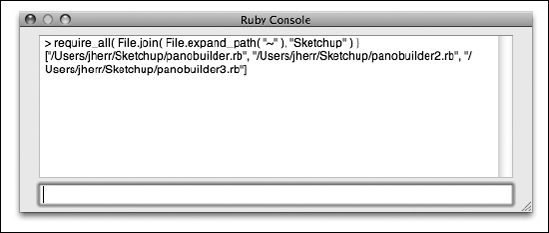
file_loaded("panobuilder3.rb")I install this panobuilder3.rb file in my home directory within a folder called Sketchup. I then bring up the Ruby console in SketchUp and run the install line that is in the comment at the top of the script. The result is shown in Figure 9-9.
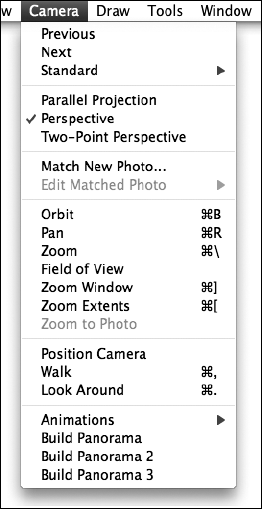
From there, I just select the model I want to spin and then select Build Panorama 3 from the Camera menu as you can see in Figure 9-10.
That will build a series of images in the Sketchup/images directory. From there, I copy the images directory into my Flex project and use the following application code to display the model and allow the user to rotate it using the mouse:
<?xml version="1.0" encoding="utf-8"?> <mx:Application xmlns:mx="http://www.adobe.com/2006/mxml" layout="vertical" creationComplete="onStartup()"> <mx:Script> <![CDATA[importmx.controls.Image; [Embed(source="images/0.png")]private varimg0:Class; [Embed(source="images/1.png")]private varimg1:Class; ... [Embed(source="images/70.png")]private varimg70:Class; [Embed(source="images/71.png")]private varimg71:Class;public varframes:Array = [newimg0(),newimg1(),newimg2(), ...newimg69(),newimg70(),newimg71()];private varframe:int = 0;private varlastX:int = 0;private vartracking:Boolean =false;private varlastImage:Image =null;private varimages:Array = [];private functiononStartup() :void{for each(varbm:Bitmapinframes ) {varimg:Image =newImage(); img.source = bm; img.visible =false; images.push( img ); pnl.addChild( img ); } onDegreeChange(); }private functiononMouseDown(event:MouseEvent ) :void{ lastX = event.localX; tracking =true; }private functiononMouseMove(event:MouseEvent) :void{if( tracking ) {if( event.localX < lastX ) frame--;elseframe++;if( frame >= frames.length ) frame = 0;if( frame < 0 ) frame = frames.length - 1; lastX = event.localX;
onDegreeChange(); } }private functiononMouseUp(event:MouseEvent) :void{ tracking =false; }private functiononDegreeChange() :void{if( lastImage !=null) lastImage.visible =false; images[ frame ].visible =true; lastImage = images[ frame ]; } ]]> </mx:Script> <mx:Panel title="Colonial Viper" paddingBottom="0" paddingLeft="0" paddingRight="0" paddingTop="0" mouseDown="onMouseDown(event)" mouseUp="onMouseUp(event)" mouseMove="onMouseMove(event)" backgroundColor="black"> <mx:Canvas id="pnl" width="300" height="250" /> </mx:Panel> </mx:Application>
There isn't much to this code. The onStartup method adds the individual images to the canvas and then sets visible on only one of them to true. The onMouseUp, onMouseDown, and onMouseMove messages respond to the mouse click and use the onDegreeChange method to change the active image to a different degree.
The finished application is shown in Figure 9-11.

The effect is actually quite striking. There is no way to tell that there is no genuine 3D rendering going on.
I tried various effects when building the Ruby code for this application. The first was to rotate the camera around the model. What I found was that you would see a "light side" and a "dark side" to the model because of the single light source in SketchUp. It felt as if I were walking around a car in a showroom.
In the end, I found that rotating the model itself and maintaining the position of the camera, as I do in this example, provides the best result. It's as if the model were on a plate and you were standing still and watching it rotate in front of you. Thus, the model is always well lit.
3D is great, but it can be overused. Some of the example graphs in this chapter work just as well in 2D as they do in 3D. If anything, the added dimension acts to distract from the data being presented. At the end of the day, I always recommend using the right visualization that imparts the information in the most comprehensible way possible.
That being said, I think we have all been in the situation when 2D just isn't sexy enough to get people's attention. When that's the case, it's nice to have a set of tools like the ones presented in this chapter that make 3D easy.