
Updated 7/8/08
Don't let the title of this chapter keep you from digging in; "network" doesn't always mean a computer network. In fact, a network graph is any set of interconnected nodes. For example, Facebook (http://facebook.com) is one big network graph. If I know you, and you know me, and we know another person, then our graph can be represented as three nodes with six connections (or edges) between the three nodes.
In this chapter, I present several controls that not only visualize network graphs, but also allow you to interact with the graphs in a dynamic way.
The SpringGraph component (http://mark-shepherd.com/blog/springgraph-flex-component/) makes it easy to build a set of nodes, create links between those nodes, and display them in a dynamic network graph. You can customize the display of the nodes using an itemRenderer.
Flickr makes for an interesting data source for node graphs because you have images connected to tags, which in turn connect to other tags with more images. For example, the tag "dog" might lead to images of someone walking their dog in a park, which is also tagged with "park" and has its own set of pictures.
A spring graph, like the one in this application, allows you to associate text nodes with image nodes and move them around interactively. You can then double-click the node to dig down even further.
In the following application code, we use the SpringGraph component to visualize all of the results from Flickr (http://flickr.com) to a particular query:
<?xml version="1.0" encoding="utf-8"?> <mx:Application xmlns:mx="http://www.adobe.com/2006/mxml" xmlns:fc="http://www.adobe.com/2006/fc" layout="absolute" creationComplete="onStartup()"> <mx:Script> <![CDATA[importcom.adobe.flex.extras.controls.springgraph.Graph;importcom.adobe.webapis.flickr.methodgroups.Photos;importcom.adobe.webapis.flickr.events.FlickrResultEvent;importcom.adobe.webapis.flickr.*;private varflickrSvc:FlickrService =newFlickrService("Your Flickr Key");private varitems:Graph =newGraph();private varrootItem:FlickrItemData;private varsearchText:String ='dog';public static varinstance:flickrspring =null;
public functionopenNode( item:FlickrItemData ) :void{if( item.photo !=null) { flickrSvc.photos.getInfo( item.photo.id ); }if( item.text !=null) { searchText = item.text; onSearch(); } }private functiononStartup() :void{ instance =this; flickrSvc.permission = AuthPerm.NONE; flickrSvc.addEventListener( FlickrResultEvent.PHOTOS_SEARCH, onPhotoSearchResult ); flickrSvc.addEventListener( FlickrResultEvent.PHOTOS_GET_INFO, onPhotoInfoResult ); rootItem =newFlickrItemData( searchText ); rootItem.text = searchText; items.add( rootItem ); s.dataProvider = items; onSearch(); }private functiononSearch() :void{ flickrSvc.photos.search("", searchText,"", "", null, null, null,null, License.ATTRIBUTION,"tags", 10 ); }private functiononPhotoInfoResult( event:FlickrResultEvent ) :void{for each(vart:PhotoTag in event.data.photo.tags ) {if( items.find( t.tag ) ==null) {varitem:FlickrItemData =newFlickrItemData( t.tag ); item.text = t.tag; items.add( item ); items.link( items.find( event.data.photo.id ), item ); } } }private functiononPhotoSearchResult( event:FlickrResultEvent ) :void{for each(varp:Photoinevent.data.photos.photos ) {varitem:FlickrItemData =newFlickrItemData( p.id ); item.photo = p; items.add( item ); items.link( items.find( searchText ), item ); } } ]]>
</mx:Script>
<fc:SpringGraph id="s" backgroundColor="#ffffff"
  lineColor="#333388CC" left="0" right="0" top="0" bottom="0"
  itemRenderer="FlickrItem" repulsionFactor="0.4" width="100%"
    height="100%">
</fc:SpringGraph>
</mx:Application>
The application uses the AS3 Flickr Library (http://as3flickrlib.googlecode.com) to run initial requests. The application also fields requests to open subnodes and make subqueries. In both cases, it creates new FlickrItemData nodes, which are defined by the AS3 class shown here:
package
{
  import com.adobe.flex.extras.controls.springgraph.Item;
  import com.adobe.webapis.flickr.*;

  public class FlickrItemData extends Item
  {
    public var photo:Photo = null;

    public var text:String = null;

    public function FlickrItemData(id:String=null)
    {
      super(id);
    }
  }
}
Associated with each of the nodes is a Flickr Photo object that comes from the AS3 Flickr Library. If there is no photo associated with the node, the text field must be nonnull.
The itemRenderer that displays these nodes is shown in the following code:
<?xml version="1.0" encoding="utf-8"?>
<mx:Canvas xmlns:mx="http://www.adobe.com/2006/mxml" width="75"
  height="75" dataChange="onDataChange()"
  creationComplete="onDataChange()" horizontalScrollPolicy="off"
  verticalScrollPolicy="off"
  doubleClickEnabled="true" doubleClick="onDblClick()">
<mx:Script>
<![CDATA[
import com.adobe.webapis.flickr.Photo;
private functiononDblClick() :void{ flickrspring.instance.openNode( dataasFlickrItemData ); }private functiononDataChange() :void{if( data ==null|| !initialized )return;if( data.photo !=null) {varp:Photo = data.photo as Photo; img.source ="http://static.flickr.com/"+p.server+"/"+p.id+"_"+p.secret+"_s.jpg"; textItem.visible =false; }if( data.text !=null) { img.visible =false;vartl:TextLineMetrics = textItem.measureText( data.text ); textItem.text = data.text; textItem.width = tl.width + 10; textItem.height = tl.height + 10; width = tl.width + 10; height = tl.height + 10; } } ]]> </mx:Script> <mx:Image id="img" width="75" height="75" /> <mx:Label id="textItem" fontSize="20" /> </mx:Canvas>
This MXML component takes a FlickrItemData object as data. If the photo field of the object is defined, it uses the image tag to display the photo. If the text is set, the textItem label is set and the box is resized to show the whole text.
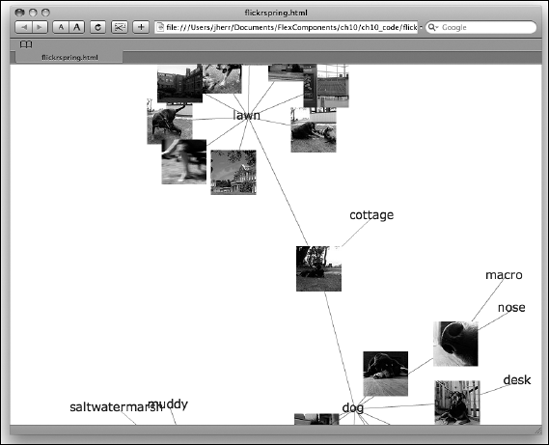
To get this application to work, you need a Flickr API key (which is free). Once you have it, you can run the application, and you should see something like Figure 13-1.

From here you can double-click one of the dog images to bring up the tags associated with that image. This is shown in Figure 13-2.
As you can see from Figure 13-3, the number of nodes with text and graphics can get fairly large.

As the node tree grows, the SpringGraph automatically adjusts to show the new data. If you don't like where it's going, you can just grab a node and move it around for yourself.
As you can see for yourself, the SpringGraph is a robust and easy-to-use node graph viewer.
The Flare library (http://flare.prefuse.org/) is the Flash version of the Prefuse library (http://prefuse.org/) that's used to display data structures like node graphs. Actually, it can do a whole bunch of things, of which displaying tree structures is just a part.
The Flare project is more about computer science than it is about front-end user-facing features. Where the SpringGraph project is about showing things like pictures or people as nodes, the Flare project is more about showing tree graphs in a more mathematical context.
The Flex application code that hosts the Flare graph is shown here:
<?xml version="1.0" encoding="utf-8"?> <mx:Application xmlns:mx="http://www.adobe.com/2006/mxml" layout="absolute" creationComplete="onStartup()"> <mx:Script> <![CDATA[importflex.FlexGraph;importmx.core.UIComponent;importflare.demos.*;private vargraph:FlexGraph =newFlexGraph();private functiononStartup() :void{varuic:UIComponent =newUIComponent(); addChild( uic ); uic.addChild( graph ); } ]]> </mx:Script> <mx:ApplicationControlBar dock="true"> <mx:Button label="Starburst" click="graph.starbust();" /> <mx:ButtonBar id="treeType" itemClick="graph.changeLayout(treeType.selectedIndex)" dataProvider="{['Force Directed','Node Link Tree', 'Indented Tree','Radial Tree','Circle']}" selectedIndex="0" /> </mx:ApplicationControlBar> </mx:Application>
The FlexGraph component is a wrapper for the Flare library's Visualization Flash object. Following is the code for this class:
package flex
{
  import flare.animate.Sequence;
  import flare.animate.Transition;
  import flare.animate.Transitioner;
  import flare.util.Button;
  import flare.util.GraphUtil;
  import flare.vis.Visualization;
  import flare.vis.controls.DragControl;
  import flare.vis.data.Data;
  import flare.vis.data.NodeSprite;
  import flare.vis.operator.OperatorSwitch;
  import flare.vis.operator.layout.CircleLayout;
  import flare.vis.operator.layout.ForceDirectedLayout;
  import flare.vis.operator.layout.IndentedTreeLayout;
  import flare.vis.operator.layout.NodeLinkTreeLayout;
import flare.vis.operator.layout.Orientation;
import flare.vis.operator.layout.RadialTreeLayout;
import flare.vis.util.graphics.Shapes;
import flash.display.Sprite;
import flash.events.MouseEvent;
import flash.geom.Point;
import flash.geom.Rectangle;
public class FlexGraph extends Sprite
{
private var vis:Visualization;
private var os:OperatorSwitch;
private var anchors:Array;
private var shape:int = 0;
public var WIDTH:Number = 800;
public var HEIGHT:Number = 550;
public function FlexGraph() {
name = "FlexGraph";
var w:Number = WIDTH;
var h:Number = HEIGHT;
var data:Data = GraphUtil.diamondTree(5,3,5);
vis = new Visualization(data);
vis.bounds = new Rectangle(0,0,w,h);
os = new OperatorSwitch(
new ForceDirectedLayout(),
new NodeLinkTreeLayout(Orientation.LEFT_TO_RIGHT, 20, 5, 10),
new IndentedTreeLayout(20),
new RadialTreeLayout(50, false),
new CircleLayout()
);
anchors = [
null,
new Point(40, h/2),
new Point(40, 40),
new Point(w/2, h/2),
new Point(0, 0)
];
os.index = 1;
vis.marks.x = anchors[1].x;
vis.marks.y = anchors[1].y;
vis.operators.add(os);
vis.tree.nodes.visit(function(n:NodeSprite):void {
n.size = 1.5;n.fillColor = 0x666666; n.fillAlpha = 0.8;
n.lineColor = 0x999999; n.lineAlpha = 0.9;
n.lineWidth = 2;
n.buttonMode = true;
});
vis.update();
addChild(vis);
vis.controls.add(new DragControl());
}
public function changeLayout( index:int ) : void {
switchLayout( index ).play();
}
public function starbust() : void {
toStarburst().play();
}
private function switchLayout(idx:int):Transition
{
vis.operators.clear();
vis.operators.add(os);
vis.continuousUpdates = false;
vis.operators[0].index = idx;
var seq:Sequence;
if (shape != 0) {
seq = new Sequence(
vis.data.nodes.setProperties({scaleX:0, scaleY:0}, 0.5),
vis.data.nodes.setProperties({shape:0,
lineColor:0xffdddddd}, 0.5),
vis.data.nodes.setProperties({scaleX:1, scaleY:1}, 0),
vis.data.edges.setProperties({lineColor:0xffcccccc}, 0.5)
);
} else {
seq = new Sequence();
}
shape = 0;
if (idx > 0) {
seq.onEnd = function():void {
var t:Transitioner = new Transitioner(2);
t.$(vis.marks).x = anchors[idx].x;
t.$(vis.marks).y = anchors[idx].y;
vis.update(t).play();
};
} else {
seq.onEnd = function():void { vis.continuousUpdates = true; };}
return seq;
}
private function toStarburst():Transition
{
vis.operators.clear();
vis.operators.add(new RadialTreeLayout(50,false));
var t0:Transitioner = new Transitioner(2);
t0.$(vis.marks).x = WIDTH/2;
t0.$(vis.marks).y = HEIGHT/2;
if (shape == Shapes.WEDGE) {
return vis.update(t0);
} else {
shape = Shapes.WEDGE;
return new Sequence(
vis.update(t0),
vis.data.edges.setProperties({lineColor:0}, 0.5),
vis.data.nodes.setProperties({scaleX:0, scaleY:0}, 0.5),
vis.data.nodes.setProperties({shape:Shapes.WEDGE,
lineColor:0xffffffff}, 0),
vis.data.nodes.setProperties({scaleX:1, scaleY:1}, 0.5)
);
}
}
public function play():void
{
var os:OperatorSwitch = vis.operators.getOperatorAt(0) as  OperatorSwitch;
if (os.index == 0)
vis.continuousUpdates = true;
}
public function stop():void
{
vis.continuousUpdates = false;
}
}
}
OperatorSwitch;
if (os.index == 0)
vis.continuousUpdates = true;
}
public function stop():void
{
vis.continuousUpdates = false;
}
}
}It looks like there is a lot to it, but it's actually fairly straightforward code. Most of the work is done in the constructor, where the data for the graph is set up along with additional controls. The switchLayout method changes the display mode of the graph and animates that transition to create some very cool effects. The toStarburst method changes from a traditional node display to a "starburst" display, which is shown a little later in Figure 13-6.
When the application first starts up, it looks like Figure 13-4.
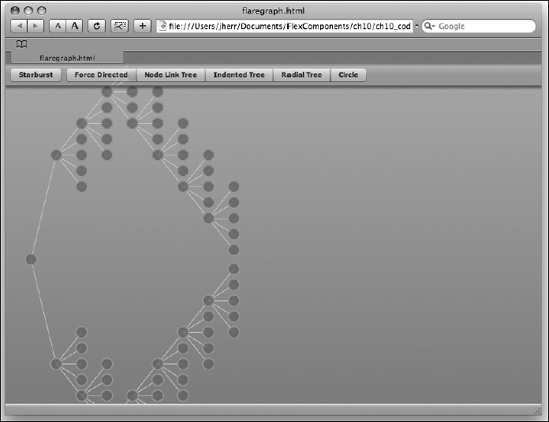
You can click the buttons in the application control bar at the top of the window to change how the nodes are displayed. Figure 13-5 shows the result of clicking the Radial Tree button.
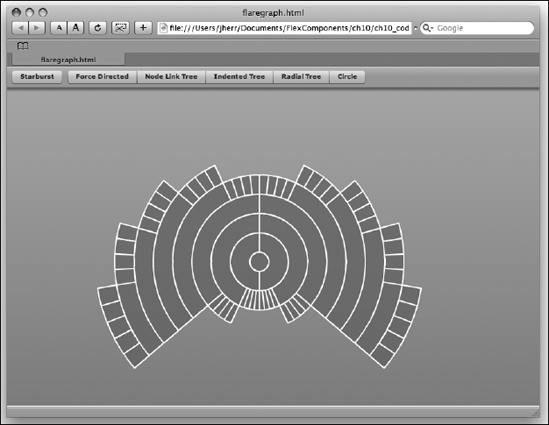
Clicking the Starburst button results in a very cool transition from whatever the current state of the graph is to the Radial Tree design first, and then on to the slicing design shown in Figure 13-6.
The Flare library is an amazingly cool library filled with unique visualizations, effects, and more. It's definitely worth your time to look into.

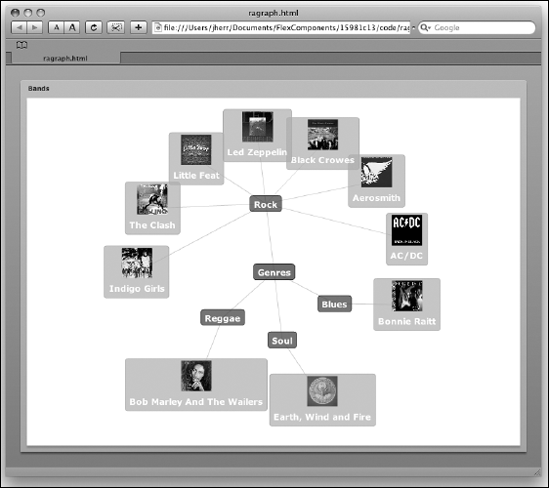
The BirdEye library (http://birdeye.googlecode.com/) contains a growing set of visualizations, including a node graph. The following application code visualizes the band data from the music database as a set of nodes in a node graph:
<?xml version="1.0" encoding="utf-8"?> <mx:Application xmlns:mx="http://www.adobe.com/2006/mxml" layout="vertical" xmlns:vg="org.un.cava.birdeye.ravis.graphLayout.visual.*" creationComplete="bands.send()"> <mx:HTTPService id="bands" url="http://localhost/music/music.xml" resultFormat="e4x" result="onBands(event);" /> <mx:Script> <![CDATA[importorg.un.cava.birdeye.ravis.graphLayout.visual.edgeRenderers.BaseEdgeRenderer;importorg.un.cava.birdeye.ravis.graphLayout.layout.ConcentricRadialLayouter;importorg.un.cava.birdeye.ravis.graphLayout.data.Graph;importorg.un.cava.birdeye.ravis.graphLayout.visual.IVisualNode;importmx.rpc.events.ResultEvent;private functionaddMembers( parent:IVisualNode, band:XML ) :void{for each(varmember:XMLinband.member ) {varmemberNode:IVisualNode = vgraph.createNode(member.toString()); memberNode.data = { name: member.toString(), color: 0x0000FF, image:null}; vgraph.linkNodes( parent, memberNode ); } }private functionaddBands( parent:IVisualNode, genre:XML ) :void{for each(varband:XMLingenre.band ) {varbandNode:IVisualNode = vgraph.createNode([email protected]()); bandNode.data = { name: [email protected](), color: 0x00FF00, image:'http://localhost/music/'[email protected]() }; vgraph.linkNodes( parent, bandNode ); addMembers( bandNode, band ); } }private functiononBands( event:ResultEvent ) :void{ vgraph.graph =neworg.un.cava.birdeye.ravis.graphLayout.data.Graph("genres");varrootNode:IVisualNode = vgraph.createNode("root"); rootNode.data = { name:'Genres', color: 0x333333, image:null};for each(vargenre:XMLinevent.result..genre ) {vargenreNode:IVisualNode = vgraph.createNode(
[email protected]()); genreNode.data = { name: [email protected](), color: 0xFF0000 }; vgraph.linkNodes( rootNode, genreNode ); addBands( genreNode, genre ); } vgraph.layouter =newConcentricRadialLayouter(vgraph); vgraph.layouter.autoFitEnabled =true; vgraph.edgeRenderer =newBaseEdgeRenderer(vgraph.edgeDrawGraphics); vgraph.maxVisibleDistance = 2; vgraph.displayEdgeLabels =false; vgraph.currentRootVNode = rootNode; vgraph.draw(); } ]]> </mx:Script> <mx:Panel width="100%" height="100%" title="Bands"> <vg:VisualGraph id="vgraph" width="100%" height="100%" itemRenderer="MyNodeRenderer" /> </mx:Panel> </mx:Application>
The application first starts up by requesting the XML for the music library. The onBands method creates a graph, and then creates the root node for the data. From there, it iterates over each genre, creating a node for it, and then calling the addBands method to add the bands to the node. The addBands method adds a node for each band to the graph and calls the addMembers method to add nodes for all of the members.
After creating the graph, the onBands method sets up the rest of the vgraph member variables and calls the draw method to render the graph. If you don't like how the graph is laid out, you can change the object that is set in the layouter member variable to a different layouter type.
The itemRenderer that renders each node is shown in the following code:
<?xml version="1.0" encoding="utf-8"?> <mx:VBox xmlns:mx="http://www.adobe.com/2006/mxml" width="100" height="20" horizontalScrollPolicy="off" verticalScrollPolicy="off" creationComplete="onData()" dataChange="onData()" paddingBottom="3" paddingLeft="3" paddingRight="3" paddingTop="3" cornerRadius="5" borderColor="#999999" borderStyle="solid" backgroundColor="#cccccc" backgroundAlpha="0.7" borderThickness="1" horizontalAlign="center"> <mx:Script> <![CDATA[private functiononData() :void{
if( !initialized || !data )return;varmet:TextLineMetrics = txt.measureText( data.data.name ); width = met.width + 15; height = met.height + 8; setStyle('backgroundColor', data.data.color ); setStyle('borderColor', data.data.color );if( data.data.image !=null) { img.source = data.data.image; img.width = 50; img.height = 50; img.visible =true; img.includeInLayout =true; height += 60; } } ]]> </mx:Script> <mx:Image id="img" visible="false" height="0" width="0" includeInLayout="false" /> <mx:Label id="txt" text="{data.data.name}" fontSize="14" fontWeight="bold" color="white" /> </mx:VBox>
This is a pretty simple component. It just takes the name of the node and puts it into the label. It then uses the measureText method to figure out just how big the name is and adjusts the size of the container accordingly. If there is an image associated with the node, it sets the local image object and resizes the node to match.
It also sets the colors so that genres are in red, bands are in green, and band members are in blue.
When the application first starts up, it looks like Figure 13-7.
From here, you can double-click any of the nodes to navigate along the tree. In this case, I double-clicked The Clash, and you can see the result in Figure 13-8.
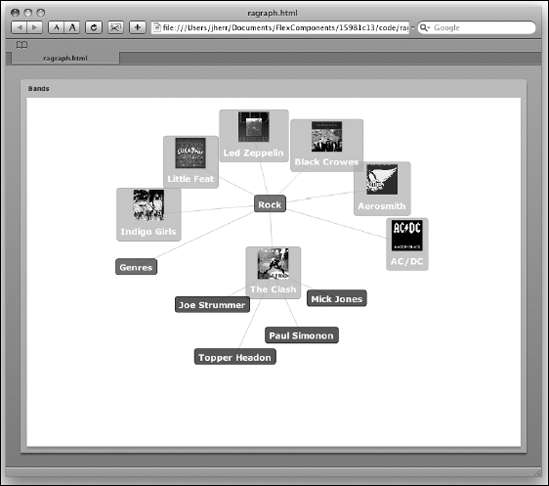
One very nice thing about the RaVis network graph component is that it automatically hides nodes that aren't in the area you are currently navigating. That way it kind of cleans up after you as you navigate around big node graphs.
The yFiles FLEX framework (http://www.yworks.com/en/products_yfilesflex_about.html) is the pinnacle of node graph systems. It's an OEM product that has both a client and a server component to it. The client does the basic rendering of the graph and the editing. The server does the graph layout and maintains the persistent state of the network so that multiple users can edit a central graph simultaneously.
You can see the yFiles node graph in action in Figure 13-9.

The yFiles FLEX framework is a serious piece of work. It's well worth considering if you are looking to build an industrial-strength application that has serious multiuser diagramming requirements.
The few examples in this chapter barely scratch the surface of what you can do with some creativity and these components. Even if this type of dynamic graphing isn't your thing, you should try some of these examples out anyway as they demonstrate what can be done in terms of interactivity with Flex and Flash applications. This kind of thing would be insanely difficult to do with DHTML and Ajax.
In the next chapter, I'll show how to reskin your application to give the whole thing a completely different look and feel with very little effort.