CHAPTER 10
Digital Marketing-Landscape and Emerging Areas
LEARNING OBJECTIVES
After studying this chapter, you will be able to:
- Explain global marketing spend by category as well as compare the share of global advertising spend across all traditional and digital media types
- Analyze the break up of global and digital advertising spend by format along with the ad spending share by industry
- Understand India specific digital marketing statistics with break up of media and entertainment industry segment numbers and percentage division of key digital advertising categories
- Gain exposure to India specific Digital Marketing/Advertising Tools Landscape
- Explain the impact of three major concepts that have been shaping digital marketing, namely, data technologies, business segments, and hyperlocal targeting
- Cover upcoming digital marketing concepts including Big Data and Internet of Things (IoT), Small and Medium Businesses (SMB), B2B marketing and Social, Local and Mobile (SoLoMo) concept
CASE STUDY One97 Communications: No Cash, No Corruption!
What would you say if an entrepreneur commented that he could help remove corruption from India? Vijay Shekhar Sharma’s mobile commerce business, Paytm, gives him a reason to believe it could be a reality. In one of his interviews he stated, “Corruption is nothing but cash flow. We aim to build a cashless economy. No cash, No corruption!” Operating in a field which can have as great an impact, it is no surprise that One97 is one of the fastest growing players of the mobile Value Added Services (VAS) industry in India. Paytm, which is the most promising business for One97, claims to be India’s biggest mobile wallet with over 122 million users and is aiming to become the Paypal of digital payments.
For a company founded in December 2000, One97’s real success came with the launch of Paytm which started out as a mobile recharge site and transformed into a mobile retail marketplace. With over 5,000 merchants on the platform and processing over 75 million orders a month (October 2015), Paytm had made real growth from FY2013–14 to FY2014–15, with an increase in 60 per cent revenue to ₹ 337 crore. This growth, if seen against the data on losses (at ₹ 372 crore), showcases a relative state of decline, but most of that is attributed to the rise in advertising and promotional expenses which has risen by over 1100 per cent over the previous fiscal year. The focus on branding has also resulted in Paytm achieving a unicorn status, with over $ 1 billion valuation.
So, how did this all begin and what is the growth engine for One97? Vijay Shekhar Sharma, a topper throughout his school days, had always showed an entrepreneurial streak right from his college days. During the third year itself, he partnered with his batchmate to build a company called ‘Xs! Corporation’ which was a web portal that offered web-guided services (including web directories and even a search engine) with a seed money of ₹ 20,000 obtained from an individual Angel Investor. Between February–May 1999, with a turnover reaching ₹ 50 lakh, he sold the company to Living Media India for half a million dollars.
The name One97, which was Vijay’s next venture with founder Rajiv Shukla, interestingly got its name from the directory enquiry service number of BSNL. The company initially started offering live astrology services for a GSM operator in Delhi in 2001 and, over the next few years, launched SMS-based applications, VAS for landline, gaming applications, and subscription-based content services. In 2010, Paytm was launched as a part of the pitch Vijay had made to his company’s board to enter into the payment ecosystem, an idea which was initially looked at with scepticism but then went through with a personal investment of $ 2 million by Vijay himself. The success of Paytm has been testified by multiple rounds of investment, of which the successful raise of a capital of $ 575 million from Chinese tech giant Jack Ma, the founder of Alibaba, was the most talked about. Others topping the list of investors include Soft Bank Asia, Ratan Tata, Intel Capital, and Silicon Valley Bank.
Paytm, which claims to be India’s biggest mobile wallet with over 122 million users, has taken multiple initiatives to make it rise amongst a maze of similar competition. The most crucial component definitely has been customer service. Vijay rolled out a strong 24 × 7 customer care service to address the worries of customers and enable them to trust the wallet, enough to put their money into the hands of the unknown. Once trust was built, it propagated through word-of-mouth, with around 30 per cent of the company’s initial campaign budget been invested in building trust with the customers.
Alibaba’s investments in Paytm have been instrumental not only in a financial sense for Vijay but also in terms of guiding its future strategies. Paytm has taken a leaf from Alibaba’s strategy to involve local merchants in e-commerce and boost their sales through what is widely known as O2O (online-to-offline) marketplace. The O2O model enables a consumer, searching for products and services online to buy it through an offline channel. Paytm through this model hopes to rope in local players and help them drive footfall and sales at their stores. In return, these stores will act as individual warehouses and fulfilment centers. With this model, Paytm will invest to rope in more merchants as opposed to building warehouses, which gives it a competitive edge over Flipkart, Amazon, and Snapdeal. To make this model a success, Paytm has recently invested in O2O discovery platform ‘Little’ and hyperlocal service marketplace ‘near.in’ and has already roped in 1,500 merchants in top 10 cities.
Apart from the O2O model, Paytm is also eyeing the education sector to hit its revenue target of $ 2 Bn by the end of the next financial year (2016–17). The education sector in India is worth about $ 100 Bn (about ₹ 6.7 lakh crore). The mobile wallet is planning to provide a cashless alternative to payments of all kinds across schools, colleges, universities, as well as premier institutions such as Indian Institutes of Technology and Indian Institutes of Management. The company plans to have cashless campuses for 25,000 educational institutions, both government and private, where all payments — fees, dues, canteen facilities, tuck shop products—could be made through Paytm.
Apart from the education sector, Paytm is also looking to venture into online travel business by branching out into rail, road, airline, and tour bookings. Selling products under categories like mobiles and accessories, electronics, men’s fashion, women’s fashion, baby kids and toys, home and kitchen on its website, Paytm planned to invest around ₹ 120 crore on its travel marketplace in 2016. It has also recently announced its partnership with PVR to sell online movie tickets on its e-commerce platform.
Finally, with Paytm now possessing the necessary permissions from the Reserve Bank of India, it is all set to launch Paytm banks all over India, which would take its services to a different league altogether. Vijay is standing tall to a personal fact he shared in one of his interviews to Business Insider, stating that he hates reading fiction, since one cannot be inspired by made-up tales but instead make them happen in reality—a reality he surely has been able to construct for himself.
In Chapters 4 to 8, we covered the five phases of ASCOR digital marketing framework to understand how digital marketing strategies are developed, operations set, and campaigns executed. The previous chapter (Chapter 9) covered all the elements which help execute digital marketing along with the key implementation challenges involved.
In this last section of the book we will concentrate on the key global and Indian trends in digital marketing along with the emerging areas and concepts which are impacting the digital landscape, as well as the emerging career opportunities in digital business (Chapter 11) so that students can utilize the knowledge and concepts gained in the book and convert them into a successful digital marketing career. The first part of the chapter begins with an overview of global digital marketing, key trends, and tools/technology landscape. The second part focuses specifically on the Indian landscape and covers key data and trends emerging in the Indian digital marketing scene along with a focus on e-commerce which has been the key propeller behind this rise. Finally, we will cover the most pertinent business concepts impacting digital marketing with the key ones including impact of digital technologies, emergence of digital media segments, and the rise of hyperlocal marketing.
DIGITAL MARKETING—GLOBAL LANDSCAPE
With digital marketing growing in size and operations globally, we will start the discussion with an analysis of the global spend buckets for overall marketing activities by category and narrow it down further according to digital ad-spend format. In this first part of the chapter, we will gain an understanding of the global digital marketing landscape through the Hallam Digital Marketing Tube Map and have a look at the digital marketing tools landscape to study the host of vendors that have emerged across the ecosystem.
Digital Marketing Overview—Global Spend
To calculate the overall size of global digital marketing business and its growth pattern, we will need to size the global marketing spend across key categories like advertising, marketing services, ad agency/marketing BPO fees, data/intelligence, and software/technology. This would help us clarify the difference between impression and non-impression-based spends.
Figure 10.1 shows data picked up from a 2012 BMO Capital Markets Report. This data was culled from various sources like GroupM, DMA, Winterberry/Acxiom/Teradata, IDC, DemandTec, AdAge Data Center, and provides an estimate of 2020 numbers for all key categories of marketing spend.
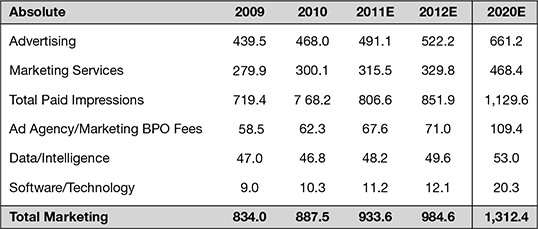
Figure 10.1 Global Marketing Spending by Category
As of 2012, the report estimates that the total marketing spend has been $ 1 trillion. This amount can be classified as impression-based and non-impression-based spend, wherein impression spend denotes the total of advertising spend (including TV, radio, newspaper, magazine, internet impressions) and marketing services spend (including content-based impressions—direct mail, email, sponsorships, promotions, public relations). The non-impression-based spend is covered by categories like ad agency/marketing BPO fees, data/intelligence and software/technology. If we add up the numbers, around 87 per cent spend is impression-based while 13 per cent is spent across the multiple categories of non-impression spend.
With an understanding of the overall marketing spend numbers, let us look at the global advertising spend forecast for 2016 (Source: Zenith Optimedia).
In Fig. 10.2, the division of Global Advertising Spend is represented by all traditional and digital media types. Here, the digital advertising numbers are covered by the categories of desktop internet and mobile internet. Since 2015, digital advertising has surpassed print media (includes newspaper and magazines), as the second biggest advertising category after television.
Though television still reigns supreme (with a 38.3 per cent share), the rapid rise of mobile internet is poised to give the top medium a tough fight. At present, the combined share of desktop and mobile internet numbers stands at 28.3 per cent, which is a good 8 per cent rise over 2013 numbers (which stood at 19.7 per cent). In terms of the fastest growing ad markets in absolute terms (2013–16), the top three countries for global advertising spend include the Unites States (grew at 22.7 Mn), China (grew at 15.8 Mn), and Indonesia (grew at 6 Mn). India, with a total spend growth of 1.9 Mn, stands at the tenth position, just behind South Korea.
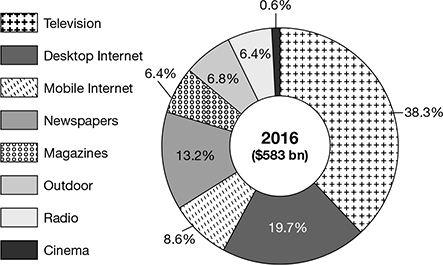
Figure 10.2 Share of Global Advertising Spend by Medium (2016)
Digital Marketing Overview—Advertising Spend
Having looked at the global figures for digital marketing and the share of digital advertising in the total advertising spend, in this section we would study the break-up of global advertising spend by format, as well as digital advertising numbers for the largest spending country, US, along with figures for US digital ad spending share by industry.
In Fig. 10.3, Magna Global (Dec 2014) estimates $ 80 billion to be spent on search advertising around the world in 2015, which makes it the largest ad spend format followed by display marketing at $31 billion. By 2019, a projected $118 billion will be spent on search marketing which would still be the largest category while display is projected to grow only to $35 Bn. In comparison, social and video are two categories which will witness the strongest gains, with video starting from a much smaller base. Online and mobile video are slated to become increasingly popular.
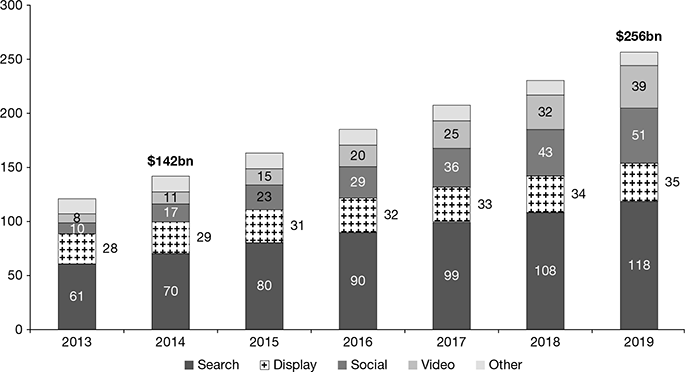
Figure 10.3 Global Digital Ad Spend by Format (Magna Global)
In Fig. 10.4, we move on from global numbers to digital ad spending data specific to the US (since it has the largest digital ad spend of all countries). According to eMarketer, search continues to be the leading digital ad spending format, although its share has dropped in 2016 (compared to 2010) as the shares of rich media, sponsorships, and video increase.
Display ad spending, which includes banner ads, video, rich media, and sponsorships is expected to rise to 45.6 per cent of the total in 2016. Search’s share of total digital ad spending has decreased from 47.1 per cent in 2012 to 44.2 per cent in 2016. Between 2010 and 2016, classifieds and directories category rose a bit, lead generation augmented by around 70 per cent while mobile messaging remained almost stable showing only a slight increase.
In Fig.10.5, we look at the US digital ad spending share based on industry type and, as evident, retail leads the pack with a good stable share (around 22 per cent) which is expected with the global rise of ecommerce industry. By 2017, the US digital retail industry is expected to grow to $ 13.5 billion, representing a 10.5 per cent compound annual growth rate (in comparison to 2013).
eMarketer reports that the retail industry will keep its lead during the four-year forecast period, but lose a small portion of its share of total US digital advertising dollars, dropping from a 22.3 per cent share in 2013 to 22 per cent share in 2017.
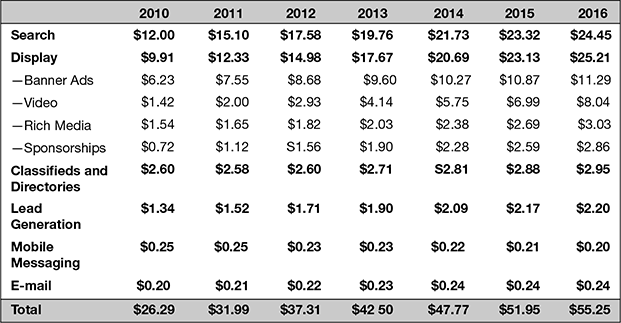
Figure 10.4 US Digital Ad Spend by Format (eMarketer)
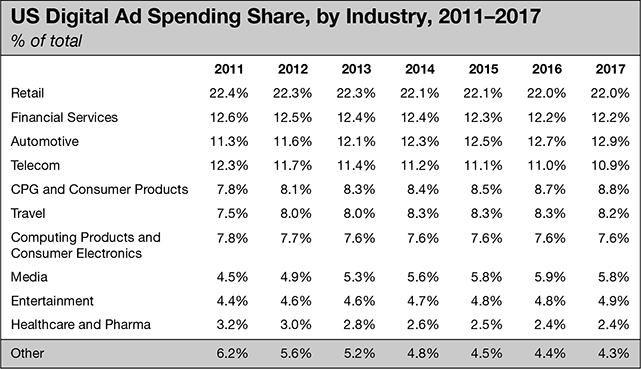
Figure 10.5 US Digital Ad Spending Share by Industry (eMarketer)
With the largest portion of retail digital ad dollars going to direct-response campaigns, online and multi-channel retailers, along with catalogue retailers and restaurants, typically spend two-thirds of their paid digital budgets on direct response and the remaining one-third on brand-focused campaigns.
Conceptualizing Digital Marketing Landscape
With an understanding of the global marketing and advertising spends, in this section, let us look at the overall landscape for global digital marketing services which multiple vendors are delivering to clients across industries and functions. To understand and explain this classification, we will take support of ‘The Digital Marketing Tube Map’ by digital marketing agency ‘Hallam,’ which has developed a visually striking way of looking at these areas and services. This map lays down almost all possible digital marketing implementation areas through the use of a subway-station styled map which lays out these services in the form of stops and stations. Let us study this map in more detail.
In Fig. 10.6, we can look at the complex landscape of digital marketing as showcased in terms of a tube map.
The map according to Hallam can be better understood as a mesh of stations and stops with stations that are representing individual campaigns or platforms, and stops representing the areas that need to be considered for any online campaign to be a success. As we can see in the diagram, there are total 14 stations which encompass all key areas of digital marketing. These include:
- Mobile
- Social Media
- CRM
- Paid Search
- Social Paid
- Email Marketing
- Social Media
- Local SEO
- Content Marketing
- Emerging Technology
- Technical SEO
- Analytics
- Website
- Inbound Links
Although in the earlier chapters of the book, we have looked at most of the above domain and operational areas, the intent of introducing the Hallam Tube map is to share a more integrated view of digital marketing, i.e., as an interdependent mesh of domain, operational areas, and technologies.
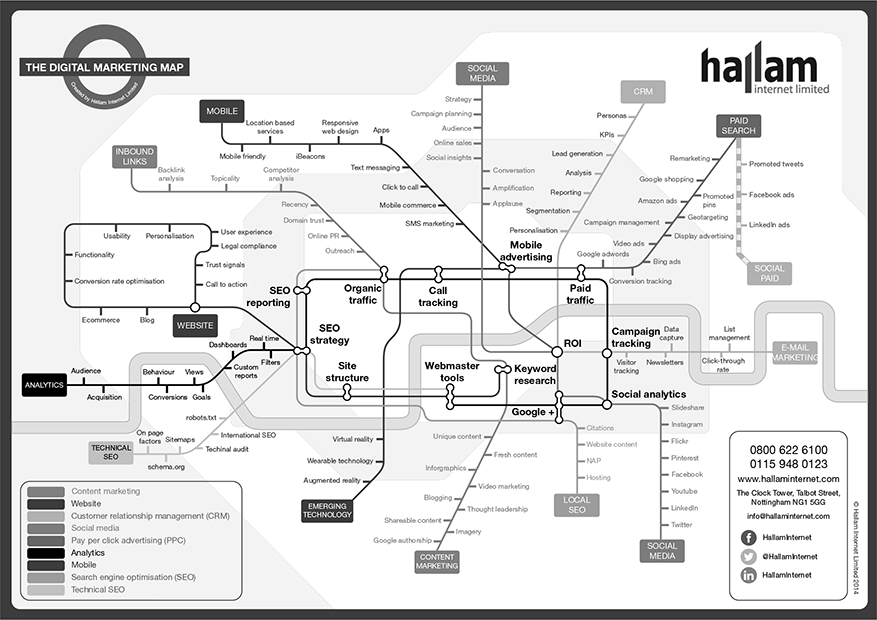
Figure 10.6 Hallam Digital Marketing Tube Map
Digital Marketing Technology/Tools Landscape
With multiple functional and technology areas gaining prominence to cater to upcoming digital marketing activities, a host of vendors have emerged which provide services across each of the point areas, as discussed in the previous section. To make sense of the digital tools landscape, Lumapartners (a strategic media, marketing, and technology advisory) has launched multiple infographics by the name Lumascapes which aim to provide a well-classified view of key emerging tools/technology vendors presently in the advertising and marketing sectors. Let us look at one of the most prominent of Lumascapes which lists key marketing technology areas and top tools across each of them.
Figure 10.7 showcases tools across the ‘Marketing Technology’ sector focusing specifically on sales and marketing and website-related areas.
The main areas included in each of the key sectors in the infographic include:
- Sales and marketing sector: Marketing Modeling; Integrated Marketing Management; Social Marketing Management; E-mail Optimization; E-mail Service Providers; Marketing Automation; Database Marketing; Visualization; DMPs; Marketing Data; and Data Warehouses
- Website ‘personalization and optimization’ sub-sector: SEO Platforms/Tools; Real-time Message/Offers; Landing Pages; AB/MV Testing; and Recommendation Systems.
- Website ‘e-commerce technology’ sub-sector: Platform/Storefront; Social Referral; Merchandising; Payments; and M-commerce
- Website ‘creation and management’ sub-sector: WCM (Content Management Systems); Web Analytics; DAM (Digital Asset Manafement); Online Video Players; Tag Management; Site Performance; Feedback/Surveys; Community; Social Content/Forums; Mobile Web; Social Login/Sharing; Translation; and Gamification.
Apart from Lumascape, Scott Brinker (Co-founder and CTO at ion interactive, inc.) releases an yearly infographic on Chiefmartec.com (his prominent Chief Marketing Technologist Blog).
Figure 10.8 showcases the 2014 edition of this, and represents a whopping 947 different companies that provide software for marketers, organized into 43 categories across 6 major classes.. Scott Brinker has divided the marketing technology landscape into categories like marketing experiences, marketing operations, middleware, backone platforms, infrastructure, with the largest numer of tools listed across sub-categories like key marketing, sales, operations, analytics, infrastructure, etc.
DIGITAL MARKETING—THE INDIAN VIEW
With an understanding of the global landscape for digital marketing, we would now look at India-specific digital statistics which would reveal trends quite differentiated from the global markets.
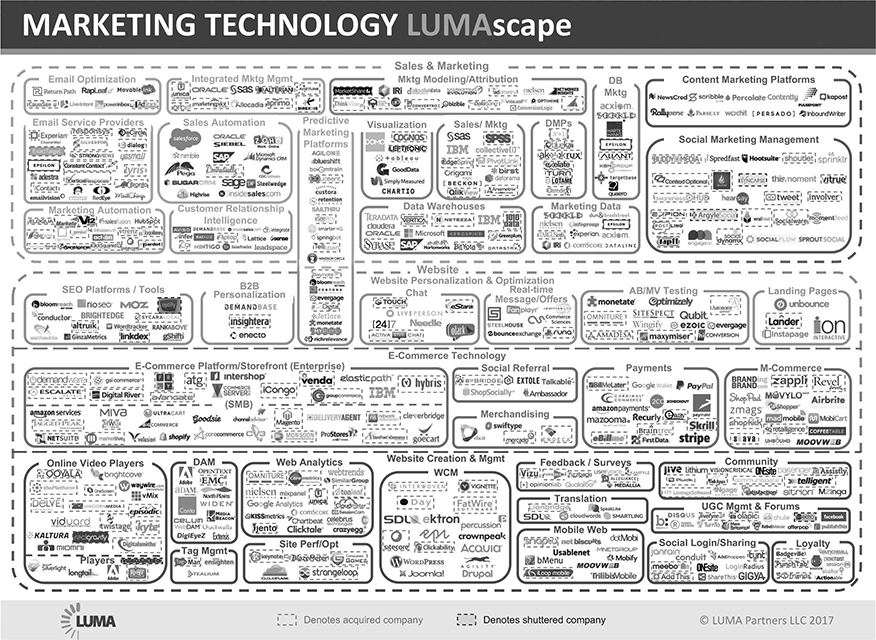
Figure 10.7 Marketing Technology Lumascape
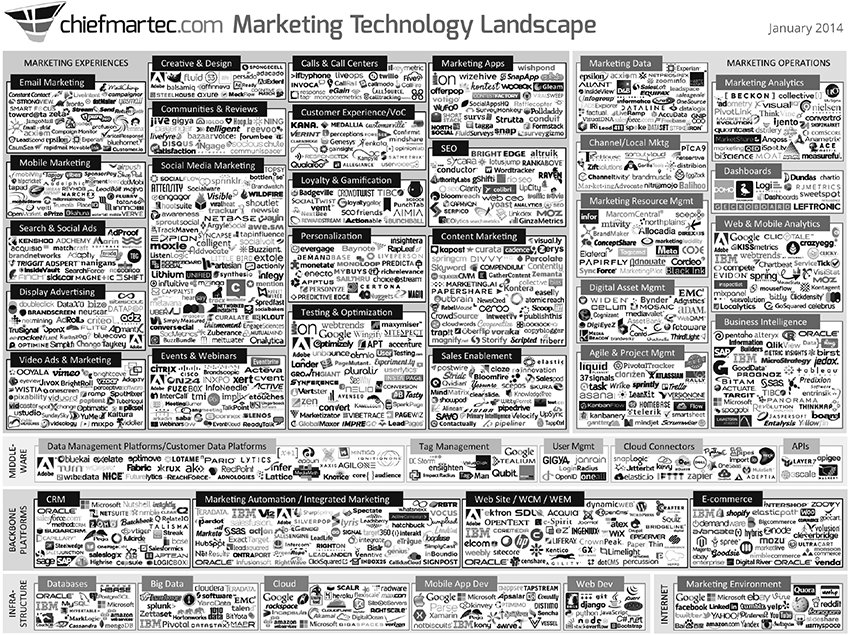
Figure 10.8 Marketing Technology Landscape (Chiefmartec.com)
India Digital Spend Overview
The overall internet penetration numbers and the diversity of the Indian consumer (in terms of urban/rural divide) has had a major impact on digital marketing and advertising trends and the overall adoption of digital services in India.
Figure 10.9 showcases the rise in total number of internet users in India to over 550 Mn in 2018. It also depicts the urban/rural divide, wherein we see the number of rural internet users increasing upto 40 per cent by the year.
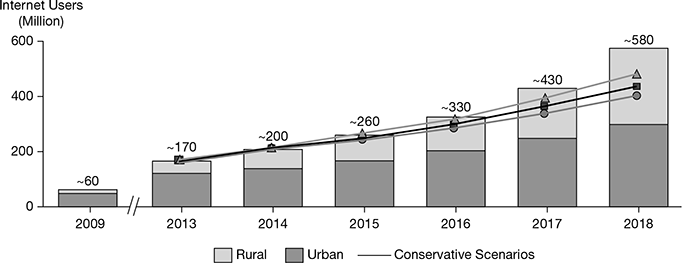
Figure 10.9 India Internet Population Divide (BCG Analysis)
In Fig. 10.10, we can look at the key areas of the contribution of internet to GDP, the most important among them being e-commerce products, online content, and advertisements and classifieds. It is estimated that internet’s contribution to GDP is set to grow at 23 per cent compared to overall GDP growth of 13 per cent.
Figure 10.11 showcases the percentage break-up of all media segments, comparing 2016 numbers and the estimated figures of 2020. It is quite evident that TV will rule the media segments and its share will increase further in the coming years. Also, digital advertising as a category will grow from 6.17 per cent in 2016(E) to an estimated 11.29 per cent in 2020(P), which depicts almost a double growth.
In Fig. 10.12, we look at similar industry-wise classification of the Indian media and entertainment sector, this time, in terms of absolute and growth numbers. Overall advertising revenues in 2014 grew at a growth rate of 14.2 per cent over 2013 to reach ₹ 414 billion. It is interesting to see that while digital advertising has the highest growth percentage of more than 44 per cent (2014 over 2013), those numbers are projected to grow at around 30 per cent (in terms of CAGR 2014–2019).
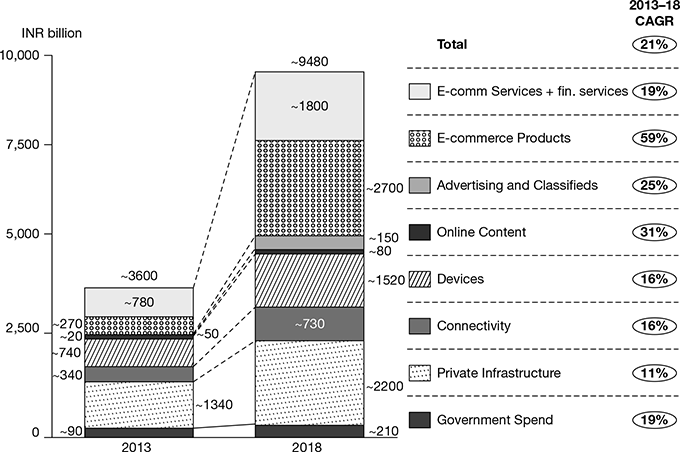
Figure 10.10 Internet Contribution to GDP in India (BCG Analysis)
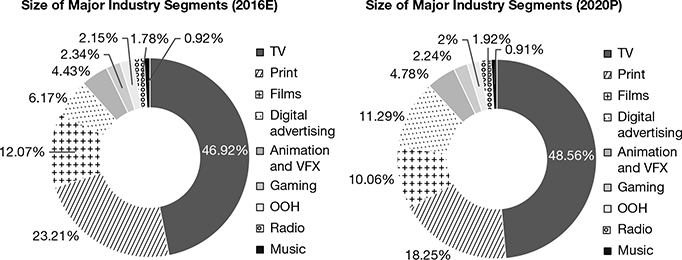
Figure 10.11 India Media and Entertainment Industry Segment Numbers (IBEF.org)
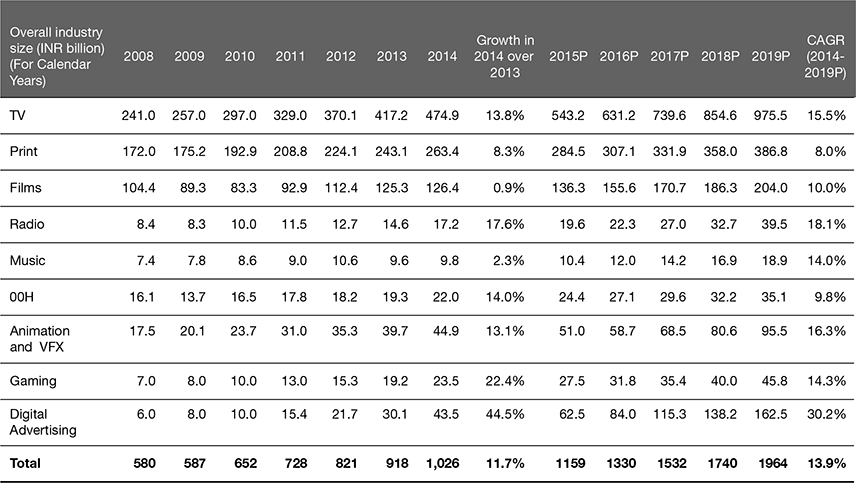
Figure 10.12 Size and Projections of the Media and Entertainment Industry of India
India Digital Advertising Spend
With an understanding of the overall digital media spend, in this section, we would look into the specific numbers for advertising, their shares, forecasts, and classification in more detail.
Figure 10.13 depicts the total media, digital, and mobile internet ad spending numbers in India from 2013 till 2018. As we can see, total spending on advertising across all media is decreasing and expected to touch $ 7.93 Bn in FY2018. The share of digital advertising revenue as a percentage of total media spending is expected to increase to 22.4 per cent with a total value of $ 1.77 Bn in 2018. Also, the mobile internet ad spending is projected to grow rapidly to 11.9 per cent of the total media ad spending.
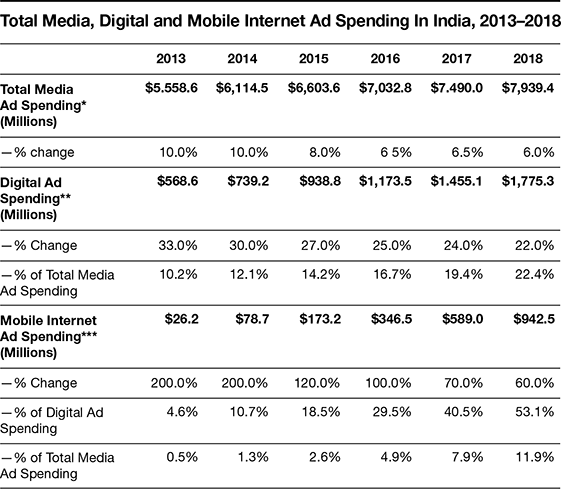
Figure 10.13 India Advertising Spending Forecast (eMarketer)
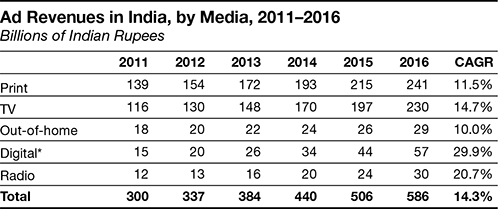
Figure 10.14 India’s Ad Revenues (Size and Growth)
In Fig. 10.14, we look at industry-wise classification of advertising revenues in terms of absolue and CAGR growth numbers. Print industry shows the highest revenues (in number terms) of ₹ 241 Bn in 2016, and less than average CAGR growth (11.5 per cent) of all categories combined (which is expected to be 14.3 per cent). On the other hand, with 57 Bn in 2016, digital advertising though has lesser revenues in absolute numbers, it is supposed to have the highest CAGR growth rate at 29.9 per cent which is more than double of Television CAGR at 14.7 per cent. These numbers showcase the strong growth digital advertising is expected to attain in the near future.
In Fig. 10.15, we can see percentage-wise division of key digital advertising categories through a comparative analysis between FY2012 to FY2014. The overall industry has seen tremendous growth with overall market size reaching to ₹ 2750 crore in FY2014.
Search and display have been the top two categories of online advertising spend but, as we can see, from a very high share of 34 per cent and 41 per cent each, they show a decline from FY2012 to FY2014, with display depicting a rapid decline to 23 per cent.
Mobile ad spend has almost doubled from 7 per cent to 14 per cent while social media has grown to 80 per cent in FY2014 from its base in FY2012. E-mail marketing remained stagnant at 3 per cent of the market.
The last category, Video, grew more than double from a 5 per cent share to an overall 12 per cent share in FY2014.
Key Digital Advertising Trends in India
With a look at the overall digital advertising spend and categories, let us analyze the key digital advertising trends as shared by the FICCI-KPMG India Media and Entertainment Industry Report 2015. The key trends related to top digital advertising categories are as follows:
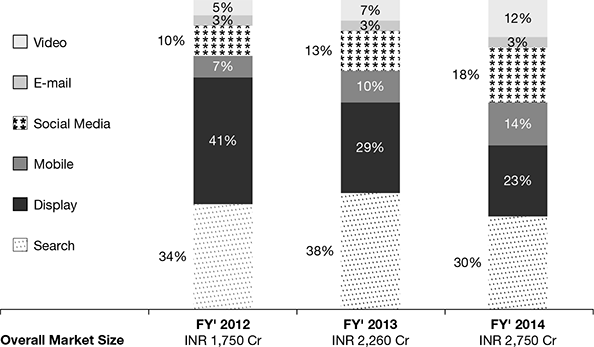
Figure 10.15 Online Advertising Spend India (IMRB)
- Share of search and display advertising is dropping: As depicted in Fig. 10.15, though search and display advertising are at the top, their percentage share in the overall portfolio has continued to drop since 2012. The prime reason for this shift is attributed to the changing preferences in consumption from desktop to mobile, wherein display specially has a disadvantage. According to the report, the web-page views through laptops and desktops are declining at 13 per cent year on year, while the views on mobile and tablets are increasing at 39 per cent and 7 per cent, respectively. Also, specifically for the display segment, there has been a shift to rich media as consumers prefer formats which are visually rich and appealing.
- Strong growth recorded in mobile advertising: According to the report, mobile advertising numbers grew by a record 260 per cent since July 2013 which is by far the fastest in the world.
Figure 10.16 shows the strong growth in mobile internet penetration in India which is the main driver behind the growth in mobile advertising. Mobile-based transactions are crucial for digital start-ups since owning a mobile is becoming cheaper by the day and a mobile provides the most personalized medium along with advantages like availability of location-based data, customer usage behavior, etc.
- In-stream video ads gaining strong impressions: With the growing popularity and acceptance of YouTube ads and in-app video ads, video advertising has grown at a hectic pace and from 2012 to 2014. It has outperformed all other online ad formats with the highest CAGR of 56 per cent. With short promotional videos in trend for both movie content and advertising, video ads are a very engaging medium not only to promote multiple product aspects as short bursts, but also to develop thought-provoking long-form video content which normally would not be screened in television (because of price and viewability factors).
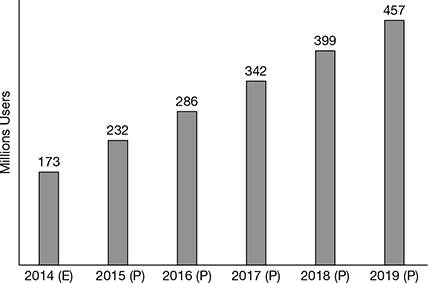
Figure 10.16 Mobile Internet Penetration in India (KPMG)
Source: KPMG in India Analysis - Social media-promoted content gaining importance: With an overall spend of ₹ 495 crore in 2014, social media-promoted advertising formats like sponsored/promoted tweets and posts, text links and videos have gained prominence. Each social media platform offers a distinct advantage like LinkedIn being the best for B2B marketing, Twitter for real-time promotion, Facebook for customer engagement and promotions, etc., making social media a very important mix for advertisers.
- Native advertising gaining prominence on mobile: Native advertisements by definition are ads which are created in a format similar to the medium itself. For example, a sponsored post in Facebook typically looks similar in styling, content, and design to general Facebook posts, thus giving such an advertisement more of a chance to be discovered by a ready potential audience. Native formats also give an opportunity to advertisers to gather specific details for a particular audience on a platform which helps deliver real-time promotions based on geo/user/device-specific knowledge which the mobile ecosystem can provide.
- Increasing use of remarketing across platforms: Increasingly digital marketers in India are adopting remarketing as a successful way to convert prospects who have visited a firm’s website, mobile site, and applications. Remarketing essentially involves targeting prospects to convert them into leads by sharing messages related to the products and services they had accessed on the website earlier. It also helps to re-target products which prospects might have abandoned on e-commerce carts on website. This is all possible through the advancement in algorithms which are smart enough to follow a customer throughout their buyer life-cycle on multiple platforms; the retargeting abilities are provided by multiple advertising tools.
- Programmatic and real-time buying gaining traction: The rise of algorithms is also supporting marketing ecosystem players to buy and sell advertisements in real time in a programmatic manner which not only helps reduce cost but make the whole exercise highly targeted and RoI driven in nature. Though Indian companies had not adopted programmatic in a big way earlier, its adoption is bound to become much more mainstream, given its global adoption and success.
India Digital Marketing/Advertising Tools Landscape
In the last section of this part, we would look at the overall digital marketing tools landscape in India across all key digital marketing areas.
Figure 10.17 showcases the most popularly used digital marketing tool brands in India across areas including e-mail, sms, social media, search, digital, mobile VAS marketing.
Figure 10.18 depicts the most popularly used display advertising tool brands in India.
Figure 10.19 shows the most popularly used mobile commerce tool brands in India.
DIGITAL MARKETING-EMERGING TRENDS AND CONCEPTS
With a round-up of one of the global and India specific digital marketing trends, in this section, we would cover the most pertinent digital marketing trends which are impacting both dollar spend and technology adoption. Although each of the trends has multiple quantitative data behind it to debate the growth and influence of that area, our attempt here is to focus on the most impact trends at an overall level and not an RoI-based assessment.
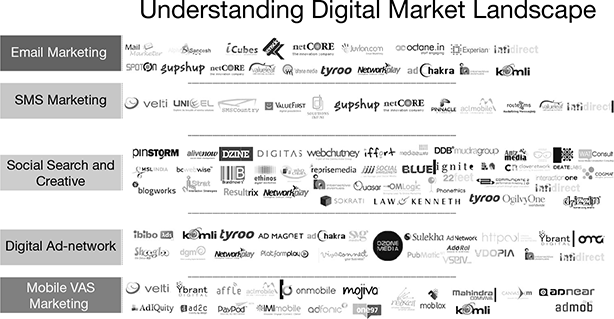
Figure 10.17 India Digital Marketing Tools Landscape
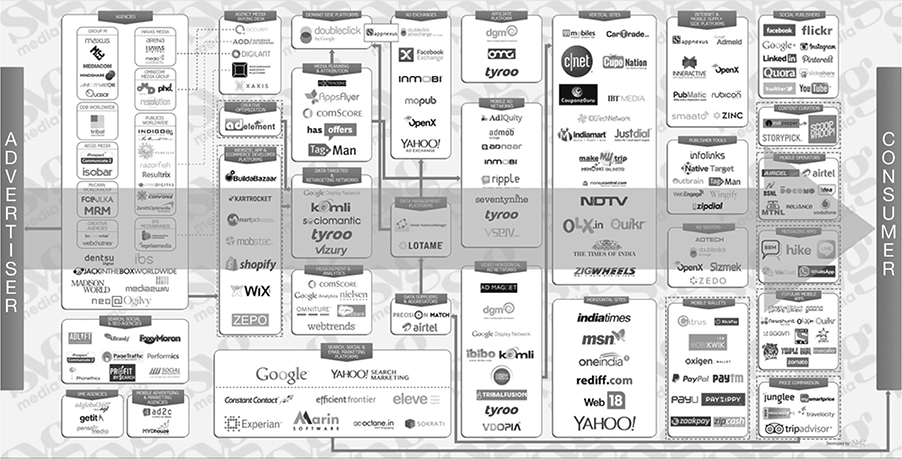
Figure 10.18 India Digital Advertising Landscape 2014 (SVG Media)
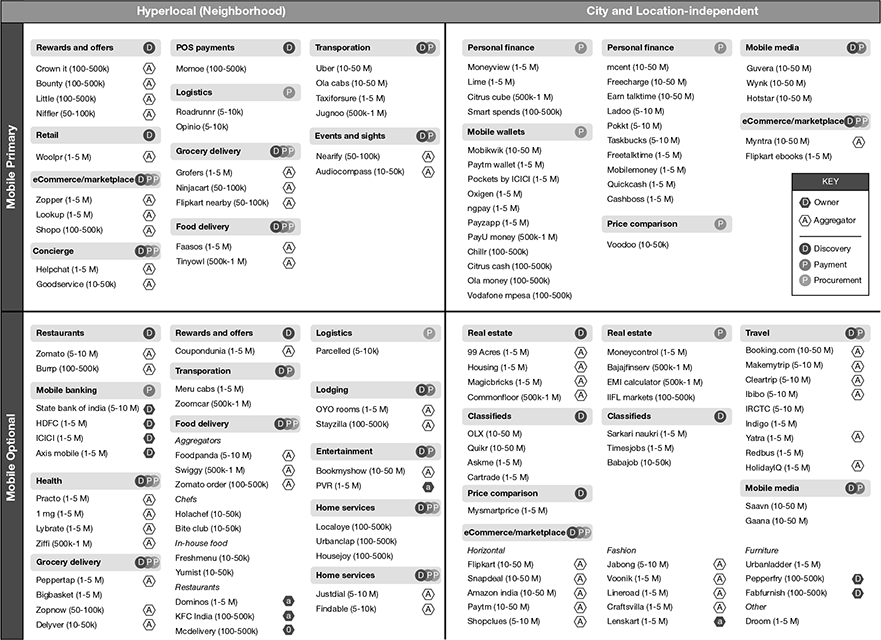
Figure 10.19 India Mobile Commerce Landscape 2014 (SVG Media)
According to multiple industry sources, here are the top ten most impactful trends:
- Voice Marketing: This is one of the biggest trends to dawn on digital marketing in 2018, and it can be attributed to the way voice-based marketing has entrenched all digital channels and platforms. With Amazon Echo and Google home picking up on the success of voice assistants (Assistant, Siri, Alexa, Cortana, etc.) to develop voice search-based products, usage of this product has increased across consumer segments. There is a high probability that along with wearable watches and health assistant digital bands, voice-tech products will be the harbinger of the real on-the-ground IoT (Internet-of-Things) revolution, which has been predicted a long time back.
- Micro-influencers: With influencer marketing making waves globally, multiple platforms have already taken this concept deeper across the Indian digital consumers. A bigger trend that is shaping influencer marketing relates to local or geo-specific influencers who are experts in their domains and have a ready audience to bring to multiple digital or social platforms. A prominent impact of micro-influencers is the possibility of a strong personal or offline influence this population can exert to bring magic to the way users engage with a brand and experience it in a trusted manner.
- General Data Protection Regulation or GDPR: The launch of GDPR in Europe was a gamechanger and a first for data protection and privacy for individuals. It is an initiative that is bound to have multiple roll-over effects on the way digital marketing will be executed not just in the EU region but across the world. With marketers now needing to follow strict compliances (with a heavy fall-out fee), GDPR looks to be restrictive; however, it can also provide benefits to marketers in terms of building customer trust, putting user-experience in the forefront, and activating data-security improvements.
- Growth Hacking: One of the most popular trends in digital marketing has been growth hacking and it involves a set of experiments across multiple marketing areas including product development and management, service orientation, funnel tactics, segmentation, etc., which helps marketers breach into the next levels of user engagement. The key difference between digital marketing and growth hacking is that while digital marketing focuses on broad goals across the funnel, growth hacking involves defining specific and highly achievable tactics (often with much smaller investments) across each funnel stage to attain its growth targets. A few growth hacking examples (as shared by world’s leading experimentation platform Optimizely) include generating automated notification emails and super-simple sign-up forms or sign-up driven homepages.
- Conversion Rate Optimization: The concept of conversion rate optimization (CRO) involves a combination of techniques aimed at understanding website visitor actions towards increasing conversions for specific goals including form-fillups, product buys, placing product-trial requests, etc. CRO has emerged as a widely deployed concept across the industry with multiple tools supporting across key areas like A/B Testing, Heat Maps review, Landing Page builders, etc., and the prominent among them include Instpage, VWO, Hotjar, Crazy Egg, Unbounce, etc.
- Programmatic Buying and Real-Time Bidding (RTB): With programmatic media buying on the rise (even impacting traditional media spend), there is a growing affinity towards algorithmic, especially Real-Time Bidding (RTB) spend, and E-marketer has estimated that by 2020, advertisers in the US will transact nearly $69 billion in US digital display ad spending programmatically, which accounts for 86.3 per cent of the digital display spending. With this, programmatic publishers will have a greater control over their data to get a more comprehensive view of their investments and efforts. With increase in targeting abilities, brands would also need to make sure they are able to measure metrics appropriately through programmatic buying.
- Responsive Design and Visual Storytelling: Responsive design is increasingly being adopted for marketing since it not only provides an intuitive and engaging interface for website visitors but also helps marketers integrate all of their content including service introduction, case experiences, testimonials, and insight documents in the form of a well-orchestrated story. Increased usage of HTML5, focus on video marketing, design simplicity, use of dominant colors, and quick upload times are also key aspects of responsive design, which are giving boost to marketers to improve storytelling.
- Marketing Automation: As per Salesforce “State of Marketing” Report (2017), 67 per cent of the marketing leaders currently use a marketing automation platform. The rising adoption of marketing automation tools is not just helping companies understand their audience data and buyer journey better but is also helping improve lead management and conversion rates. With marketing automation getting more streamlined, integrating data from multiple sources and moving towards mobile optimization will increasingly play a larger role in improving marketing effectiveness.
- Personalization and Micro Targeting: Personalized marketing involves using technology to target individuals at scale based on key buying segments, preferences, and prior behavior. With multiple marketing technologies now available to marketers, it is possible to identify and micro-target each customer persona with specific offers and call to actions for higher conversions. With improvements in personalization engines and improvement in data and predictive analytics, it is becoming easier to gather actionable insights, which tie online and offline information.
- Localization and Translation: With business increasingly going global and acquiring or merging companies with multi-cultural products, it is increasingly becoming crucial to localize and translate marketing offers and messages to make them most relevant to the target market. Increasing use of machine translation (MT) tools and availability of local data through mobile phone are helping companies position their brands across multiple cultures, thus serving language and geographical alterations along with providing solutions to customers in real-time and as close to their access points as possible.
Big Data and IoT—Data Technologies Impacting Marketing
With an understanding of the emerging digital marketing trends and concepts, in this and the ensuing three sections, we would look at the impact of three major concepts that have been shaping digital marketing and study them in more detail:
- Impact of Data Technologies—Big Data and Internet of Things (IoT)
- Impact of Business Segments—Small and Medium Business (SMB) and B2B Marketing
- Impact of Hyperlocal Targeting—Social Local and Mobile (SoLoMo Concept)
In this section, we will cover the impact of emerging data technologies like Big Data and IoT, and their impact on digital marketing.
Understanding Big Data
With the explosive growth in data in the past four–five years, the term Big Data has been used extensively to refer to the mix of structured and unstructured data which marketers have at their disposal to understand customer preferences, actions, and behavioral patterns, and helps them target customers and convert them more effectively. Big data as a concept is generally believed to include four Vs: volume, variety, velocity, and veracity, which are discussed below:
- Volume: It refers to the scale of data which is involved in any Big Data project and which makes it viable to derive meaningful references through analytics.
- Variety: It involves looking at the kind of data which could be structured as well as unstructured and how to make best sense from the total set. A key example of unstructured data would be the plethora of social data present across the internet in the form of short texts, videos, pictures, etc., from which meaning needs to be derived.
- Velocity: It refers to the frequency of data which needs to be processed in a particular timeframe. Typically, for Big Data to be applied to any practical problem, it should deal with the high velocity of incoming data streams which need to be managed.
- Veracity: It involves differentiation between good and bad data in terms of how trustful the source of data origination is and how much clean-up is required before it can be usefully deployed and analyzed.
The key areas where Big Data impacts and enhances marketing effectiveness includes:
- Persona development: Big data can be most useful to generate more accurate buyer personas as it can help track customers across their buying path.
- Web retargeting: With the help of extended data available on each unique customer, marketers can retarget them based on their web visits and cookie data.
- Measuring customer engagement: This involves understanding engagement and disengagement patterns for new and loyal customers to target products/services accordingly.
- Identifying conversion possibilities: Through deployment of multiple parameters, marketers can judge conversion possibilities with much more accuracy than before.
- Paid campaign analysis: Big data can help analyze whether specific paid campaigns would be worthwhile to invest along with their expected outcomes (through historical analysis).
Understanding Internet of Things (IoT)
In conjunction with Big Data, it is being increasingly realized that internet is not a stand alone entity and, if utilized to harness the power of everyday objects, can yield far better customer experiences and a smarter world, driven by analytics.
According to the Global Standards Initiative on Internet of Things (IoT-GSI), IoT has been defined as a global infrastructure for the information society, enabling advanced services by interconnecting (physical and virtual) things based on existing and evolving interoperable information and communication technologies. On the marketing side, Marketo defines IoT as “the interconnectivity of our digital devices that provides endless opportunities for brands to listen and respond to the needs of their customers—with the right message, at the right time, on the right device.”
A recap of the impact of IoT on digital marketing from top sites and digital marketing product companies across the internet yields the following advantages:
- IoT will provide highly actionable consumer data: At present, most marketers are only able to access and act upon data obtained from consumer interactions with digital media and marketing technologies. As amount of data available from connected devices, consumer wearables, and public–private digital platforms increases, marketers will be able to enrich present online–offline data sets with real-time interaction data and influence consumers in a highly targeted fashion.
- Marketers will use IoT devices to provide highly personalized consumer touch points: Presently, marketers are able to target consumers mostly through internet, mobile, and other offline media. With the inclusion of everyday devices like Smart TVs, interactive kitchen appliances, wearable devices, etc., marketers will be able to interact with the consumer using the digital device as an extension of its branding. For example, makers of a certain refrigerator brand are now able to gather a plethora of customer information on daily usage patterns, grocery buys, and food intake of the consumer, which they can use to position themselves as a consumer health-enhancing brand and share custom messages and experiences which they could never think of. A similar example is of various wearable devices (like Google Glass) which can not only provide day-to-day information to consumers on multiple areas, but also be used for digital commerce and contextual advertising to consumers when they need it most.
- IoT will help refine consumer personas and buying journeys in real time: One of the other big challenges of marketers is to tide over the attribution issue to understand the ever-changing online–offline buying journeys of multiple consumer micro-segments. With the help of the IoT ecosystem, marketers in the near future would be able to exactly understand and predict the real buying points of consumers, thus utilizing specific digital devices to sell closest to the consumer-buying moment. The most important consideration though will be the management of private data and how the ecosystem supports the sharing of this data across brands, devices, and platforms, keeping in mind that customer data needs to remain permission-based.
B2B and SMB—Segments-Based Digital Marketing
With digital marketing growing in stature and influence, its adoption has grown multi-fold, especially across two key segments—Business to Business (B2B) and the Small and Medium Business (SMB) categories. Let us look at how each of these two segments are adopting digital marketing.
Business-to-Business (B2B) Digital Marketing
With as high as 84 per cent B2B marketers planning to increase or maintain their digital marketing spend in the coming year (according to a study by Salesforce on 2015 state of B2B marketing), businesses have come a long way in terms of adoption of digital marketing for their B2B interactions. According to the report:
- Content marketing and marketing automation (66 per cent) are the top areas where B2B organizations will increase spending, followed closely by mobile applications and location-based tracking (65 per cent) and social media advertising/marketing (64 per cent).
- While CRM (57 per cent) is the most important tool for a seamless customer journey, the report shared that marketing analytics (54 per cent) and mobile applications (53 per cent) are also playing important roles in providing a robust buying experience.
- 70 per cent respondents stated that marketing automation was either an effective or very effective tool for digital marketing strategies. However, only 26 per cent respondents had a marketing automation tool implemented in their business, 31 per cent are either piloting a solution or planning to implement a marketing automation solution.
B2B Marketing, which runs one of the premier portals for B2B marketing, shared the key B2B marketing trends for 2015 as:
- Mobile will become significant for B2B web and brands will develop compelling and personalized experiences for their buyers on mobile platforms by investing in mobile-optimized elements, dynamic content, and fully functional mobile sites.
- Marketing automation will be high priority and B2B companies would rely on these real-time automation tools to target prospects with relevant and timely messages, as well as saving valuable time and resources.
- Content marketing would become a more measurable discipline for B2B where firms would assign more resources and look at improving RoI from their content activities. Integrating content marketing throughout all communication and PR channels, focusing on quality content, and integrating visuals into content strategies would become the norm for B2B firms.
- Predictive analytics would gain importance and would support marketers to make the most from the behavioral and real-time data which they have gathered over time. B2B firms will rely more on predictive scoring rather than the traditional lead scoring models to predict actual buying intent.
- Paid digital marketing will also become crucial for B2B firms and they would spend more on paid placements like sponsored posts and targeted ads on social media.
Small and Medium Businesses (SMBs) Digital Marketing
The definition of SMBs would vary based on the region and typical revenue figures in comparison to large companies. According to Gartner, companies which have either fewer than 100 employees or revenues less than $50 Mn are considered SMBs in the US, while Wikipedia gives the European definition of Small and Medium Enterprises (SMEs) as those which employ fewer than 250 persons and which have an annual turnover not exceeding €50 million.
In India, according to the Ministry of Micro, Small and Medium Enterprises (as shared in a Zinnov Research and Consulting Report), an SMB typically would have employee strength up to 1000 with revenues in the range of $ 0.2 to 1.5 Mn. Such is the increased adoption and importance of this segment for digital marketing that, Google India had set up a target to enable around 5 lakh SMBs in India, which earlier had been 3 lakh, to have an online presence by 2014. According to Google, digital advertising accounts for only 7 per cent of the total ad spend of Indian enterprises as compared to 30 per cent in the US, thus offering tremendous potential for them in the Indian market.
BrightLocal a firm which covers key SMB digital marketing trends, in its ‘SMB Internet Marketing Survey 2014’, showcased the following top six statistics for SMB firms:
- 37 per cent SMBs planned to spend more on internet marketing in 2015
- 32 per cent said internet marketing is ‘very effective’ at attracting customers
- 50 per cent SMBs spend less than $ 300/month on internet marketing
- 31 per cent phone calls are the most valued success metric
- 64 per cent of the SMBs surveyed handle their internet marketing in-house
- 35 per cent of SMBs are contacted every day by SEO agencies
Key digital marketing predictions for SMBs in2015 (Source: ReachLocal Blog) included:
- SMBs are incorporating technology and data in a broader manner with added advantages of cloud-based analytics tools which help them in executing digital marketing in a lean fashion to gather most accurate customer intelligence.
- Software with service elements help SMBs tide over traditional SaaS technology solutions. The do-it-yourself (DIY) model is failing organizations which actually require state-of-the art technology along with expert service.
- Mobile is becoming even more crucial to respond to changing consumer behavior patterns. The convenience of online ordering and in-app payments is going to differentiate SMBs who look to service their local clients most profitably.
- SMBs need to move to paid social model as they are seeing less impact of organic social efforts. Redirecting consumers to their owned media platform like website, blog, and e-mail newsletter would be crucial along with social media analytics.
- SMBs need to use multi-channel marketing and gain access to the multiple platforms having unified messaging. They would need to combine this effort with impactful content in a story-telling format for its highest effectiveness.
SoLoMo—the Next level of Hyperlocal Marketing
In this last section, we shall look at hyperlocal marketing or the SoLoMo concept, the third major concept impacting digital marketing. Hyperlocal marketing, by definition, involves targeting a highly specified local region based upon its cultural nuances and the key concerns of its population. With advancements in technology, it has become easier for marketers to keep defining narrower customer segments based on micro-regions and develop strategies and tactics to target them.
The concept of hyperlocal preceded the coinage of SoLoMo (Social, Local and Mobile). In terms of digital marketing, the hyperlocal concept began with Google providing the ability to marketers to target specific online audiences with advertising based on ‘Geo-Tags’ where specific geographic segmentation could be chosen. With mobile coming of age, the next level of hyperlocal segmentation came in where mobile GPS technology could be used to locate individuals within a certain area, and push messages and coupons in real time to individuals based on proximity.
Although marketers could target local customer segments through mobile, they were still not able to penetrate them until the concept of social platforms became popular. With the emergence and wider acceptance of social platforms like Facebook, FourSquare, Twitter, etc., consumers for the first time could exchange information among a known and trusted set of people to find quality restaurants, best branded items, most trusted hotels, etc. The addition of the social angle, thus, completed the trio of SoLoMo, which now provides the ability to mix the three elements of geography (location), personalization (mobile), and connections (social) to target any individual in a trusted manner, use specific marketing messages, and act upon them in real time. Apart from these three elements, the recent introductions of emerging tools like iBeacons, in-store, Wi-Fi, and mobile apps has also added incredibly to the usage and implementation of SoLoMo as a concept.
To realize the power of SoLoMo, we have to understand the technology behind it. The key difference between hyperlocal and SoLoMo technology is that hyperlocal targeting was IP based, wherein an advertisement, for instance on Google search engine, would target users based on their IP address. But this approach was not useful as IP addresses could not be trusted for accuracy and could not target a client in real time. Instead, mobile’s geofencing technology is far more advanced as it uses geo-location technology to target customers.
A geofencing technology is a virtual parameter for a particular area, which picks up a signal from a mobile device in any particular location and targets promotions and ads in real time. With consumers hooked on to mobile apps, this technology supports customer privacy concerns too, as it can be developed with permissions built-in to ask consumers if they want to opt in for offers from certain brands and retailers, thereby making the technology pull-based rather than a push-based intrusive model. Companies like Groupon, Yelp, and Starbucks have successfully implemented geofencing technologies in the form of apps.
Implementation of SoLoMo Marketing
With an understanding of the differences between hyperlocal and its next level SoLoMo, let us look at the key elements for implementation of each of the three concepts: Social, Local, and Mobile, and the impact they generate towards making SoLoMo relevant and usable.
- Social: With consumers trusting their social circles and through their networks gathering advice about a range of issues, beginning from the cat food they should buy to the next apartment they should invest in, social technology has become crucial for most purchase decisions across the world. With social commerce gathering steam, social media now accounts for almost 8 per cent of all traffic to retail websites (according to Experian). Brands are taking help of social sites to enable social sharing of their product and content to drive in-store sales through online social interactions.
With platforms like Facebook introducing tools like Facebook Graph, search marketers are getting even more interested as they are gaining a view into customer actions and interests, which is helping them design more intuitive experiences that can lead towards offline sale. Marketers can now use social media APIs to gather more information on their most popular posts, articles, pins, etc., thereby enabling them to target specific products through branded apps in real time, as soon as a customer steps inside their offline showroom.
- Mobile: With 82 per cent smartphone owners commenting that they always have their phones with them when they are in-store (according to Vibes Mobile Consumer Report), one can conclude that consumers use a mix of online–offline data to decide on most purchases, even while being within a store. With smartphone usage increasing by the day, and mobile user presence on internet rising phenomenally mobiles provide the perfect platform for data exploration.
Marketers who have developed interactive apps have the highest chance to gather product interaction and consumer engagement insights to use them later for targeting. With in-app advertising gaining traction and with the rise of wearables in different forms, new iterations and placement of mobile receptors are enabling marketers to push data to customers in ways not imagined before.
- Local: Finally, with localization being the key differentiator for SoLoMo concept, the rise of location-based services offers convenience to an individual to get the best offers for a particular product or brand with in a nearby location; this is the ultimate experience a consumer looks for.
With consumers utilizing their smartphones extensively during the buying cycle, looking for reviews on a particular product, checking availability, asking friends on their experiences of a particular store, it is imperative that localization will drive commerce in a huge way in the near future. In a country like India, where most of the population still prefers to buy offline but wants to check for the best offers online, SoLoMo needs to be perfected by upcoming digital marketers and brands to offer not only convenience, variety, and availability, but also combining them in forms most preferred by consumers.
CHAPTER SUMMARY
- Part 1: The first part began with an overview of the global digital marketing landscape where we looked at the global marketing spend by category, comparing the share of global advertising spend across all traditional and digital media types. Further, we looked at the break-up of global and digital advertising spend by format and the ad-spend share by industry. Next, we provided a conceptual understanding of the digital marketing landscape through the Hallam Digital Marketing Tube Map. In the last section we looked at Lumascapes and Chiefmartec’s Marketing Technology infographics which provided a well-classified view of the most prominent and emerging technology vendors in the advertising and marketing sectors.
- Part 2: In the second part, we focussed on Indian digital marketing statistics and studied the break-up of segment numbers India’s media and entertainment industry along with the share, size and future projections of digital business. We looked at the total media, digital, and mobile internet ad spending numbers in India followed by percentage-wise division of key digital advertising categories. Next, we studied key digital advertising trends in India which was followed by the last section on India’s digital marketing, advertising, and mobile tools landscape, which are used the most by Indian marketers.
- Part 3: In the final part, we looked at the top ten most impactful emerging trends and concepts in digital marketing which are impacting both dollar spend and technology adoption. We then covered the impact of three major concepts that have been shaping digital marketing including the impact of data technologies, business segments, and hyperlocal targeting. Each of these three impact areas were covered in three separate ensuing sections on Big Data and Internet of Things(IoT), Small and Medium business (SMB), and B2B marketing and Social, Local and Mobile (SoLoMo concept).
REVIEW QUESTIONS
- Mention a few key statistics of global marketing spending by category, as shared in the chapter.
- What are the key components of global digital ad spend by format?
- List the digital marketing stations as shared in the Hallam Digital Marketing Tube Map and describe a few of the stops they depict.
- Describe the key components of digital marketing technology/tools landscape, as discussed in the chapter.
- Provide an overview’s of India digital spend as per population/contribution to GDP.
- Describe key industry numbers of Indian media and entertainment industry.
- Share an overview of India’s digital advertising spend as per the details shared in the chapter.
- List key digital advertising trends in India and explain two of them in detail.
- Share an overview of India’s digital marketing/advertising/mobile commerce landscape as per your understanding from the chapter.
- List the ten most impactful digital marketing trends and describe three of them in detail.
- What do we understand by Big Data and its 4 Vs? Share three key areas where big data impacts and enhances marketing effectiveness.
- What is Internet of Things (IoT)? Explain three key advantages of IoT for marketing.
- Explain in your own words the concepts of segments-based digital marketing.
- Explain the concept of hyperlocal marketing and the key constituents of the SoLoMo coinage. What according to you is the key impact of the emerging SoLoMo concept on digital marketing?
DIGITAL APPLICATION EXERCISES
- Examine the 2016 Annual Report of Alphabet Inc (Google’s newly renamed parent company) to understand its key areas of operations and how revenues are apportioned among the same.
- Which two of the fourteen stations showcased in Hallam Digital Marketing Tube Map do you feel most interested in digital marketing and why?
- What according to you could be the reasons for the TV segment to have the highest revenue projections among all other media and entertainment segments in India (as per industry segment numbers shared in Fig. 10.12).
- Globally, print advertising revenues are dwindling, while in India they are still growing at a strong pace. What according to you are the reasons for it? Is it the rate of digital adoption, cultural differences in media consumption, or any other reason?
- Choose any two key digital advertising trends in India and cite examples that support such trends. What were your key observations during this exercise?
- Study the two primary quadrants in India Mobile Commerce Landscape 2014 (SVG Media) and share two different brands which should be a part of each of the two quadrants: Hyperlocal and City and Location-Independent.
- Which three of the top 10 digital marketing trends do you feel will make the most impact to marketers in the coming time and why?
- Choose any offline brand of your liking in India and give three applications of how Big Data can support digital marketing of the brand for higher revenues.