
Chapter 2: SRE Technical Practices – Deep Dive
Reliability is the most critical feature of a service or a system and should be aligned with business objectives. This alignment should be tracked constantly, meaning that the alignment needs measurement. Site reliability engineering (SRE) prescribes specific technical tools or practices that will help in measuring characteristics that define and track reliability. These tools are service-level agreements (SLAs), service-level objectives (SLOs), service-level indicators (SLIs), and error budgets.
SLAs represent an external agreement with customers about the reliability of a service. SLAs should have consequences if violated (that is, the service doesn't meet the reliability expectations), and the consequences are often monetary in nature. To ensure SLAs are never violated, it is important to set thresholds. Setting these thresholds ensures that an incident is caught and potentially addressed before repeated occurrences of similar or the same events breach the SLA. These thresholds are referred to as SLOs.
SLOs are specific numerical targets to define reliability of a system, and SLOs are measured using SLIs. SLIs are a quantitative measure of the level of service provided over a period. Error budgets are calculated based on SLOs (that are based on SLIs) and essentially are the inverse of availability, representing a quantifiable target as to how much a service can be unreliable. All these tools or technical practices need to work in tandem, and each one is dependent on the other. SRE uses these technical practices to maintain the balance between innovation and system reliability and thus achieve the eventual goal—build reliable software faster.
Chapter 1, DevOps, SRE, and Google Cloud Services for CI/CD, introduced SRE technical practices—SLAs, SLOs, SLIs, and error budgets. This chapter will deep dive into these technical practices. In this chapter, we're going to cover the following main topics:
- Defining SLAs
- Defining reliability expectations via SLOs
- Exploring SLIs
- Understanding error budgets
- Eliminating toil through automation
- Illustrating the impact of SLAs, SLOs, and error budgets relative to SLI
Defining SLAs
An SLA is a promise made to a user of a service to indicate that the availability and reliability of the service should meet a certain level of expectation. An SLA details a certain level of performance or expectation from the service.
Key jargon
There are certain components that go into defining which agreements can be considered as an SLA. These are referred to with specific jargon and are elaborated, as mentioned, in the following sections.
Service provider and service consumer
The party that represents the service provider and service consumer can differ based on the context and nature of the service. For a consumer-facing service such as video streaming or web browsing, a service consumer refers to the end user consuming the service and a service provider refers to the organization providing the service. On the other hand, for an enterprise-grade service such as a human resource (HR) planning system, a service consumer refers to the organization consuming the service and a service provider refers to the organization providing the service.
Service performance or expectations
An organization or end user consuming a service will have certain expectations in terms of service behavior, such as availability (or uptime), responsiveness, durability, and throughput.
Agreement – implicit or explicit
An agreement or contract can be either implicit or explicit in nature. An example of an implicit contract is a non-commercial service such as Google Search. Google has a goal to provide a fluid search experience to all its users but hasn't signed an explicit agreement with the end user. If Google misses its goal, then users will not have a good experience. A repeat of such incidents will impact Google's reputation, as users might prefer to use an alternate search engine.
An example of an explicit contract is a commercial service such as Netflix or a paid enterprise-grade service such as Workday. In such scenarios, legal agreements are written that include consequences in case the service expectations are not met. Common consequences include financial implications or service credits.
This concludes an introduction to key jargon with respect to SLAs. The next subsection elaborates on the blueprint for a well-defined SLA.
Blueprint for a well-defined SLA
Having a well-defined SLA is critical to its success. Here are some factors that could be used as a blueprint for a well-defined SLA:
- Involve the right parties: SLAs are usually written by people who are not directly tied to the implementation of the service and hence might result in promises that are difficult to measure. SLAs should be set between business and product owners. However, SRE recommends that before SLAs are set, product owners should work with development and SRE teams to identify the expectation threshold that can be delivered by the service. This ensures that product owners work closer with the implementation teams and know what's acceptable and what's not realistic from a service viewpoint.
- Expectations need to be measurable: Service expectations such as availability or reliability characteristics in terms of stability, responsiveness, and durability should be quantifiable and measurable. Service expectations should be monitored by configuring monitoring systems and tracking specific metrics, and alerting should be configured to trigger alerts in case the expectations are violated.
- Avoid ambiguity: The jargon used while defining SLAs can sometimes be ambiguous. For example, consider an SLA that promises a client-initiated incident to be resolved within X hours from the time it's reported. If the client or customer either provided the details long after the incident was first reported or never provided the details at all, then it is possible that the service provider will not be able to resolve the incident. In this situation, the SLA should clearly state the stipulations that qualify for not meeting the SLA, and such scenarios should be excluded. This provides a clearer approach.
SLIs drive SLOs, which inform SLAs
SLAs should focus on the minimum level of objectives a service should meet to keep customers happy. However, SLAs are strictly external targets and should not be used as internal targets by the implementation teams.
To ensure that SLAs are not violated, implementation teams should have target objectives that reflect user's expectations from the service. The target objectives from implementation teams are used as internal targets, and these are generally stricter than the external targets that were potentially set by product teams. The internal targets are referred to as SLOs and are used as a prioritization signal to balance release velocity and system reliability. These internal targets need to be specifically measured and quantified at a given point of time. The measurement should be done using specific indicators that reflects users' expectations, and such indicators are referred to as SLIs.
To summarize, for a service to perform reliably, the following criteria needs to be met:
- A specific condition should be met—represented by an SLI.
- The condition should be met for a specific period within a specific target range—represented by an SLO.
- If met, customers are happy, or else there will be consequences—represented by an SLA.
Let's look at a hypothetical example. Consider a requirement where a user's request/response time falls within a minimum time period. A latency metric can be used to represent the user's expectation. A sample SLA in this scenario can state that every customer will get a response within 1,000 milliseconds (ms). In this case, the SLO for this SLA must be stricter and can be set at 800 ms.
This completes the section on SLAs. We looked at the key constructs of an SLA, factors that could impact a well-defined SLA, and its impact on setting internal target objectives or SLOs, using specific indicators or SLIs that impact customer satisfaction. The next section transitions from an SLA to an SLO and its respective details.
Defining reliability expectations via SLOs
Service consumers (users) need a service to be reliable, and the reliability of the service can be captured by multiple characteristics such as availability, latency, freshness, throughput, coverage, and so on. From a user's perspective, a service is reliable if it meets their expectations. A critical goal of SRE is to measure everything in a quantitative manner. So, to measure, there is a need to represent user expectations quantitatively.
SRE recommends a specific technical practice called a SLO to specify a target level (numerical) to represent these expectations. Each service consumer can have a different expectation. These expectations should be measurable, and for that they should be quantifiable over a period. SLOs help to define a consistent level of user expectations where the measured user expectation should be either within the target level or should be within a range of values. In addition, SLOs are referred to as internal agreements and are often stricter than SLAs promised to the end users. This ensures that any potential issues are resolved before their repetitive occurrence results in violating the SLA.
SLOs are key to driving business decisions by providing a quantifiable way to balance release cadence of service features versus service reliability. This emphasis will be covered in the upcoming subsection.
SLOs drive business decisions
The need for revenue growth puts businesses under constant pressure to add new features and attract new users to their service. So, product managers usually dictate the requirement of these new features to development teams. Development teams build these requirements and hand them over to the operations team to stabilize. Development teams continue their focus on adding new features to a service rather than stabilizing existing ones. Operations teams tend to get overloaded since they are constantly firefighting to maintain the reliability of the existing service, in addition to rolling out new features. So, the most important question is: If reliability is a feature of a system, then how can you balance reliability along with the release of other features?
SLOs are the answer to how to maintain a balance between reliability and release velocity. SLOs allow us to define target levels for a reliable service. These target levels should be decided by all the stakeholders across an organization, including engineering teams (development and operations) and the product team. The agreed-upon target levels should reflect users' experiences while using the service. This allows monitoring systems to identify existing problems before users register complaints. SLOs should be treated more as a prioritization signal rather than an operational concern.
SLOs should be used as a primary driver for decision making. SLOs represent a common language for all reliability conversations that is based on actual metrics. This will allow a business to decide when to release new features versus when to continue their focus on the reliability of an existing service. It will also allow operations teams to have a streamlined set of goals, preventing ad-hoc actions to run the service, and eventually avoiding operational overload.
Operational overload is a term that describes the ongoing maintenance tasks that keep systems and services running at optimal performance. If a team is constantly interrupted by operations load and cannot make progress toward their key priorities, then the team is in a state of operational overload.
The main reason for a team to be in a state of operational overload is a lack of consensus on the level of reliability a service should support. This lack of consensus is apparent from development teams' focus on adding new features to a service rather than stabilizing existing ones.
SLOs must have strong backing from the executive team. In the case of missed SLO targets, there should be well-documented consequences that prioritize engineering efforts toward stabilizing the reliability of a service rather than working or releasing new features. SLOs are key to removing organization silos and create a sense of shared responsibility and ownership. SLOs drive incentives that organically invoke a thought process whereby developers start to care about service reliability and operators start to care about pushing new features out as quickly as possible. The recommended guidelines to set SLOs will be detailed in the upcoming subsection.
Setting SLOs – the guidelines
The journey or process to identify the right SLOs for a service is very complex. There are multiple aspects or guidelines that need to be considered. Each of these aspects is critical to set or define an SLO for a service.
The happiness test
SLO targets are always driven by quantifiable and measurable user expectations called SLIs. The happiness test is a good starting point to set SLO targets for a service. As per the test, the service should have target SLOs that barely meet the availability and reliability expectations of the users, as the following applies:
- If the service meets the target SLOs, then users are happy.
- If the service misses the target SLOs, then users are sad.
A target SLO for an average response time is defined as a range between 600 and 800 ms. If the average response time is less than 800 ms, then the service meets the target SLO, and users are happy. If the average response time is greater than 800 ms (even though it is less than stipulated in the SLA), then the service misses the target SLO and the users are sad. The following diagram illustrates an example where an SLA with respect to average response time for a request is set to 1,000 ms:
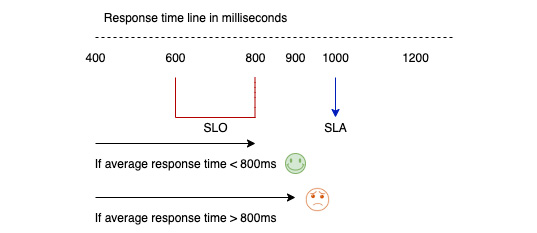
Figure 2.1 – Happy versus sad users based on target SLOs
100% reliability is the wrong target
Reliability is the most important feature of a service and reflects user happiness. However, setting 100% as the SLO or reliability target is not a realistic and reasonable goal for the following reasons:
- Unable to improve or add new features to the service: Maintaining customer happiness is tricky. Customers always look forward to new feature sets but also expect that the stability of the existing service will not be impacted. Adding new features to a running service can have the potential to introduce some amount of risk or unreliability. If SLO targets for a service are set to 100%, this implies that the service is always reliable, resulting in zero downtime. As a result, the service cannot tolerate any risk in terms of downtime, and inherently new features cannot be added to the service. If new features are not added to the service, users will be unhappy and will move to competitors that offers similar services with more feature sets.
- Technologically unfeasible: Running a service includes multiple components and dependencies. Some of these are internal, while some are external to the service. Though these components can be made redundant to achieve high availability, the dependencies result in complexities that would result in potential downtime. In addition, external components impact the availability of a service—for example, a mobile user cannot access a service if the mobile network provider has a dead zone at that specific location.
- Exponentially expensive: For every additional nine of reliability, the cost increases by 10 times. It's expensive to make a reliable system even more reliable. Being reliable enough is the wiser option.
Understanding reliability targets and their implications
As 100% is the wrong reliability target, it is important to find the optimal reliability target where the service is reliable enough for the user and there is an opportunity to update or add new features to the service.
Another perspective with which to look at reliability targets for a service is the amount of unreliability the service is willing to tolerate. Unreliability of the service is also referred to as the downtime.
Let's consider some reliability targets, as follows:
- A reliability target of 99.9% (also known as three nines of reliability) over a 30-day period will result in a maximum possible downtime of 42 minutes. This is enough time for a monitoring system to detect the issue, and is also enough time for a human to get involved and probably mitigate or resolve the issue.
- A reliability target of 99.99% (also known as four nines of reliability) over a 30-day period will result in a maximum possible downtime of 4.2 minutes. This is enough time for a monitoring system to detect the issue but is not enough time for a human to get involved, but probably enough time for a system to self-heal a complete outage.
- A reliability target of 99.999% (also known as five nines of reliability) over a 30-day period will result in a maximum possible downtime of 24 seconds. This extremely short duration is not enough to detect an issue or even attempt to self-heal.
The following table summarizes the possibility of detecting an issue and the possibility to self-heal based on a reliability target over a 30-day period:

To summarize, a reliability target should be set to a level that is realistic where an issue can be detected and addressed. An automated self-healing process is recommended over a human involvement—for example, redirecting traffic to a new availability zone (AZ) in case of an existing AZ failure.
Setting a reliability target too low means that issues could frequently occur, leading to large duration of downtimes, and customers will be impacted regularly. Setting a reliability target too high at 99.999% or even 100% means that the system cannot practically fail, and that makes it difficult to add new features to the service or application.
Setting SLOs is an iterative process
Reliability is the most important feature of a service, and setting SLOs allow monitoring systems to capture how the service is performing. When setting SLOs for the first time, it's possible to set SLOs based on past performance, taking an assumption that users are happy to start with. SLIs for these SLOs are based on existing monitoring systems and are considered as an initial baseline that must be met. Such SLOs are known as achievable SLOs, and any misses below the initial base line should result in directing engineering efforts to focus on getting reliability back to the initial baseline.
How to get started with setting achievable SLOs
Metrics to set achievable SLOs can either be taken from the load balancer or backfilled from the logs. Both approaches give an insight into historical performance.
If SLOs need to be set in the absence of historical data or if historical data does not accurately reflect users' expectations, it is recommended to set an achievable target and then refine the target to closely match users' expectations and business needs. Such SLOs are known as aspirational SLOs. Monitoring systems will then use these metrics to track these SLOs.
Once either achievable or aspirational SLOs are set, it's possible that new features are introduced to the service, but the probability for a service to be unreliable also increases. This can result in customers being unhappy even after meeting SLOs. This is an indication that monitoring metrics need to be revisited. SLOs need to be iteratively set and periodically re-evaluated. These metrics might have worked when originally set, but might not anymore.
Here are a few possible scenarios that call for SLOs to be re-evaluated:
- New features were not considered in the metric calculation.
- Service usage is now extended from desktop to mobile.
- Service usage is now extended to multiple geographies.
How frequently should SLOs be revisited or re-evaluated?
It's recommended that SLOs be revisited or re-evaluated every 6 to 12 months to ensure that defined SLOs continue to match business changes and users' expectations.
In addition to periodically revisiting SLOs, there are scenarios where a different SLO—more precisely, a tighter SLO—can be used when a spike in traffic is anticipated. For example, during holiday shopping, many businesses expect a significant spike in traffic, and in such scenarios, businesses can come up with a temporary strategy of tightening the SLO from 99.9% to 99.99%. This means system reliability is prioritized over a need or urge to release new features. The SLO targets are set back to their original value (in this example, back to 99.9%) when normal traffic resumes.
This completes the section on SLOs, with a deep insight into the need for reliability, setting reliability targets, and the way SLOs drive business decisions using SLIs. The next subsection introduces why SLOs need SLIs and is also a precursor before exploring SLIs in detail.
SLOs need SLIs
SLOs are specific numerical targets to define the reliability of a system. SLOs are also used as a prioritization signal to determine the balance between innovation and reliability. SLOs also help to differentiate happy and unhappy users. But the striking question is: How do we measure SLOs?
SLOs are measured using SLIs. These are defined as a quantifiable measure of service reliability and specifically give an indication on how well a service is performing at a given moment of time. Service consumers have certain expectations from a service and SLIs are tied directly to those expectations. Examples of quantifiable SLIs are latency, throughput, freshness, and correctness. SLIs are expressed as a percentage of good events across valid events. SLOs are SLI targets aggregated over a period.
We'll get into more details about SLIs in the next section, Exploring SLIs. This includes categorizing SLIs by types of user journeys and elaborating on the ways to measure SLIs.
Exploring SLIs
An SLI is a quantitative measure of the level of service provided with respect to some aspect of service reliability. Aspects of a service are directly dependent on potential user journeys, and each user journey can have a different set of SLIs. Once the SLIs are identified per user journey, the next critical step is to determine how to measure the SLI.
This section describes the details around how to identify the right measuring indicators or SLIs by categorizing user journeys, the equation to measure SLIs, and ways to measure SLIs.
Categorizing user journeys
The reliability of a service is based upon the user's perspective. If a service offers multiple features, each feature will involve a set of user interactions or a sequence of tasks. This sequence of tasks that is critical to the user's experience offered by the service is defined as a user journey.
Here are some examples of user journeys when using a video streaming service:
- Browsing titles under a specific category—for example, fiction
- Viewing an existing title from a user library
- Purchasing an on-demand show or a live stream
- Viewing a live stream
Each user journey can have a different expectation. These expectations can vary, from the speed at which the service responds to a user's request to the speed at which data is processed, to the freshness of the data displayed or to the durability at which data can be stored.
There could be a myriad user journeys across multiple services. For simplicity, user journeys can be classified into two popular categories, as follows:
- Request/response user journey
- Data processing/pipeline-based user journey
Each category defines specific characteristics. Each specific characteristic can represent an SLI type that defines the reliability of the service. These are specified in the following sections.
Request/response user journey
Availability, latency, and quality are the specific aspects or characteristics of SLIs that need to be evaluated as part of a request/response user journey.
Availability
Availability is defined as the proportion of valid requests served successfully. It's critical for a service to be available to meet user's expectations.
To convert an availability SLI definition into an implementation, a key choice that needs to be made is: How to categorize requests served as successful?
To categorize requests served as successful, error codes can be used to reflect users' experiences of the service—for example, searching a video title that doesn't exist should not result in a 500 series error code. However, being unable to execute a search to check if a video title is present or not, should result in a 500 series error code.
Latency
Latency is defined as the proportion of valid requests served faster than a threshold. It's an important indication of reliability when serving user-interactive requests. The system needs to respond within a timely fashion to consider it as interactive.
Latency for a given request is calculated as the time difference between when the timer starts and when the timer stops. To convert a latency SLI definition into an implementation, a key choice that need to be made is: How to determine a threshold to classify responses as fast enough?
To determine a threshold that classifies responses as fast enough, it's important to first identify the different categories of user interactions and set thresholds accordingly per category. There are three ways to bucketize user interactions, outlined as follows:
- Interactive—Refers to interactions where a user waits for the system to respond after clicking an element. Can also be referred to as reads, and a typical threshold is 1,000 ms.
- Write—Refers to user interactions that make a change to the underlying service. A typical threshold is 1,500 ms.
- Background—Refers to user interactions that are asynchronous in nature. A typical threshold is 5,000 ms.
Quality
Quality is defined as the proportion of valid requests served without degrading the service. It's an important indication on how a service can fail gracefully when its dependencies are unavailable.
To convert a quality SLI into an implementation, a key choice that needs to be made is: How to categorize if responses are served with degraded quality? To categorize responses served with degraded quality, consider a distributed system with multiple backend servers. If the incoming request is served by all backend services, then the request is processed without service degradations. However, if the incoming request is processed by all backend servers except one, then it indicates responses with degraded quality.
If a request is processed with service degradation, the response should be marked as degraded, or a counter should be used to increment the count of degraded responses. As a result, a quality SLI can be expressed as a ratio of bad events to total events instead of a ratio of good events to total events.
How to categorize a request as valid
To categorize a request as valid, different methodologies can be used. One such method is to use HyperText Transfer Protocol (HTTP) response codes. For example, 400 errors are client-side errors and should be discarded while measuring the reliability of the service. 500 errors are server-side errors and should be considered as failures from a service-reliability perspective.
Data processing/pipeline-based user journey
Freshness, correctness, coverage, and throughput are the specific aspects or characteristics of SLIs that need to be evaluated as part of a data processing/pipeline-based user journey. This is also applicable for batch-based jobs.
Freshness
Freshness is defined as the proportion of valid data updated more recently than a threshold. Freshness is an important indicator of reliability while processing a batch of data, as it is possible that the output might become less relevant over a period of time. This is primarily because new input data is generated, and if the data is not processed regularly or rebuilt to continuously process in small increments, then the system output will not effectively reflect the new input.
To convert a freshness SLI into an implementation, a key choice that needs be made is: When to start and stop the timer to measure the freshness of data? To categorize that the data processed is valid for SLI calculation, the correct source of input data or the right data processing pipeline job must be considered. For example, to calculate the freshness of weather-streaming content, data from a sports-streaming pipeline cannot be considered. This level of decision making can be achieved by implementing code and a rule-processing system to map the appropriate input source.
To determine when to start and stop times to measure the freshness of data, it is important to include timestamps while generating and processing data. In the case of a batch processing system, data is considered fresh if the next set of data is not processed and generated. In other words, freshness is the time elapsed since the last time the batch processing system completed.
In the case of an incremental streaming system, freshness refers to the age of the most recent record that has been fully processed. Serving stale data is a common way to degrade the response quality. Measuring stale data as degraded response quality is a useful strategy. If no user accesses the stale data, no expectations around the freshness of the data can have been missed. For this to be feasible, one option is to include a timestamp along with generating data. This allows the serving infrastructure to check the timestamp and accurately determine the freshness of the data.
Correctness
Correctness is defined as the proportion of valid data producing a correct output. It's an important indication of reliability whereby processing a batch of data results in the correct output. To convert a correctness SLI into an implementation of it, a key choice that needs to be made is: How to determine if the output records are correct?
To determine if the output records produced are correct, a common strategy is to use golden input data, also known as a set of input data that consistently produces the same output. This way, the produced output can be compared to the expected output from the golden input data.
Proactive testing practices—both manual and automated—are strongly recommended to determine correctness.
Coverage
Coverage is defined as the proportion of valid data processed successfully. It's an important indication of reliability, whereby the user expects that data will be processed and outputs will subsequently also be available.
To convert a coverage SLI into an implementation, the choice that needs to be made is: How to determine that a specific piece of data was processed successfully? The logic to determine if a specific piece of data was processed successfully should be built into the service, and the service should also track the counts of success and failure.
The challenge comes when a certain set of records that were supposed to be processed are skipped. The proportion of the records that are not skipped can be known by identifying the total number of records that should be processed.
Throughput
Throughput is defined as the proportion of time where the data processing rate is faster than a threshold. It's an important indicator of reliability of a data processing system, whereby it accurately represents user happiness and operates continuously on streams or small batches of data.
To convert a throughput SLI into an implementation, a key choice that needs to be made is: What is the unit of measurement for data processing? The most common unit of measurement for data processing is bytes per second (B/s).
It is not necessary that all sets of inputs have the same throughput rate. Some inputs need to be processed faster and hence require higher throughput, while some inputs are typically queued and can be processed later.
SLIs recommended for a data storage-based user journey
Systems processing data can also be further classified into systems responsible for only storing data. So, a data storage user-based journey is another possible classification of a user journey where availability, durability, and end-to-end latency are additional recommended SLIs. Availability refers to data that could be accessed on demand from a storage system. Durability refers to the proportions of records written that could be successfully read from a storage system as and when required at that moment. End-to-end latency refers to the time taken to process a data request, from ingestion to completion.
The following table summarizes specific characteristics to represent an SLI type, grouped by the type of user journey:

Given that there is a wide choice of SLIs to select from, Google recommends the following specific SLIs based on the type of systems:
- User-facing serving systems: Availability (Is it possible to respond to a request?), latency (How long will it take to respond?), and throughput (How many requests can be handled?)
- Storage systems: Latency (How long does it take to read or write data?), availability (Can the data be accessed on demand?), and durability (Is the data still available when there is a need?)
- Big data systems: Throughput (How much data can be processed?) and end-to-end latency (What is the time duration for data to progress from ingestion to completion?)
Given that we have looked at various factors that impact on determining SLIs specific to a user journey, the upcoming subsection will focus on the methodology and sources to measure SLIs.
SLI equation
An SLI equation is defined as the proportion of valid events that were good, as illustrated here:

This equation has the following properties:
- SLIs are expressed as a percentage and fall between 0% and 100%. 100% refers to everything working, and 0% refers to everything being broken.
- SLIs consistently translate to percentage reliability, SLOs, and error budgets, and are also key inputs to alerting logic.
- SLIs allow us to build common tooling to reflect the reliability of a service or system.
- Valid events are determined as follows: for requests related to HTTP Secure (HTTPS), valid events are determined based on request parameters or response handlers. Request parameters can include hostname or request path. For requests related to data processing systems, valid events refer to the selection of specific inputs that scope to a subset of data.
This completes our summary of SLI equation and its associated properties. The next subsection details various popular sources to measure SLIs.
Sources to measure SLIs
Identifying potential user journeys for a service is the first important step to identify SLIs. Once SLIs to measure are identified, the next key step is to measure the SLIs so that corresponding alerts can be put in place. The key question in this process is: How to measure and where to measure?
There are five popular sources or ways to measure SLIs, outlined as follows:
- Server-side logs
- Application server
- Frontend infrastructure
- Synthetic clients
- Telemetry
Server-side logs
Here are some details on how information from server-side logs can be used to measure SLIs:
- Logs capture multiple request-response interactions over a long-running session. Stored logs give an option to get insights into historical performance of the service.
- If starting out with setting SLOs (SLOs need SLIs), for a service, log data can be used to analyze historical events, reconstruct user interactions, and retroactively backfill the SLI information.
- Complex logic can be added to the code itself where good events are clearly identified, and the information is captured in logs. (This requires significant engineering efforts.)
Here are details of the limitations of using server-side logs to measure SLIs:
- If an SLI needs to be used to trigger an emergency response, the time between the event occurrence and the event actually being measured should be minimal. Given that logs need to be ingested and processed, capturing SLIs from logs will add significant latency.
- Log-based SLIs cannot capture the requests that did not make it to the application server.
Application server
Here are details on how information from the application server can be used to measure SLIs:
- Metrics captured at the application server are known as application-level metrics. These metrics are helpful in diagnosing issues with respect to the application.
- Application metrics can capture the performance of individual requests without measurement latency. In addition, these events could be aggregated over time.
Here are details of the limitations of using the application server to measure SLIs:
- Application metrics cannot capture complex multi-request user journeys.
- Application-based SLIs cannot capture requests that do not make it to the application server.
What is a complex multi-request user journey?
A complex multi-request user journey will include a sequence of requests, which is a core part of a user consuming a service such as searching a product, adding a product to a shopping cart, and completing a purchase. Application metrics cannot capture metrics for the user journey but can capture metrics related to individual steps.
Frontend infrastructure
Here are details of how information from frontend infrastructure can be used to measure SLIs:
- Frontend infrastructure refers to load balancers. This could be a vendor-based load balancer (such as F5) or a cloud-provider based load balancer (such as Google Cloud Load Balancer).
- Most of the distributed applications use a load balancer, and this is the first point of interaction for a user's request before it is sent to the actual application. This makes the load balancer the closest point to the user and fewer requests go unmeasured.
- Cloud providers typically capture multiple metrics for the incoming requests to the load balancer out of the box. This information might be readily available, including historical data too. If the capture of data was not configured for some reason, it can be easily configured. Either way, information will be available without investing engineering efforts (as compared to capturing metrics from application logs).
- Load balancers capture metrics related to requests that do not make it to the application server.
Here are details of the limitations of using a frontend infrastructure to measure SLIs:
- Load balancers can either be stateful or stateless. If stateless, then the load balancers cannot track user sessions and hence cannot be used to capture metrics tied to user interactions.
- Given that load balancers typically act as a traffic cop, routing user requests to application servers that are capable of handling the requests, load balancers do not inherently have control over the response data returned by the application. Instead, load balancers are dependent on the application to set the metadata accurately on the response envelope.
- The dependency on the application to set the right metadata on the response envelope is a conflict of interest because it is the same application that is generating the metrics.
Synthetic clients
Here are details of how information from synthetic clients can be used to measure SLIs:
- Synthetic clients provide synthetic monitoring, a monitoring technique that monitors the application by emulating or simulating user interactions based on a recorded set of transactions.
- Synthetic clients can emulate user interactions that constitute a user journey from a point outside the infrastructure, and hence can verify the responses.
Here are details of the limitations of using synthetic clients to measure SLIs:
- Synthetic clients simulate a user's behavior, and hence it's an approximation.
- Synthetic clients need complex integration tests that could cover multiple edge cases, thus resulting in a significant engineering effort.
- Synthetic clients need maintenance to add new user simulations if new user behavior patterns emerge that were not previously accounted for.
Telemetry
Telemetry refers to remote monitoring from multiple data sources and is not restricted to capture metrics related to application health, but can be extended to capture security analytics such as suspicious user activity, unusual database activity, and so on. Here are details of how information from telemetry can be used to measure SLIs:
- Instrumenting clients to implement telemetry metrics helps to measure the reliability of third-party integration systems such as a content delivery network (CDN).
- OpenTelemetry is the most popular instrumentation mechanism to capture traces and metrics. It replaces OpenTracing and OpenCensus, which were individually focused on capturing tracing and metrics respectively.
What is OpenTelemetry?
OpenTelemetry is a unified standard for service instrumentation. It provides a set of application programming interfaces (APIs)/libraries that are vendor-agnostic and standardizes how to collect and send data to compatible backends. OpenTelemetry is an open source project that is part of the Cloud Native Computing Foundation (CNCF).
Here are details of the limitations of using telemetry to measure SLIs:
- Ingesting metrics from different sources increases latency and will pose the same issues encountered when capturing metrics from processing logs, thus this is not a good fit for triggering emergency responses.
- If telemetry is implemented in-house, it requires a significant engineering effort. However, there are vendors that provide the same capability, but there is a risk of vendor lock-in.
This completes an elaboration of five different sources to measure SLIs. Given that each source has its own limitations, there is no best source to measure SLIs. In most cases, a combination of sources is always preferred. For example, if an organization is getting started with their SRE practice, usage of server-side logs to backfill SLIs and frontend infrastructure to readily use the metrics from the load balancer might be a good way to start. It can later be extended to capturing metrics from the application server, but given it doesn't support complex multi-request user journeys, an organization can later shift to the use of telemetry or synthetic clients based on their need. The next subsection summarizes a few SLI best practices as recommended by Google.
SLI best practices (Google-recommended)
It's a tedious task for an organization that would like to start on their SRE journey, and a key aspect of this journey is to identify, define, and measure SLIs. Here is a list of Google-recommended best practices:
- Prioritize user journeys: Select user journeys that reflect features offered by the service and the user's affinity to those features.
- Prioritize user journeys from the selected list: The user journey to purchase or watch a streaming event is more important than rating a video.
- Limit number of SLIs: Keep it to three to five SLIs per user journey. More SLIs will make it complex to manage for the operators.
- Collect data via frontend infrastructure: Collecting at load balancer level is closer to a user's experience and requires less engineering effort.
- Aggregate similar SLIs: Collect data over a period. Convert metric information captured into rate, average, or percentile.
- Keep it simple: Complex metrics require significant engineering effort but might also increase response time. If response time increases, then the metric will not be suitable for emergency situations.
This completes a comprehensive deep dive on SLIs, with a focus on categorizing user journeys, identifying specific aspects that impact a user journey, various sources to measure, and recommended best practices to define SLIs. To summarize, there are four critical steps for choosing SLI, listed as follows:
- Choose an SLI specification based on a suitable user journey.
- Refine a specification into a detailed SLI implementation.
- Walk through the user journey and identify implementation gaps.
- Set aspirational SLO targets based on business needs.
The upcoming section focusses on error budgets, which are used to achieve reliability by maintaining a balance with release velocity.
Understanding error budgets
Once SLOs are set based on SLIs specific to user journeys that define system availability and reliability by quantifying users' expectations, it is important to understand how unreliable the service is allowed to be. This acceptable level of unreliability or unavailability is called an error budget.
The unavailability or unreliability of a service can be caused due to several reasons, such as planned maintenance, hardware failure, network failures, bad fixes, and new issues introduced while introducing new features.
Error budgets put a quantifiable target on the amount of unreliability that could be tracked. They create a common incentive between development and operations teams. This target is used to balance the urge to push new features (thereby adding innovation to the service) against ensuring service reliability.
An error budget is basically the inverse of availability, and it tells us how unreliable your service is allowed to be. If your SLO says that 99.9% of requests should be successful in a given quarter, your error budget allows 0.1% of requests to fail. This unavailability can be generated because of bad pushes by the product teams, planned maintenance, hardware failures, and other issues:

Here's an example. If SLO says that 99.9% of requests should be successful in a given quarter, then 0.1% is the error budget.
Let's calculate the error budget, as follows:
If SLO = 99.9%, then error budget = 0.1% = 0.001
Allowed downtime per month = 0.001 * 30 days/month * 24 hours/day * 60 minutes/hour = 43.2 minutes/month
This introduces the concept of an error budget. The next subsection introduces the concept of an error budget policy and details the need for executive buy-in with respect to complying with the error budget policy.
Error budget policy and the need for executive buy-in
If reliability is the most important feature of a system, an error budget policy represents how a business balances reliability against other features. Such a policy helps a business to take appropriate actions when the reliability of the service is at stake. The key to defining an error budget policy is to actually decide the SLO for the service. If the service is missing SLO targets, which means the error budget policy is violated, then there should be consequences. These consequences should be enforced by generating executive buy-in. Operations teams should have an influence on the impact of the development team's practices by halting the release of new features if the service is getting very close to exhausting the error budget or has exceeded the error budget.
Error budgets can be thought of as funds that are meant to be spent across a given time period. These funds can be spent on releasing new features, rolling out software updates, or managing incidents. An error budget is basically the inverse of availability, and it tells us how unreliable your service is allowed to be. If your SLO says that 99.9% of requests should be successful in a given quarter, your error budget allows 0.1% of requests to fail. This unavailability can be generated because of bad pushes by the product teams, planned maintenance, hardware failures, and so on. The next subsection lists out the characteristics of an effective error budget policy.
Characteristics of an effective error budget policy
An error budget policy should have the following characteristics:
- An overview of the service
- A list of intended goals
- A list of non-goals; also referred to as a potential requirement that has been specifically excluded
- A list of DOs and DON'Ts based on whether a service performs above its SLO or misses its SLO
- A list of consequences when a service misses its SLO
- A detailed outage policy that defines the criteria to call out an incident and a need for a follow-up to ensure the incident doesn't happen again
- A clearly laid-out escalation policy that identifies the decision maker in the event of a disagreement
The preceding list of characteristics clearly calls out the fact that it is extremely necessary to have well-documented SLOs to define an effective error budget policy. This will be discussed in the next subsection.
Error budgets need well-documented SLOs
The key to defining an error budget is to actually to decide the SLOs for the service. SLOs clearly differentiate between reliable services and unreliable services, thus extending it to identify happy versus unhappy users. SLOs should be clearly defined without any ambiguity and should be agreed by product owners, developers, SREs, and executives.
In addition to implementing an SLO and configuring a monitoring system to alert on the SLO, the following characteristics are recommended for a well-documented SLO in terms of metadata:
- The need for an SLO and thought process behind the specific SLO target
- A list of owners for SLOs
- The impact in case of SLO miss
- SLIs tied with the SLOs
- Any specific events that are included or excluded from the calculation
- Version control of the SLO documentation (this gives an insight into reasons for changing SLOs as they get refined over a period)
The next subsection discusses multiple options to set error budgets.
Setting error budgets
Error budgets can be thought as funds that are meant to be spent across a given time period. These funds can be spent on releasing new features or rolling out software updates or managing incidents. But this raises several questions, such as the following:
- What is the right time to spend error budgets? At the start of the month or the end of the month?
- What happens if the error budget gets exhausted and there is an emergency?
- What happens if the error budget is not exhausted? Can it be carried over?
Different strategies can be used to determine the right time to spend error budgets within a time period. Let's assume the time period is 28 days. There could be three potential options, listed as follows:
- Option #1 is to spend a portion of the error budget at the start (of the 28 days) to push new features or updates and use the remaining error budget for potential reliability maintenance in the event of an incident.
- Option #2 is to spend an error budget to push new features or updates after elapsing half of the time period (say, 14 days), since it gives an idea on how much error budget was used in the first half for maintaining system reliability.
- Option #3 is to spend any remaining error budget toward the latter part of the time period in pushing new features or updates to ensure focus is on system reliability till then.
Any of the preceding options or a combination of the three can be used to define a dynamic release process, and it all depends on what developers and operations team agree upon based on current business needs and past performance. The dynamic release process can be implemented by setting alerts based on error budget exhaustion rates.
If the error budget of a service is exhausted but the development team needs to push a new feature as an exception scenario, SRE provisions this exception using silver bullets.
Envision silver bullets as tokens that could be given to the operations team to facilitate an exception to release new features when having exceeded the error budget. These tokens reside with a senior stakeholder and the development team needs to pitch the need to use silver bullets to the stakeholder. A fixed number of such tokens are given to the stakeholder and these are not carried over to the next time period. In addition to the use of silver bullets, SRE also recommends the use of rainy-day funds whereby a certain amount of the error budget is additionally provided to handle unexpected events.
Error budgets cannot be carried over to the next time period. So, in all practicality, the goal is to spend the error budget by the end of the time period. Constantly exhausting error budgets and repeated use of silver bullets should call for a review, where engineering efforts should be invested in making the service more reliable by improving the service code and by adding integration tests.
The use of dynamic release cadence, error budget exhaustion rates, silver bullets, and rainy-day funds are advanced techniques prescribed by SRE to manage error budgets. This completes the subsection on defining characteristics for an effective error budget policy, listing out characteristics for well-documented SLOs and discussing options to set error budgets. The next subsection details factors that are critical in ensuring that a service stays reliable and does not exhaust the error budget.
Making a service reliable
When a service exhausts its error budget or repeatedly comes close to exhausting the same, engineering teams should focus on making a service reliable. This raises the next obvious question: How can the engineering teams make a service more reliable to meet users' expectations?
To get deeper insights into this, it's critical to consider the following key factors essential to determine the potential impact on the service:
- Time to detect (TTD)—Defined as the difference in time from when the issue first occurred to the time that the issue was first observed or reported. Example: If an issue occurred at 10 a.m. but was reported or observed at 10:30 a.m., then the TTD in this scenario is 30 minutes.
- Time to resolve (TTR)—Defined as the difference in time from when the issue was first observed or reported to the time that the issues was resolved. Example: If an issue was first observed or reported at 10:30 a.m. but was resolved at 10:45 a.m., then the TTR in this scenario is 15 minutes.
- Time to fail (TTF)—Defined as how frequently the service is expected to fail. TTF is also known as Time Between Failures, or TBF.
- Impact %—Percentage of impact in terms of impacted users or impacted functional areas.
- The expected impact is proportional to the following expression:

Reliability can be improved by implementing the following options:
- Reducing detection time: Reduce TTD
- Reducing repair time: Reduce TTR
- Reduce impact %: Reduce the impacted users/functional areas
- Reduce frequency: Increasing TTF
- Operational improvement
Let's discuss each option in detail, next.
Reduce detection time (TTD)
TTD can be reduced by the following approaches:
- Add automated alerting that alerts a user rather than the user manually detecting an issue by noticing an abnormality from the metrics dashboard.
- Add monitoring to measure SLO compliance. This helps to know how quickly the error budget is being consumed or whether the service is performing within its target SLOs.
Reduce repair time (TTR)
TTR can be reduced by the following approaches:
- Develop a playbook that makes it easier to parse and collate server debug logs. This will help the onsite engineers to quickly address the problem at hand. If a new pattern was detected, then the playbook should be updated.
- Automate manual tasks such as increasing disk space to an acceptable percentage of current disk space, draining zone or rerouting traffic.
- Collect relevant information for a specific scenario, which will save time for the on-call team and will allow them to get a head start with their investigation.
Reduce impact %
Impact % can be reduced by the following approaches:
- Roll out a new feature to a limited number of users through a percentage-based rollout within a given amount of time. This reduces the impact percentage to that specific user group. The rollout percentage can be gradually increased from 0.1% of users to 1%, then later to 10%, and eventually 100%. In this way, the releases are staggered.
- Engineer a service to run in a degraded mode during a failure, such as switching to allow read-only actions and not writes, thus reducing the impact.
Reduce frequency
Frequency can be reduced by the following approaches:
- Run the service or application in multiple zones or regions. Direct the traffic away from the zone or region that failed to an alternate working zone or region.
- Create a self-healing automated script that reduces the impact and frequency, but also report the issue so that it can be addressed later.
Operational improvements
Here are some options from an operational standpoint to make a service reliable:
- Increase availability by adding redundancy and thereby remove single points of failure.
- Identify a common category between failures that can point to a specific region or a specific set of customers who consume a majority of the error budget.
- Standardize the infrastructure or minimize the differences to achieve similar results when testing a service against running it in production.
- Use design patterns that allow the service to be rolled back in case of an issue.
- Create alerts by tracking the error budget burndown rate.
- Use post-mortems to identify the issues at hand and create actionable items to fix those issues.
This completes a complete deep dive into potential factors that needs to be considered and feasible options that can be implemented to make a service reliable, thus not consuming the error budget. The next subsection summarizes the section on error budgets.
Summarizing error budgets
Error budgets can be summarized by the following key pointers:
- Error budgets help development and SRE teams balance release velocity and stability. Management buys into SLO and gives executive backing.
- Error budgets need SLOs, and SLOs need SLIs to monitor service reliability.
- The difference between the actual and targeted SLO is calculated to determine if it is below the error budget, and if so, the release of new features is allowed.
- If not, engineering efforts should be focused on the reliability of the service.
- An error budget policy is an effective way to implement the concepts of an error budget.
This completes the section on error budgets, with a deep dive into multiple aspects that include how to define an effective error budget policy, how to set error budgets, the impact of having an executive buy-in that helps to make a service reliable, and how to effectively balance the release velocity of new features.
Eliminating toil through automation
Toil was introduced in Chapter 1, DevOps, SRE, and Google Cloud Services for CI/CD, and is defined as the work tied to a production service where the characteristic of that work is manual, repetitive, automatable, tactical, lacks enduring value, and linearly grows with the service. Toil is often confused with overhead, but overhead refers to administrative work that includes email, commute, filing expense reports, and attending meetings. Toil can be both good and bad—it really depends on the amount of toil.
Here are some of the positive sides of performing toil, but in very short and limited amounts:
- Produces a sense of gratification or a sense of accomplishment
- Can act as a low-stress or low-risk activity
- Can be used to train new recruits, especially providing them a chance to learn by being hands-on with the system to learn the inner workings
However, excessive toil can lead to the following problems or issues:
- Career stagnation: Solving production issues is gratifying, but solving the same issue manually in a repetitive manner doesn't help from a career standpoint. This takes away learning time and intent away from the SRE engineer, leading to stagnation.
- Burnout and boredom: Excessive toil leads to burnout and boredom. An SRE engineer will be bored doing the same task every day. Sometimes, manual tasks might also be tedious and laborious, leading to burnout.
- Low feature velocity: If the SRE team is engaged in lot of toil, then they will have less time to work on releasing new features, thus leading to lower feature velocity and reduced release cadence.
- Wrong precedence: If the SRE team engages in more toil than required, it's possible that development teams will make SRE teams do further toil, especially on items that need to be addressed truly by the development team instead to remove the root cause. This will create confusion on the role of the SRE engineer.
All the aforementioned problems or issues can potentially lead to attrition, as SRE engineers might not be happy with their everyday work and might look elsewhere for better work and challenges. SRE recommends that toil should be bounded and that an SRE engineer should not work more than 50% of their time on toil. Anything more than 50% blurs the line between an SRE engineer and a system administrator. SRE engineers are recommended to spend the remaining 50% on supporting engineering teams in achieving reliability goals for the service.
Eliminating toil allows SRE engineers to add service features to improve the reliability and performance of the service. In addition, focus can continue to remain on removing toil as identified, thus clearing out a backlog of any manual repetitive work. SRE encourages the use of engineering concepts to remove manual work. This also allows SRE engineers to scale up and manage services better than a development or an operations team.
SRE recommends removing toil through automation. Automation provides consistency and eliminates the occurrence of oversights and mistakes. Automation helps to perform a task much faster than humans and can also be scheduled. Automation also ensures to prevent a problem before reoccurring. Automation is usually done through code, and this also provides a chance for SRE engineers to use engineering concepts to implement the required logic.
This concludes the section on toil: its characteristics, the good and bad aspects, and the advantages of using automation to eliminate toil. The next section illustrates how SLAs, SLOs, and error budgets are impacted based on SLI performance.
Illustrating the impact of SLAs, SLOs, and error budgets relative to SLI
In this section, we will go through two hands-on scenarios to illustrate how SLO targets are met or missed based on SLI performance over time. SLOs performance will have direct impact on SLAs and error budgets. Changes in the error budget will specifically dictate the priority between the release of new features versus service reliability. For ease of explanation, a 7-day period is taken as the measure of time (ideally, a 28-day period is preferred).
Scenario 1 – New service features introduced; features are reliable; SLO is met
Here are the expectations for this scenario:
- Expected SLA—95%
- Expected SLO—98%
- Measured SLI—Service availability or uptime
- Measure duration—7 days
Given that the anticipated SLO for service is 98%, here is how the allowed downtime or error budget is calculated (you can use this downtime calculator for reference: https://availability.sre.xyz):
- Error budget = 100% - SLO = 100% - 98% = 2%
- Allowed downtime for 7 days with 98% availability = 3.36 hours = 3.36 * 60 = 201.6 minutes
So, if total downtime across 7 days is less than 201.6 minutes, then the service is within SLO compliance of 98%, else the service is out of SLO compliance.
Now, let's illustrate how the SLO is impacted based on SLI measurements. Assume that new features are introduced for the service (across the 7-day period) and the features are stable, with minimal issues.
The following table represents the SLI measurements of availability, respective downtime based on SLI performance, and the reduction in error budget on a per-day basis:

The following screenshot represents the SLI performance for service uptime (top) and the error budget burndown rate (bottom) based on the values from the preceding table:
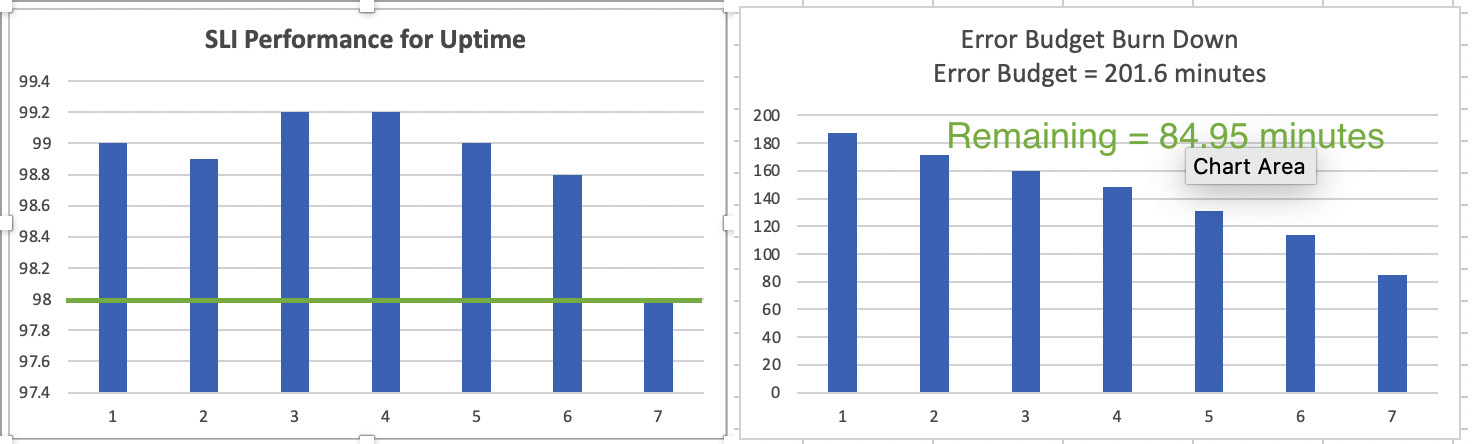
Figure 2.2 – Illustration of SLI performance and error budget burndown rate
Here are some critical observations:
- Remaining error budget = 84.95 minutes, which is less than 201.6 minutes. Hence, the SLO is in compliance and the SLA is met.
- The SLO performance can be calculated based on the remaining error budget. Since the remaining error budget is 84.95 minutes, then SLO performance is 99.25%.
- The introduction of new features did not unevenly or suddenly decrease the error budget.
This completes a detailed illustration of a scenario where the SLO is met based on the SLI performance over a 7-day period. The next scenario illustrates the opposite, where the SLO is missed based on SLI performance.
Scenario 2 – New features introduced; features are not reliable; SLO is not met
Here are the expectations for this scenario:
- Expected SLA—95%
- Expected SLO—98%
- Measured SLI—Service availability or uptime
- Measure duration—7 days
As calculated in Scenario 1, the allowed downtime for a 98% SLO is 201.6 minutes. So, the SLO is out of compliance if downtime is greater than 201.6 minutes over a 7-day period.
Now, let's illustrate how the SLO is impacted based on SLI measurements. Assume that new features are introduced for the service (across the 7-day period) but the introduced features are not stable, causing major issues resulting in longer downtimes.
The following table represents the SLI measurements of availability, respective downtime based on SLI performance, and the reduction in error budget on a per-day basis:

The following screenshot represents the SLI performance for service uptime (left-hand side) and the error budget burndown rate (right-hand side) based on the values from the preceding table:
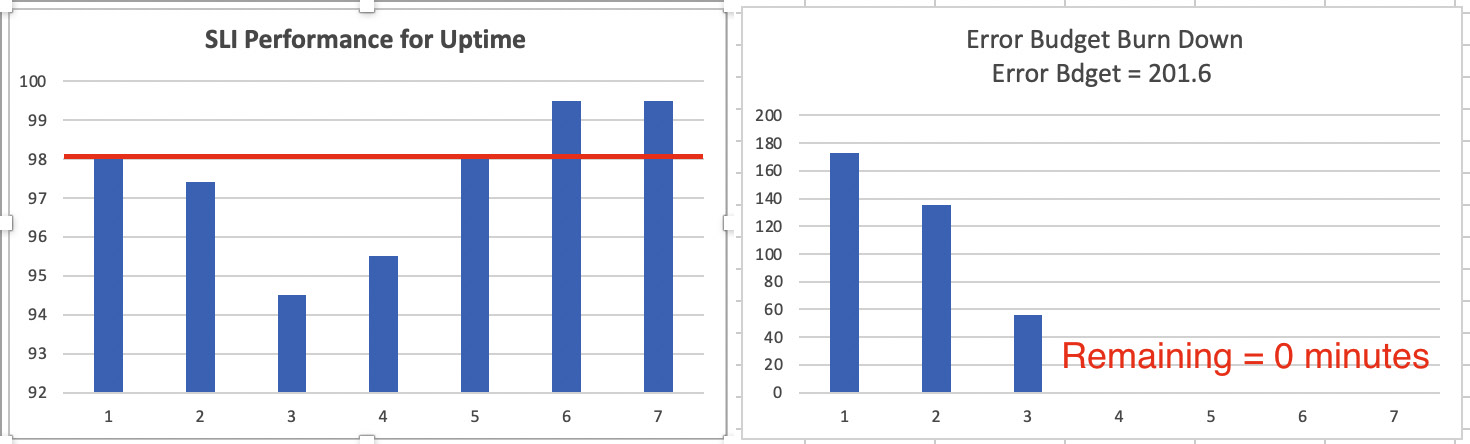
Figure 2.3 – Illustration of SLI performance and error budget burndown rate
Here are some critical observations:
- Remaining error budget = 0 minutes on day 4. So, the SLO is not in compliance.
- Total downtime across 7-day period is 253.44 minutes.
- The corresponding SLO performance is approximately at 97.48, which is below 98%.
- The SLA is violated since the SLO is not in compliance. This will result in consequences.
- The SRE team should not add new features after day 3 and instead focus on system reliability.
This brings an end to a detailed rundown of Scenario 2. This completes our illustration of how SLAs, SLOs, and error budgets are impacted based on SLI performance. This also means we have reached the end of this chapter.
Summary
In this chapter, we discussed in detail the key SRE technical practices: SLAs, SLOs, SLIs, error budgets, and eliminating toil. This included several critical concepts such as factors that can be used for a well-defined SLA, providing guidelines to set SLOs, categorizing user journeys, detailing sources to measure SLIs along with their limitations, elaborating on error budgets, detailing out factors that can make a service reliable, understanding toil's consequences, and elaborating on how automation is beneficial to eliminate toil. These concepts allow us to achieve SRE's core principle, which is to maintain the balance between innovation and system reliability and thus achieve the eventual goal: build reliable software faster.
In the next chapter, we will focus on concepts required to track SRE technical practices: monitoring, alerting, and time series. These concepts will include monitoring as a feedback loop, monitoring sources, monitoring strategies, monitoring types, alerting strategies, desirable characteristics of an alerting system, time-series structures, time-series cardinality, and metric types of time-series data.
Points to remember
Here are some important points to remember:
- 100% is an unrealistic reliability target.
- Log-based SLIs and ingesting telemetry adds latency.
- App metrics are not good for complex use journeys.
- SLOs must be set based on conversations with engineering and product teams.
- If there is no error budget left, the focus should be on reliability.
- TTD is the time taken to identify that an issue exists or is reported.
- TTR is the time taken to resolve an issue.
- To improve the reliability of a service, reduce TTD, reduce TTR, reduce impact %, and increase TTF/TBF.
- SLIs should have a predictable relationship with user happiness and should be aggregated over time.
- User expectations are strongly tied to past performance.
- Setting values for SLIs and SLOs should be an iterative process.
- Advanced techniques to manage error budgets are dynamic release cadence, setting up error budget exhaustion rates, rainy-day funds, and the use of silver bullets.
- Identify repetitive tasks that contribute to toil and automate them.
Further reading
For more information on Google Cloud Platform's (GCP's) approach toward DevOps, read the following articles:
- SRE: https://landing.google.com/sre/
- SRE fundamentals: https://cloud.google.com/blog/products/gcp/sre-fundamentals-slis-slas-and-slos
- SRE YouTube playlist: https://www.youtube.com/watch?v=uTEL8Ff1Zvk&list=PLIivdWyY5sqJrKl7D2u-gmis8h9K66qoj
Practice test
Answer the following questions:
- Which from the following indicates work that is not tied to a production service?
a) Toil
b) Manual
c) Overhead
d) Automation
- Which of the following represents an explicit or implicit contract with your users that includes consequences of meeting or missing the SLOs?
a) SLI
b) SLO
c) SLA
d) Error budget
- Which of the following combinations represent metrics that are typically tracked as part of a request/response journey?
a) Availability, latency, and durability
b) Latency, coverage, throughput, and availability
c) Coverage, correctness, and quality
d) Availability, latency, and quality
- Select an option that represents SRE recommendation in terms of the time that an SRE engineer is allowed to spend on toil:
a) 25%-55%
b) 45%-60%
c) 50%-75%
d) 30%-50%
- Which of the following is the least realistic (preferred) option to target reliability for a service as an SLO?
a) 99.9%
b) 99.99%
c) 99.999%
d) 100%
- In terms of best practice, which option is correct with respect to the number of SLIs recommended per user journey?
a) 2 to 3
b) No specific limit
c) 3 to 5
d) 5 to 7
- An e-commerce web application is processing customer purchases through requests and storing the sales transactions in a database. The goal is to ensure that the forecasted sales numbers are based on the latest sales numbers. Which of the following should be selected as SLIs for the e-commerce application (select two)?
a) Database—Availability.
b) Database—Durability.
c) Database—Freshness.
d) Web application—Availability.
e) Web application—Durability.
f) Both the database and web application should be available. Production apps should have full availability.
- Which out of the following represents a precise numerical target for system availability?
a) SLA
b) SLO
c) SLI
d) Error budget
- Which of the following represents a direct measurement of service behavior?
a) SLA
b) SLO
c) SLI
d) Error budget
- Which of the following is the best suitable source to backfill an SLI?
a) Application server
b) Frontend infrastructure
c) Synthetic clients
d) None of the above
Answers
- (c) Overhead.
- (c) SLA.
- (d) Availability, latency, and quality.
- (d) 30%-50%. The recommended amount of toil should not exceed 50%.
- (d) 100%.
- (c) 3 to 5.
- (a) and (d): Both the database and web application should be available as these are production applications.
- (b) SLO.
- (c) SLI.
- (d) None of the above. The exact answer is server-side logs.