
Chapter 3
The Evolution of Six Sigma, Lean Six Sigma and Green Six Sigma
‘Quality is not something you install like a new carpet. You implant it. Quality is something you work at. It is a learning process.’
– Edward Deming
3.1. Introduction
‘Today, depending on who you listen to, Six Sigma is either a revolution slashing trillions of dollars from corporate inefficiency, or it is the most maddening management fad yet devised to keep front-line workers too busy collecting data to do their jobs.’ (USA Today, 21 July 1998)
At the time of writing, it has been 23 years since the above statement was made. During this time the ‘Six Sigma revolution’ has created a huge impact in the field of operational excellence, yet conflicting views are still prevalent.
Let us evaluate the arguments for both sides. On a positive note, the success of ‘Six Sigma’ in General Electric under the leadership of Jack Welch is undisputed. In the GE company report of 2000, their CEO was unstinting in his praise: ‘Six Sigma has galvanized our company with an intensity the likes of which I have never seen in my 40 years of GE.’ Even financial analysts and investment bankers compliment the success of Six Sigma at GE. An analyst at Morgan Stanley, Dean Witter, recently estimated that GE's gross annual benefit from Six Sigma could reach 5% of sales and that share values might increase by between 10 and 15%.
However, the situation is more complex than such predictions would suggest. In spite of the demonstrated benefits of many improvement techniques, such as Total Quality Management, Business Process Re-Engineering and Six Sigma, most attempts by companies to use them have ended in failure (Easton and Jarrell, 1998). Sterman et al. (1997) conclude that firms have found it extremely difficult to sustain even initially successful process improvement initiatives. Yet more puzzling is the fact that successful improvement programmes have sometimes led to declining business performance, causing lay-offs and low employee morale. Motorola, the originator of Six Sigma, announced in 1998 that its second quarter profit was almost nonexistent and that consequently it was cutting 15,000 of its 150,000 jobs.
To counter heavyweight enthusiasts like Jack Welch (GE) and Larry Bossidy (Allied Signal), it must be said in the interests of balance that there are sharp critics of Six Sigma. In fact, while Six Sigma may sound new, its critics say that it is really just Statistical Process Control in fresh clothing. Others dismiss it as another transitory management fad that will soon pass.
It is evident that, like any good product, ‘Six Sigma’ should also have a finite life cycle. In addition, business managers can be forgiven if they are often confused by the grey areas of distinction between quality initiatives such as TQM, Six Sigma and Lean Sigma.
Against this background, let us examine the evolution of total quality improvement processes (or in a broader sense operational excellence) from ad-hoc upgrading, working up to TQM and then to Six Sigma and finally to Lean Sigma. Building on the success factors of these processes the vital question is: How do we sustain the results? The author has named this sustainable process FIT SIGMA™ (see Basu, 2011).
So, what is FIT SIGMA? Firstly, take the key ingredient of quality and then add accuracy in the order of 3.4 defects in 1,000,000. Now implement this across your business with an intensive education and training programme. The result is Six Sigma. Now let us look at Lean Enterprise, an updated version of classical industrial engineering. It focuses on delivered value from a customer's perspective and strives to eliminate all non-value-added activities (‘waste’) for each product or service along a value chain. The integration of the complementary approaches of Six Sigma and Lean Enterprise is known as Lean Sigma. FIT SIGMA is simply the next wave. If Lean Sigma provides agility and efficiency, then FIT SIGMA allows a sustainable fitness. In addition, the control of variation from the mean (small Sigma ‘σ’) in the Six Sigma process is transformed to company-wide integration (capital Sigma ‘Σ’) in the FIT SIGMA process. Furthermore, the philosophy of FIT SIGMA should ensure that it is indeed fit for the organisation.
The road map to FIT SIGMA (see Figure 3.1) contains three waves and it should be noted that the entry point of each organisation will vary:
- First Wave : As Is to TQM
- Second Wave : TQM to Lean Six Sigma
- Third Wave : Lean Six Sigma to FIT SIGMA and Green Six Sigma
3.2. First Wave: As Is to TQM
The organised division of labour to improve operations may have started with Adam Smith in 1776. However, it is often the Industrial Engineering approach, which has roots in F.W. Taylor's ‘Scientific Management’, that is credited with the formal initiation of the first wave of operational excellence. This industrial engineering approach was sharpened by operational research and complemented by operational tools such as management accounting.
During the years following the Second World War, the ‘first wave’ saw through the rapid growth of industrialisation, but in the short term the focus seemed to be upon both increasing volume and reducing the cost. In general, improvement processes were ‘ad-hoc’, factory centric and conducive to ‘pockets of excellence’. Then in the 1970s the holistic approach of Total Quality Management initiated the ‘second wave’ of operational excellence. The traditional factors of quality control and quality assurance are aimed at achieving an agreed and consistent level of quality. However, TQM goes far beyond mere conformity to standard. TQM is a company-wide programme and requires a culture in which every member of the organisation believes that not a single day should go by within that organisation without in some way improving the quality of its goods and services.
3.3. Second Wave: TQM to Lean Six Sigma
Learning the basics from W.E. Deming and J.M. Juran, Japanese companies extended and customised the integrated approach and culture of TQM (Basu and Wright, 1997; Oakland, 2003). Arguably the economic growth and manufacturing dominance of Japanese industries in the 1980s can be attributed to the successful application of TQM in Japan. The three fundamental tenets of Juran's TQM process are, firstly, upper management leadership of quality; secondly, continuous education on quality for all; and, finally, an annual plan for quality improvement and cost reduction. These foundations are still valid today and embedded within the Six Sigma/Lean Sigma philosophies. Philip Crosby and other leading TQM consultants incorporated customer focus and Deming's SPC tools and propagated the TQM philosophy both to the USA and the industrialised world. The Malcolm Baldridge Quality Award, ISO 9000 and the Deming Quality Award have enhanced the popularity of TQM throughout the world, while in Europe the EFQM (European Foundation of Quality Management) was formed. During the 1980s TQM seemed to be everywhere and some of its definitions such as ‘fitness for the purpose’, ‘quality is what the customer wants’ and ‘getting it right first time’ became so overused that they were almost clichés. Thus the impact of TQM began to diminish.
In order to complement the gaps to be found in TQM in specific areas of Operation Excellence, high profile consultants marketed mostly Japanese practices in the form of a host of three letter acronyms such as JIT, TPM, BPR and MRPII. Total Productive Maintenance (TPM) has demonstrated successes outside Japan by focusing on increasing the capacity of individual processes. TQM was the buzzword of the 1980s but it is viewed by many, especially in the US quality field, as an embarrassing failure – a quality concept that promised more than it could deliver. Philip Crosby pinpoints the cause of TQM ‘failures’ as ‘TQM never did anything to define quality, which is conformance to standards’. Perhaps the pendulum swung too far towards the concept of quality as ‘goodness’ and the employee culture. It was against this background that the scene for Six Sigma appeared to establish itself.
Six Sigma began back in 1985 when Bill Smith, an engineer at Motorola, came up with the idea of inserting hardnosed statistics into the blurred philosophy of quality. In statistical terms, Sigma (σ) is a measure of variation from the mean; thus the greater the value of Sigma, the fewer the defects. Most companies produce results that are at best around four Sigma or more than 6,000 defects. By contrast at the Six Sigma level, the expectation is only 3.4 defects per million as companies move towards attaining this far higher level of performance.
Although invented at Motorola, Six Sigma has been experimented with by Allied Signal and perfected at General Electric. Following the recent merger of these two companies, GE is truly the home of Six Sigma. During the last five years, Six Sigma has taken the quantum leap into operational excellence in many blue chip companies including DuPont, Raytheon, Ivensys, Marconi, Bombardier Shorts, Seagate Technology and GlaxoSmithKline.
The key success factors differentiating Six Sigma from TQM are:
- The emphasis on statistical science and measurement.
- A rigorous and structured training deployment plan (Champion, Master Black Belt, Black Belt and Green Belt).
- A project focused approach with a single set of problem-solving techniques such as DMAIC (Define, Measure, Analyse, Improve, Control).
- Reinforcement of the Juran tenets (Top management leadership, continuous education and annual savings plan).
Following their recent application in companies like GlaxoSmithKline, Raytheon, Ivensys and Seagate, the Six Sigma programmes have moved towards the Lean Sigma philosophy, which integrates Six Sigma with the complementary approach of Lean Enterprise. Lean focuses the company's resources and its suppliers on the delivered value from the customer's perspective. Lean Enterprise begins with Lean production, the concept of waste reduction developed from industrial engineering principles and refined by Toyota. It expands upon these principles to engage all support partners and customers along the value stream. Common goals to both Six Sigma and Lean Sigma are the elimination of waste and improvement of process capability. The industrial engineering tools of Lean Enterprise complement the science of the statistical processes of Six Sigma. It is the integration of these tools in Lean Sigma that provides an operational excellence methodology capable of addressing the entire value delivery system.
3.4. Third Wave: Lean Six Sigma to FIT SIGMA and Green Six Sigma
Lean Six Sigma is the beginning of the ‘third wave’ (see Figure 3.1). The predictable Six Sigma precisions combined with the speed and agility of Lean produces definitive solutions for better, faster and cheaper business processes. Through the systematic identification and eradication of non-value-added activities, optimum value flow is achieved, cycle times are reduced and defects eliminated.
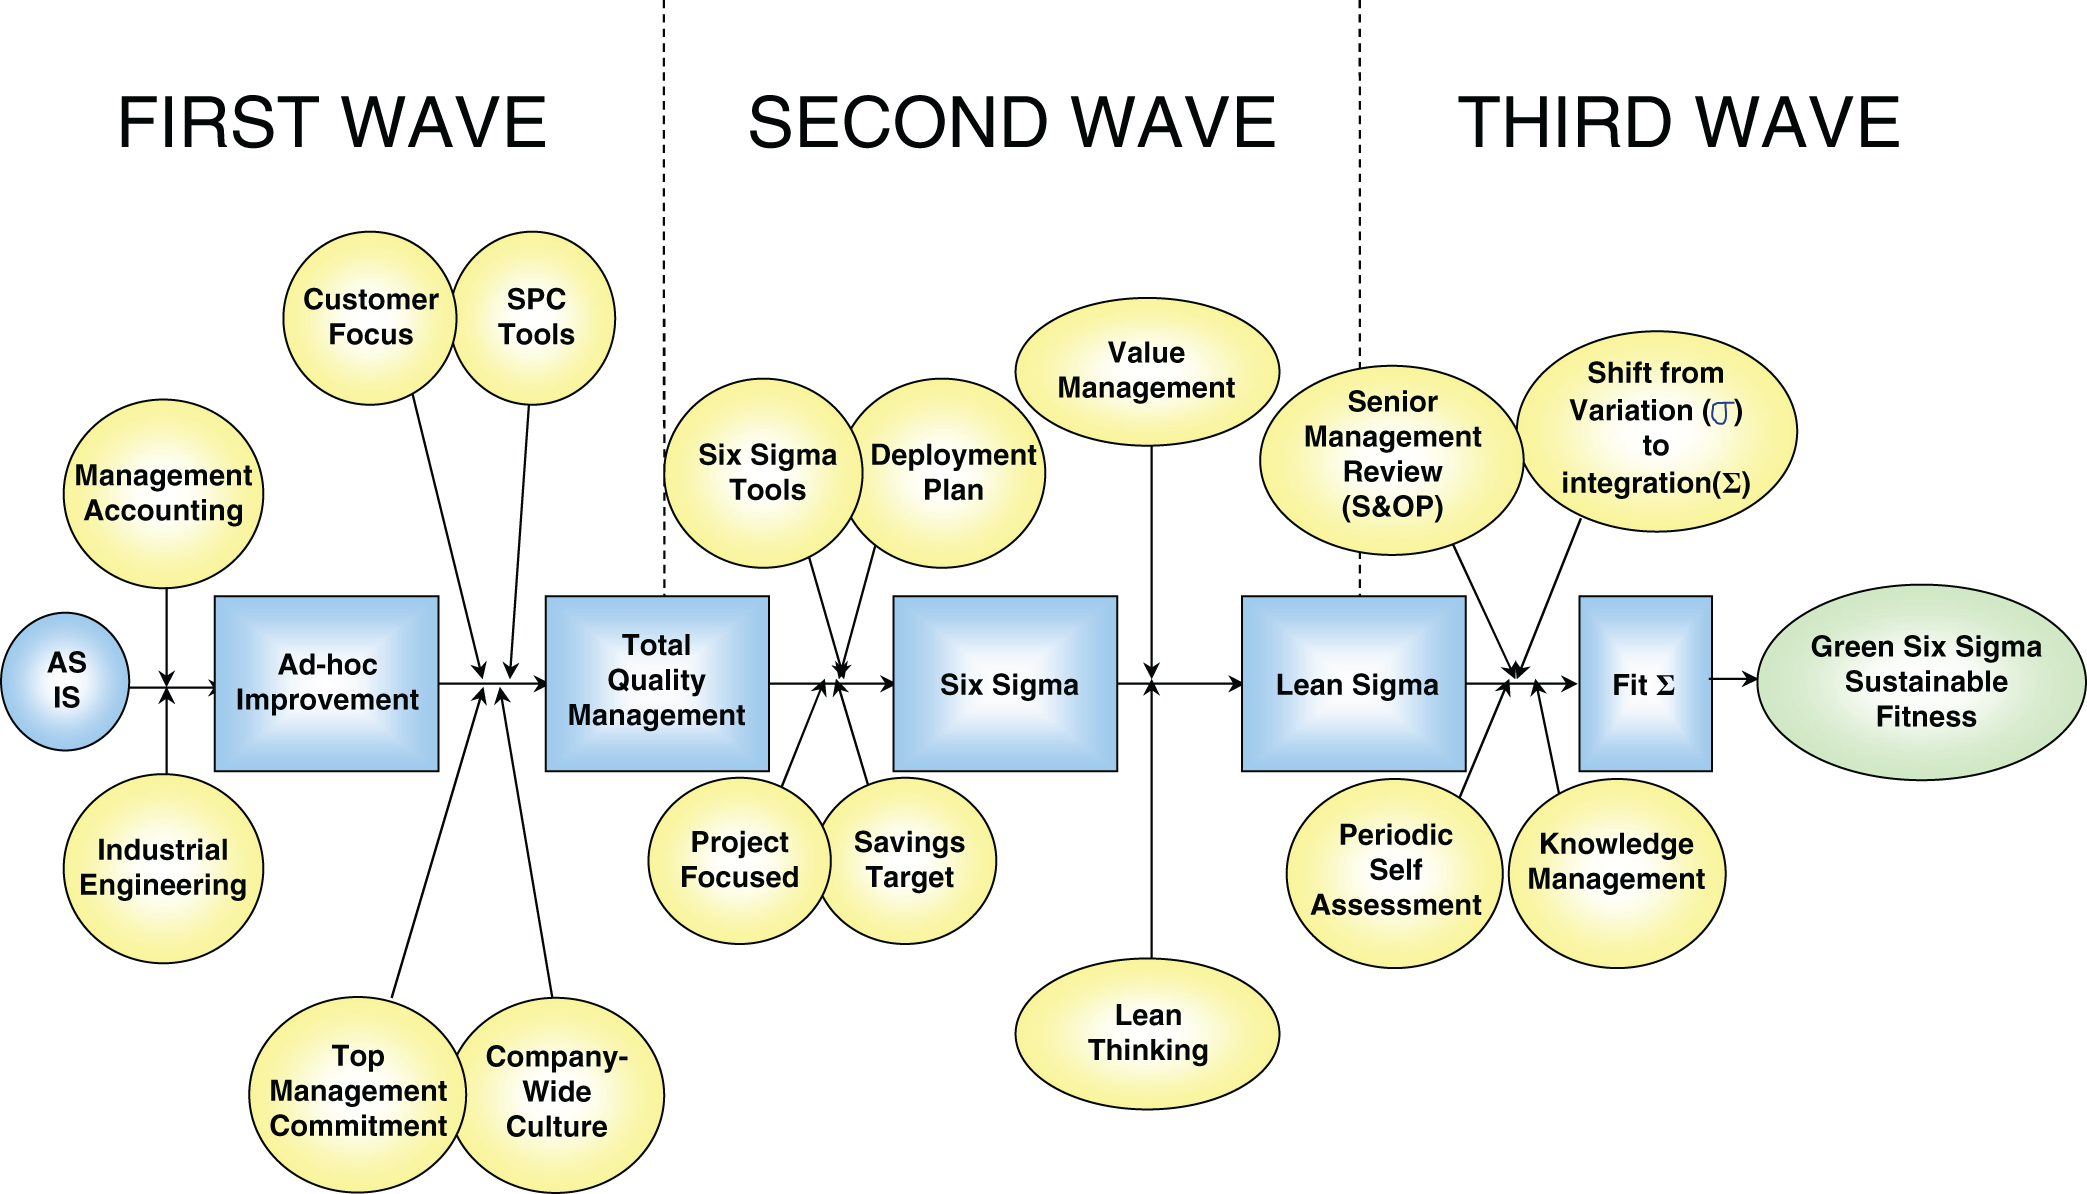
Figure 3.1 Road map to operational excellence© Ron Basu
The dramatic bottom line results and extensive training deployment of Six Sigma and Lean Sigma must be sustained with additional features for securing the longer-term competitive advantage of a company. The process to do just that is FIT SIGMA. The best practices of Six Sigma, Lean Sigma as well as other proven operational excellence best practices underpin the basic building blocks of FIT SIGMA.
Four additional features are embedded in the Lean Sigma philosophy to create FIT SIGMA. These are:
- A formal senior management review process at regular intervals, similar to the Sales and Operational Planning process.
- Periodic self-assessment with a structured checklist, which is formalised by a certification or award, similar to the EFQM award but with more emphasis on self-assessment.
- A continuous learning and knowledge management programme.
- The extension of the programme across the whole business with the shifting of the theme of the variation control (σ) of Six Sigma to the integration of a seamless organisation (Σ).
Green Six Sigma is an adaptation of Six Sigma, Lean Six Sigma and FIT SIGMA to the specific applications for climate change initiatives. A new feature of Green Six Sigma is the extension of DMAIC (Define, Measure, Analyse, Improve and Control) to DMAICS (Define, Measure, Analyse, Improve, Control and Sustain).
3.5. More About Six Sigma
Six Sigma is an approach that takes a whole system attitude to the improvement of quality and customer service so as to enhance the bottom line. The Six Sigma concept matured between 1985 and 1986 and grew out of various quality initiatives at Motorola. Like most such quality initiatives since the days of Dr Deming in the sixties and in particular the concept of Total Quality Management (TQM), Six Sigma requires a total culture throughout an organisation. This means that everyone at all levels should possess a passion for continuous improvement with the ultimate aim of achieving virtual perfection. The difference with Six Sigma is the setting of a performance level that equates to 3.4 defects per 1 million opportunities. To ascertain whether Six Sigma has been achieved requires a common language throughout the organisation (at all levels and within each function) and standardised, uniform measurement techniques of quality. The overall Six Sigma philosophy has a goal of total customer satisfaction.
A survey (Basu and Wright, 2003) was conducted with the following leading companies in the UK who had adopted the Six Sigma approach to quality:
- Motorola
- Allied Signal (Honeywell)
- General Electric
- Raytheon
- DuPont Teijn
- Bombadier Shorts
- Seagate Technology
- Foxboro (Invensys)
- Norando
- Ericson
The results indicated that the main driver leading to the application of Six Sigma within a company is cost savings rather than customer satisfaction! In coming to this conclusion the firms benefited from informal networking with members of the above companies as well as leading consulting groups such as Air Academy Associates, Rath and Strong, Price Waterhouse Cooper, Iomega and Cambridge Management Consulting. The surveyed companies reported between them a long list of intangible and indirect benefits. However, these plus points did not seem to be supported by any employee or customer surveys.
Nonetheless, very real results from the adoption of Six Sigma continue to be noted. For example, in 1997 Citibank undertook a Six Sigma initiative and after just three years it was reported that defects had reduced by ten times (see Erwin and Douglas, 2000, for details). Likewise, General Electric state that the initial $300 million invested in 1997 in Six Sigma will deliver between $400 million and $500 million savings with additional incremental margins of $100 to $200 million. Wipro Corporation in India says that from a start in 1999, after just two years defects were reduced to such an extent as to realise a gain of eight times over their initial investment in Six Sigma.
The application of operational excellence concepts are now extended to non-manufacturing processes. ‘Firms such as Motorola and General Electric … successfully implemented Six Sigma. Motorola saved $15 billion in an 11 year period. General Electric saved $2 billion in 1999 alone…. Although Six Sigma initiatives have focused primarily on improving the performance of manufacturing processes, the concepts are widely applied in non-manufacturing, administrative and service functions’ (Weinstein et al., 2008).
3.6. What Is Six Sigma?
So just what is the enigma of Six Sigma? Sigma is a classical Greek letter (σ) that is used in mathematical and statistical models to signify the standard deviation from the mean. This might sound like statistical mumbo jumbo, but in reality is a very simple concept. The mean (more correctly referred to as the arithmetic mean) is what most of us would call the average. For example, if a player in cricket batted 10 times and the total of his or her 10 scores is 650, then the average is 65 (even though s/he might have ‘scored’ nil on one occasion and 250 off another ball). This is because mathematically, each turn at bat contributes to the average. In statistical terms the arithmetic mean of the total score of 650 is 65, arrived at by dividing the total number of runs by the number of bats (650/10).
Table 3.1 Results of tossing 10 coins 100 times
| Number of heads | 0 | 1 | 2 | 3 | 4 | 5 | 6 | 7 | 8 | 9 | 10 |
| Frequency | 1 | 2 | 5 | 12 | 18 | 23 | 16 | 10 | 9 | 3 | 1 |
The next basic concept in statistics is frequency distribution. An often quoted example in statistical textbooks is the tossing of 10 coins 100 times. The result of each throw of the 10 coins could range from 10 heads and no tails, to 10 tails and no heads, or any combination in between, i.e. one head and nine tails, two heads and eight tails and so on. We would expect that if the coins are evenly balanced that we are more likely to have a probability of five heads and five tails than we are to get ten heads and no tails!
Table 3.1 shows the result of tossing 10 coins 100 times. This can be shown as a histogram as in Figure 3.2 and also as a distribution curve: see Figure 3.3.
The curve shown in Figure 3.3 is an example of a normal distribution curve. The curve is bell shaped (that is, it is symmetrical from the midpoint). Of course not all distributions will provide this outline, but under normal circumstances and given a large enough population, in our example concerning 100 throws of 10 coins, it is very likely that the distribution curve will be similar to that shown in Figure 3.2. The midpoint is shown on our curve as ‘x’. In statistical language, x represents the measure of central dispersion but in everyday English the term ‘midpoint’ indicates the same thing and is good enough for us!
If we assume a normal distribution curve as shown in Figure 3.3, one standard deviation from both sides of the midpoint (midpoint plus or minus one sigma) will include 68.27% of the total and two standard deviations (two sigma) from both sides of the midpoint will include 95.45% of the total. Thus three standard deviations (three sigma) will cover 99.73%. If we extend out to six standard deviations (six sigma) from each side of the midpoint, we cover 99.99966% of the total!
Now let us look at the quality program known as Six Sigma, our subject. Regarding this, we can observe that, for a process, the higher the Sigma the more the outputs of the process (be they products or services) and the closer they will be to always meeting the customer requirements. In other words, the higher the Sigma the fewer the defects. It should be noted that the higher multiple Sigma does not increase the ‘variation’, it only increases the area covered under the distribution curve. For example:

Figure 3.2 A histogram of tossing 10 coins
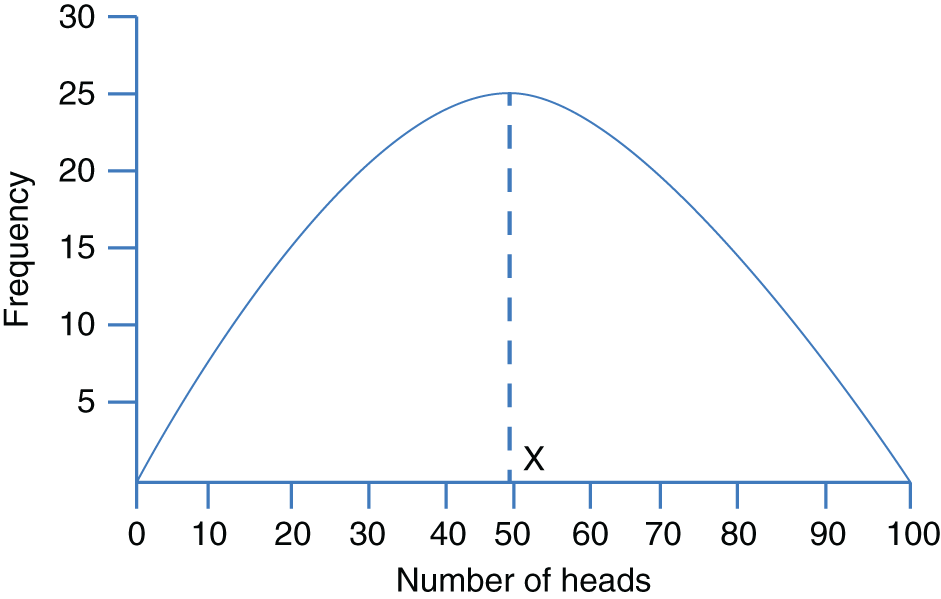
Figure 3.3 Normal distribution curve
- With one sigma, 68.27% of products or services will meet customer requirements and there will be 317,300 defects per million opportunities.
- Whereas with three sigma, 99.73% of products or services will meet customer requirements and there will be 2,700 defects per million opportunities.
- But, with Six Sigma, 99.99966% of products or services will meet customer requirements and there will be 3.4 defects per million opportunities.
- Thus, in effect, Six Sigma is a theoretical statistical measurement allowing the assessment of the quality of products and services to a position where there exist practically zero defects for any product or process in an organisation.
The key success factors differentiating Six Sigma from TQM are:
- Emphasis on statistical science and measurement.
- Structured training plans at different levels (Champion, Master Black Belt, Black Belt and Green Belt).
- Project focused approach with a single set of problem-solving techniques such as DMAIC (Define, Measure, Analyze, Improve and Control).
- Reinforcement of Juran's tenets such as top management leadership, continuous education and an annual savings plan.
- Effects quantified in tangible savings (as opposed to TQM where it was often said that we cannot measure the benefits, but if we did not have TQM who knows what losses might have occurred?).
This last point concerning the quantification of tangible savings is a major selling point for Six Sigma.
It is usually possible to measure the cost of poor quality (COPQ) with the sigma level at which the process consistently performs. The COPQ if the performance level is at Six Sigma will be less than 1% of cost of sales, whereas at three sigma (three sigma is regarded by many organisations as a very acceptable level of process quality) the corresponding COPQ will range from 25 to 30% of cost of sales. These figures are explained/justified later in this book.
3.7. The Structured Approach of Six Sigma
Following the rigorous application of Six Sigma in many organisations, including Motorola, Allied Signal, General Electric, Bombardier, ABB, American Express, Wipro, GSK and others, a proven structured approach has emerged for product and process improvement. This structured and hierarchical process is shown below:
| EXECUTIVE LEADERS/SPONSORS |
| MASTER BLACK BELTS (also known as Champions) Owners of Critical Projects |
| BLACK BELTS (also known as Experts) Change agents assigned to Masters to tackle critical projects |
| GREEN BELTS (also known as Agent Advocates) Grass root support to implement changes |
The top management must have a total commitment to the implementation of Six Sigma and accomplish the following tasks:
- Establish a Six Sigma leadership team.
- Develop and roll out a deployment plan for the training of Master Black Belts, Black Belts and Green Belts.
- Assign Master Black Belts to identify and own critical projects related to key business issues.
- Provide support for Black Belts to make breakthrough improvements in critical projects.
- Encourage Green Belts to identify and implement ‘just do it’ projects.
- Set aggressive Six Sigma Targets. This is done by the Six Sigma leadership team.
- Continuously evaluate the Six Sigma implementation and deployment programmes and make changes if necessary.
3.7.1. Six Sigma Deployment
A critical piece of successful Six Sigma experience is the Six Sigma Deployment Plan. A typical plan includes four parts.
- Business alignment planning.
- First wave of Black Belt training.
- Second wave (and subsequent waves as required) of Black and Green Belt training.
- Infrastructure development to deliver results and sustain culture.
Business alignment planning ensures that Six Sigma projects align with business strategy and drive results. Preliminary project selection criteria start with projects having potential substantial savings (1 million US dollars or more). During the leadership education programme, which usually lasts for five days, Master Black Belts are selected and Masters are assigned to key business issues and projects. Intensive Master Black Belt instruction takes three to four weeks. Concurrently, while the Masters are being trained, the selection process for those to be qualified as Black Belts is also carried out.
Master Black Belts (MBBs) have a thorough understanding of the improvement process, DMAIC, Six Sigma associated statistics and change management.
An MBB is competent to lead and manage significant end to end projects. They are also capable of coaching Green Belts.
Black Belt training is a combination of formal classroom education and onsite project work. Teaching is spread over four to five months, and includes four or five weeks of classroom work with the balance being onsite project experience.
Green Belts (GB) have an awareness of Six Sigma principles and in particular apply the DMAIC cycle to work with and support Black Belts in end-to-end projects. Green Belt training is usually distributed over six or perhaps seven weeks including five days of formal classroom work.
External consultants and experienced trainers are usually needed to manage and train the first deployment wave. For the second and third waves of the deployment plan, in-house Master Black Belts take charge of both the training and the management of specific projects.
3.8. Certification of Black Belts and Master Black Belts
The certification authority is the Six Sigma Academy. They have set standards and guidelines as follows:
Black Belts are awarded a certificate after completing:
- Three weeks of formal classroom Black Belt training.
- One week of change management and project management training.
- Completion, as a team leader, of an end-to-end $1 million Black Belt project.
- Demonstrated Six Sigma commitment evidenced by mentoring Green Belts and the preparation of Green Belt training material.
Master Black Belts are awarded a Masters certificate after:
- Black Belt certification.
- Completion of five end-to-end Black Belt projects as team leader.
- Delivery of three Green Belt training sessions.
- Demonstrated commitment to the Six Sigma philosophy through mentoring Black Belt and/or Green Belt projects.
- An example of a black belt training schedule is shown in Table 3.2.
Table 3.2 Sample of Black Belt training
| Week 1 | Week 2 | Week 3 | Week 4 |
|---|---|---|---|
| Define and measure Variation Data collection Basic statistics Cost of poor quality Define and measure tools | Analyse advanced statistics Analyse and SPC tools | Improve and control Generating improvement Change management Improve and control tools | Advanced statistical techniques Design of experiments Process capability Quality function deployment Multivariance analysis Design for Six Sigma |
3.9. What Is Lean Six Sigma?
Lean Six Sigma (also known as Lean Sigma) is the combination of two world class approaches (viz. Six Sigma and Lean Manufacturing) to organisational performance improvement. You have been introduced to Six Sigma in the preceding section. Let us now explain Lean Manufacturing and then show how these two approaches are combined in Lean Six Sigma.
The term ‘lean manufacturing’ was first employed by Womack and Jones in 1998 as a description of the way in which manufacturing was carried out at Toyota. Toyota called their manufacturing process the Toyota Production System (TPS). Ohno (1988), who is said to be the founder of the TPS system, noted that the basis of this TPS method is the elimination of waste. In order to achieve this, two pillars are used:
- Just in Time
- Automation with a human touch
‘Just in Time’ in a production means that the right parts reach the assembly line at the time they are needed and only in the amount required. The basic tool for achieving Just in Time is the Kanban system. ‘Automation with a human touch’ goes back to Sakichi Toyoda, the founder of Toyota, who invented the automatic loom. This loom would automatically stop if a thread broke, thereby preventing any work being carried out after the defect had occurred. According to Ohno (1988), an important part of the TPS system is the ability to prevent mistakes from happening again. This is achieved by solving the cause of the problem rather than the actual mistake. Examples of tools for problem solving and finding root causes of difficulties are Genshi Genbutso, which means going to the source to directly observe the problem, cause effect diagrams (also known as fish bone diagrams) and the ‘5 Whys’, or asking questions five times.
Ohno (1988) identified seven types of waste or ‘mudas’:
- Waste of overproduction
- Waste of time on hand (waiting)
- Waste in transportation
- Waste of processing itself (processing too much)
- Waste of stock on hand (inventory)
- Waste of movement
- Waste of making defective products
According to Ohno, the biggest source of waste is overproduction as it leads to many of the other types of squandering and misuse.
Liker (2004) has written several books about Toyota and he describes 14 management principles garnered from the company. Liker writes in his book that Lean is not just about implementing tools such as 5S and Just in Time. It also concerns applying a complete system of Lean Thinking and culture. This view is supported by Womack and Jones (1998) in a concept for Lean Thinking described as: ‘Lean Thinking is lean because it provides a way to do more and more with less and less’. Their five principles of Lean Thinking are Value, Value Stream, Flow, Pull and Perfection.
However, the application of Lean Thinking has moved with time and the experience of organisations in both the manufacturing and service sectors. Basu and Wright (2017) have extended Lean Thinking to supply chain management. The competition for gaining and retaining customers and market share is between supply chains rather than other functions of companies. A supply chain therefore has to be lean with four interrelated key characteristics or objectives:
- Elimination of waste
- Smooth operation flow
- High level of efficiency
- Quality assurance
3.9.1. Elimination of Waste
The lean methodology as laid out by Womack and Jones (1998) is sharply focused on the identification and elimination of ‘mudas’ or waste. Indeed, their first two principles (i.e. Value and Value Stream) are centered around the elimination of waste. Their motto has been ‘banish waste and create wealth in your organisation’. It starts with Value Stream Mapping to identify value and then pinpoints waste with the Process Mapping of valued processes, followed by systematically eliminating them. This emphasis on waste abolition has probably made ‘lean’ synonymous with the absence of waste. Waste reduction is often a good place to start in the overall effort to create a lean supply chain because it can often be achieved with little or no capital investment.
3.9.2. Smooth Operational Flow
The well-publicised Just in Time (JIT) approach is a key driver of a lean supply chain and, as we have indicated earlier, it requires materials and products to flow ‘like water’ from the supplier through the production process on to the customer. The capacity bottlenecks are eliminated, the process times of work stations are balanced and there are few buffer inventories between operations. Smooth operation flow requires the applications of appropriate approaches. Three of the most frequently applied methods are:
- Cellular manufacturing
- Kanban pull system
- Theory of constraints
In the cellular manufacturing concept, the traditional batch production area is transformed into flow line layouts so that ideally a single piece flows through the line at any time. In practice, an optimum batch size is calculated starting with the most critical work centers and the largest inventory carrying costs. Action is taken for improvement both at these work centres and concerning methods that have the greatest impact on the throughput, customer satisfaction, operating cost and inventory carrying charges. Secondly, Kanban (literally meaning ‘card’) is a way of pulling parts and products through the manufacturing or logistics sequence as needed. It is therefore sometimes referred to as the ‘pull system’. Finally, ‘the theory of constraints’ is a management philosophy developed by E.M. Goldratt (1999). It enables the managers of a system to achieve more of the goal that system is designed to produce. However, the concept or the objective is not new. Nonetheless, in service operations where it is often difficult to quantify the capacity constraint, the theory of constraints (TOC) could be very useful.
3.9.3. High Level of Efficiency
The more popular concepts of lean operations tend to be the principles of mudas, flow and the pull system. However, a preliminary analysis of all these methods, as we have described earlier, highlights the fact that all assume sufficient machine availability as a prerequisite. In our experience, for many companies attempting a lean transformation, this assumption is just not true. Machine availability depends on maximising the machine up time by eliminating the root causes of down time. The ratio of up time and planned operation time is the efficiency of the operation. Therefore, in order to make lean concepts work it is vital that the precondition of running the operations at a high level of efficiency should be met.
3.9.4. Quality Assurance
Womack and Jones (1998) propose ‘Perfection’ as the fifth Lean principle. According to this tenet, a lean manufacturer sets his/her targets for perfection in an incremental (Kaizen) path. The idea of Total Quality Management (TQM) also is to systematically and continuously remove the root causes of poor quality from the production processes so that the organisation as a whole and its products are kept moving towards perfection. This relentless pursuit of the faultless has to be a key attitude of an organisation that is ‘going for lean’.
3.10. More on Lean Six Sigma
If the objective of Six Sigma is the reduction of variation, then Lean Six Sigma aims to accomplish the mission of the organisation better, faster and cheaper. To put it another way, Lean Six Sigma combines the focus on efficiency by Lean and the emphasis on quality by Six Sigma. There is a tradeoff between quality (better), faster (delivery time) and cheaper (cost). The key is to leverage Lean Six Sigma to enable the organisation to get better, faster and cheaper – all at the same time. In general, Six Sigma is used to reduce defects and errors, thus making products or processes better. However, Six Sigma also reduces waste and streamlines processes like Lean. In fact, although Lean is primarily used to remove waste, in doing so it also reduces rework. When you reduce rework you also reduce defects. Therefore it is more sensible to combine the two methodologies of Lean and Six Sigma to make one approach of Lean Six Sigma. For example, consider a problem of lead time that varies between 20 and 12 weeks with an average of 16 weeks. With a Six Sigma approach it now fluctuates between 18 and 17 weeks with a mean value of 16 weeks. When Lean Six Sigma is applied the lead time is reduced to 10 weeks, varying between 11 and 9 weeks.
There appear to be two approaches of Lean Six Sigma (De Carlo, 2007). One is to follow the DMAIC methodology of Six Sigma, to focus on the business objective of value creation and to apply additional Lean tools such as Value Stream Mapping and Rapid Changeover. The second approach is centred on Kaizen Event (SCORE) rather than DMAIC. It is argued that the DMAIC process often takes longer when root causes are not known. On the other hand, you may employ a Kaizen event when the root causes are known (e.g. for cycle time reduction). This may follow a war-room-like environment for a short period (also called the Kaizen Blitz). However, a drawback of this process is that it may not bring the rigour of data-driven measurement and analysis of DMAIC. As shown in Table 3.3, although there are similarities between DMAIC and SCORE, the former is more related to project management and the latter is more linked to industrial engineering.
Table 3.3 DMAIC and SCORE
| Six Sigma (DMAIC) | Lean Kaizen (SCORE) |
|---|---|
| Define | Select |
| Measure | Clarify |
| Analyse | Organise |
| Improve | Run |
| Control | Evaluate |
3.11. Why FIT SIGMA?
We live in a competitive world. The pace of change is increasing and businesses and national economies are continuously being disrupted. In recent times the biggest external factors have been the collapse of banking and the finance market, causing job losses and a sharp decline of gross domestic products, followed by the Covid pandemic. We have also experienced the impact of the Internet and e-business. The spectacular rise in 1999 and fall in 2000 of so many so-called dot.com companies showed that without substance businesses are not sustainable. When the huge bubble bursts it is the innocent consumers who will feel the effect. Added to this, we need to factor in large scale mergers, and acquisitions are continuously taking place in all sectors of manufacturing and service industries.
Globalisation and the economic growth, particularly in China, are reshaping the economic power balance and consequent business strategies. We can conclude that change is here to stay, and it often comes quickly from unexpected quarters. The challenge for all businesses is to find the benefits of change with an appropriate value adding a change programme.
The failed dot.com companies of the last two decades and the more current problems of the banking industry have demonstrated that their early apparent success was not sustainable. There are similar stories of unsustainable improvements in traditional businesses in the ‘old economy’ (pre–e-business). In spite of the demonstrated benefits of many improvement techniques such as Total Quality Management, Business Process Re-engineering and Six Sigma/Lean Sigma, many attempts to implement and uphold improvements have fizzled out, not with a bang but with a whimper. What is more puzzling is that some companies (such as Motorola and Ford) who successfully implemented a quality initiative (such as Six Sigma) have subsequently experienced overall drops in business performance, resulting in layoffs and lower employee morale. Therefore we need a sustainable continuous improvement programme.
The well-publicised results of Six Sigma were first exhibited by Motorola, General Electric and Allied Signal and then by Ford and Dow Chemical. This created an image of Six Sigma as a process primarily for large manufacturing multinationals who can sanction a huge budget for consultants to train hundreds of Black Belts. In addition to the apparent misconceptions of high start-up costs and the process being only suitable for manufacturing, an aversion to sophisticated statistical techniques also discouraged the service sector and small and medium enterprises from applying Six Sigma. Therefore there is a need for a ‘fit for purpose’ improvement programme suitable for all types or sizes of organisations.
As described in the following chapters, the holistic and appropriate methodology of FIT SIGMA aim to address these gaps by focusing on three fundamentals:
- Fitness for purpose
- Fitness for integration
- Fitness for sustainability
3.12. What Is Green Six Sigma?
Green Six Sigma is the updated version of FIT SIGMA tailored to climate change initiatives. As explained further in the following chapters, Green Six Sigma includes three additional tenets over FIT SIGMA, which are:
- More emphasis on Lean and moving towards the circular economy.
- In addition to the sustainability of the process and performance there is the sustainability of the environment.
- Extension of DMAIC (Define, Measure, Analyse, Improve and Control) to DMAICS (Define, Measure, Analyse, Improve, Control and Sustain).
A circular economy is aimed at eliminating waste and the continual use of resources. The approach is to reuse resources, repair defects, refurbish facilities, rebuild products to original specifications, and recycle wastes to create a closed-loop system. The outcome is minimising the use of resource input, wastes, pollution and carbon emissions.
The measuring and monitoring of carbon emissions, carbon reduction and carbon offsetting is a major component of the sustainability of the environment. A carbon offset is a reduction in emissions of greenhouse gases made in order to compensate for emissions made elsewhere. The offsetting is done by planting trees or buying carbon offsets from emission trading companies. Carbon reduction is done by direct actions such as energy economy, changing the energy sources to renewables, reducing travel and reducing wastes.
3.13. Summary
Quality management has evolved over the years through various stages, from inspection to control to assurance to TQM. The new waves of Six Sigma, Lean Processes and FIT SIGMA are embedded in the holistic programmes of operational excellence. Our belief is that quality is not a new or separate discipline, but rather that it pervades all management actions. Our philosophy is that quality is too important to be left to the managers and that, in fact, quality is everybody's concern, not only in the organisation, but is also in the interest of customers and suppliers as well as any other stakeholder.
Quality has two main aspects. It can be measured from the customer's perspective – customer satisfaction – and it can be viewed from the standpoint of the efficient use of resources. These two seemingly separate objectives are in fact inseparable when quality is considered. An organisation that wishes to compete in the global market must be efficient and provide a high level of customer satisfaction. No organisation will be able to afford to provide a world class service unless its use of resources is efficient and non-value-adding activities have been minimized, and no organisation can afford not to be world class.
With the above logic and the application of a Six Sigma or Lean Sigma, practitioners should address both customer service and resource utilization in a cost-effective way. Quality has three dimensions – product quality, process quality and organisation quality (Basu, 2012). The results should also be sustainable and underpinned by people related organisation quality. Results should also be focused towards the sustainability of the environment of net-zero carbon emissions. As explained in the following chapters, this is where the value of Green Six Sigma lies.