
Chapter 1
Climate Change Challenges
‘What humans do over the next 50 years will determine the fate of all life on the planet.’
– David Attenborough
1.1. Introduction
‘Climate change’ as a scientific term may well sound quite tame and vernacular, and possibly does not convey a sufficient sense of urgency. It becomes confusing when scientists additionally talk about ice ages and other natural changes to the climate that have occurred throughout the history of our planet. The term ‘global warming’ has also been used as another phrase for the same thing, but, by contrast, this expression clearly imparts an unambiguous message concerning the imminent danger posed to humans and other living objects on earth.
What is beyond dispute is that the earth's temperature is rising, and even growth of two degrees centigrade would melt the ice sheets of the Polar Regions, resulting in a sea level increase of many metres. I have to admit that in the context of discussions regarding our future well-being I do prefer the term ‘global warming’. However, as ‘climate change’ is the official term being used by the United Nations (e.g. UNFCCC: United Nations Framework Convention of Climate Change and IPCC: Intergovernmental Panel of Climate Change), I shall also use this phrase primarily to express the impact of global warming.
The world is producing 51 Gigatons or 51 billion tons of greenhouse gases every year. These greenhouse gases include carbon dioxide (CO2), methane (CH4), nitrous oxide (N2O), water vapour (H2O) and ozone (O3), as shown in Table 1.1.
Carbon dioxide has been found to be the most important greenhouse gas related to global warming. It constitutes 82% of all greenhouse gases and stays in the atmosphere for a long time. Recent studies have shown that 75% of carbon will not disappear for a time calculated to be between centuries to thousands of years while the other 25% will stay with us forever. Methane causes many times more warming, molecule for molecule, than carbon dioxide when it reaches the atmosphere, but methane does not stay in the atmosphere as long as carbon dioxide. In addition, man-made (anthropogenic) activities are creating a serious global warming crisis that could last far longer than we ever thought possible – unless we act immediately.
Let us consider the basic principle involved here. A greenhouse is made of glass to allow sunlight to pass through and warm the air inside. The heat is trapped by the glass and the interior becomes warmer and warmer. We experience this so-called ‘greenhouse effect’ when our cars are parked in the sun and their interiors can become much hotter than the external temperature. Greenhouse gases work in a similar fashion but on a massive scale to increase the earth's temperature; hence this familiar term. Carbon dioxide, methane and other greenhouse gases stay in the atmosphere for a long time and trap the heat that would otherwise escape to the atmosphere, thus causing the earth's temperature to climb.
Table 1.1 Greenhouse gases
SOURCE: US EPA (2019).
| Greenhouse Gases | Percentages |
|---|---|
| Carbon dioxide | 82 |
| Methane | 10 |
| Nitrous oxide | 6 |
| Others | 2 |
Let us now examine how much the earth's temperature is rising and why this is causing serious concern.
As carbon dioxide commands the lion's share of greenhouse gases, the emission of all gases is expressed as a carbon dioxide equivalent (CO2 e).
1.2. The Earth's Temperature Is Rising
Greenhouse gas emissions, especially carbon dioxide, have increased gradually since 1840 and dramatically since 1950, as shown in Figure 1.1.
Sunlight passes through the thick layer of greenhouse gases without getting absorbed to reach the earth's surface and therefore warms up the planet. The earth radiates some of the heat energy back towards space and this hits the greenhouse gas molecules. This in turn makes the molecules vibrate faster, thus heating up the atmosphere. Only molecules of greenhouse gases, such as carbon dioxide, have the right structure to absorb radiation and thus to heat up the earth's temperature. Therefore, it is not surprising that the average global temperature since 1840 has also risen almost at the same rate as the increase of carbon dioxide (see Figure 1.2).
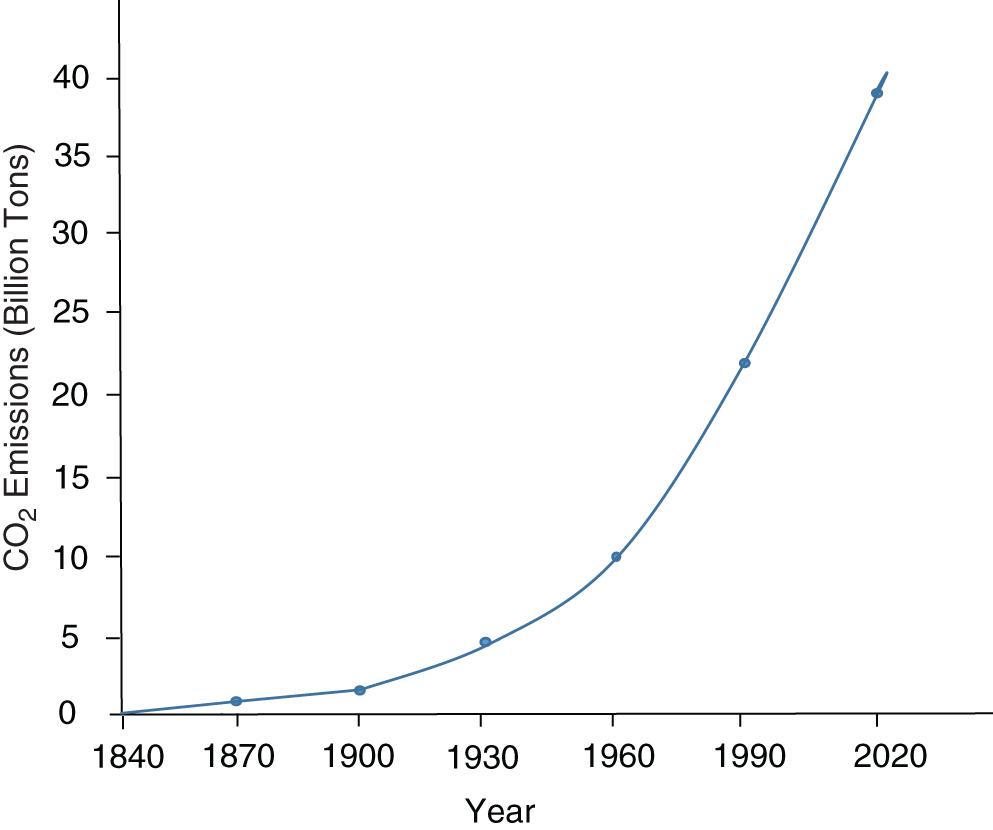
Figure 1.1 The rise of CO2 emissions since 1840
SOURCE: Global Carbon Project Report (2019).
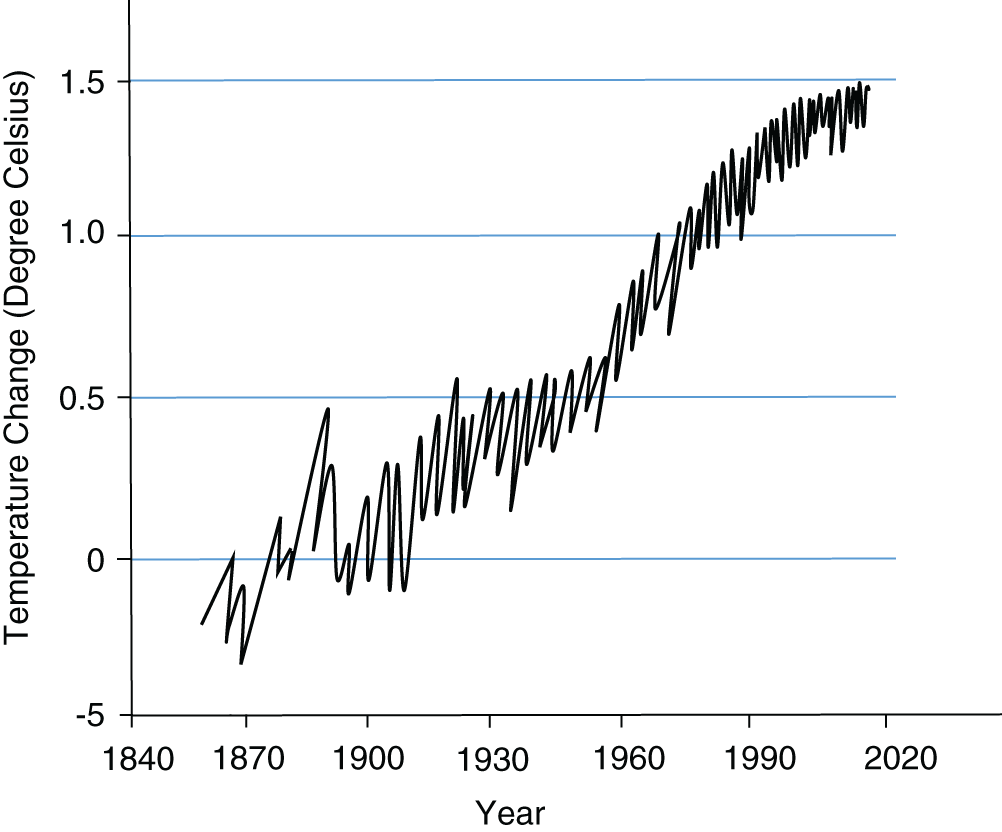
Figure 1.2 The rise of global temperatures since 1840
SOURCE: Global Carbon Project Report (2019).
The significant correlation between global temperatures and CO2 emissions is clearly visible in Figure 1.3.
Scientists acknowledge (IPCC, 2021) that there is uncertainty about how much or how quickly the temperature will increase and exactly what effect these higher figures will have. The jury is out regarding the accuracy of the numbers, but there is no doubt that the earth is warming and that this is occurring as a direct result of human activities.
Scientists are debating the direct impact of global warming. However, IPCC reports are clear that global warming is the major factor involved in causing the harmful effects of climate change. There is growing evidence that global warming is making storms wetter and the occurrence of severe cyclones more frequent. A hotter climate also means that there will be more frequent wildfires. An alarming effect of global warming is that sea levels will rise mainly because the polar icebergs are melting. Rising sea levels will be even worse for the poorer people in the world such as those living in Bangladesh and the Pacific Islands.

Figure 1.3 The rise of global temperatures and carbon dioxide emissions
SOURCE: Global Carbon Project Report (2019).
The potential impacts on plants and animals also make for very bleak reading. The prediction in IPCC reports is that a rise of two degrees centigrade could destroy the geographic range of animals by 8%, plants by 16% and insects by 18%. There were 7,300 major disasters in the 10 years between 2009 and 2019, resulting in 1.2 million deaths and wiping out $3 trillion (3.7%) from the global economy (IPCC, 2021). The scientific evidence would lead us to believe that, although the impact is gradual, at some point it will become catastrophic and irreversible. Even if the ‘best case’ scenario of that point is 50 years away, the inevitable conclusion from the data is that we must act now.
Let us start by exploring the root causes of global warming in more detail.
1.3. Greenhouse Gas Emissions by Country
The rate of greenhouse gas emissions from a country, especially carbon dioxide, depends upon many considerations. The two main factors are the generation and consumption of electricity and the population of the country. David Mackay of Cambridge University has produced a graph (Gates, 2021, page 6) which shows that the income per person of a country is proportional to the energy used per head. It was evident from the graph that richer countries (for example, the USA, Canada, Qatar) consume many times more energy per person than the poorer countries (such as Niger, Ethiopia, Haiti). Greater energy consumption means more carbon dioxide emissions. However, it is not the richer nations alone who are causing the higher emission rates of carbon dioxide. Standards of living are going up in emerging economies with a rising demand for energy, cars, buildings and refrigerators. In addition, the global population is also rising.
Figure 1.4 shows the emission rate over the last two decades for populous countries and regions. It is evident that emissions from advanced economies like the USA and European Union have stayed fairly flat, but if we look at emerging economies, especially China, they are growing rapidly. Of course, undoubtedly it is good news that people are improving their standards of living thanks to globalisation, but the unfortunate consequence is that this is bad news for the planet we all live on. As standards of living are accelerating rapidly in developing countries like China, India, Brazil and Nigeria, both energy consumption and carbon emissions are also increasing at a commensurate rate. It is important to note that in the future there will be an even faster growth in carbon dioxide emissions from these emerging economies.

Figure 1.4 The CO2 emission rates for countries and regions
Each country, depending on its power generation process, power consumption and population, emits differing amounts of greenhouse gases into the atmosphere. Table 1.2 shows data that estimates carbon dioxide (CO2) emissions (the main component of greenhouse gases) from the combustion of coal, natural gas, oil and other fuels, including industrial waste and non-renewable municipal waste. It shows the ranking of the top 20 countries as the highest emitters of carbon dioxide in 2020.
Table 1.2 Top 20 countries emitting CO2 in 2020
SOURCE: Earth Systems Science Data (2020).
| Rank | Countries | CO2 emissions (Giga tonnes) | Percentage (%) |
|---|---|---|---|
| 1 | China | 10.06 | 28 |
| 2 | USA | 5.41 | 15 |
| 3 | India | 2.65 | 7 |
| 4 | Russian Federation | 1.71 | 5 |
| 5 | Japan | 1.16 | 3 |
| 6 | Germany | 0.75 | 2 |
| 7 | Iran | 0.72 | 2 |
| 8 | South Korea | 0.65 | 2 |
| 9 | Saudi Arabia | 0.62 | 2 |
| 10 | Indonesia | 0.61 | 2 |
| 11 | Canada | 0.56 | 2 |
| 12 | Mexico | 0.47 | 1 |
| 13 | South Africa | 0.46 | 1 |
| 14 | Brazil | 0.45 | 1 |
| 15 | Turkey | 0.42 | 1 |
| 16 | Australia | 0.42 | 1 |
| 17 | United Kingdom | 0.37 | 1 |
| 18 | Poland | 0.34 | 1 |
| 19 | France | 0.33 | 1 |
| 20 | Italy | 0.33 | 1 |
The top 20 carbon dioxide emitting countries account for 79% of the total CO2 emissions of the world and the top 5 countries (China, USA, India, Russia and Japan) are responsible for 58% of the total emissions.
A very useful way to show the impact of CO2 in the atmosphere is by ppm, or parts per million. This number tells us how many parts of carbon dioxide there are in one million parts of air. Figure 1.5 shows the rapid rise of CO2 ppm levels along with the rise in CO2 emissions in the atmosphere over the last 100 years.
Carbon dioxide concentrations are rising mostly because of the fossil fuels that people are burning for energy. Fossil fuels like coal and oil contain carbon that plants pulled out of the atmosphere through photosynthesis over the span of many millions of years; however, now we are returning that carbon to the atmosphere within a timespan of just a few hundred years. The current level of ppm in 2020 is 410, but this figure is growing. The danger level of CO2 could occur when we are exposed to levels above 5,000 ppm for a number of hours. A further critical point is that even higher levels of CO2 can cause asphyxiation as carbon dioxide replaces oxygen in the blood. We do know that exposure to concentrations of around 40,000 PPM is immediately dangerous to life and health.
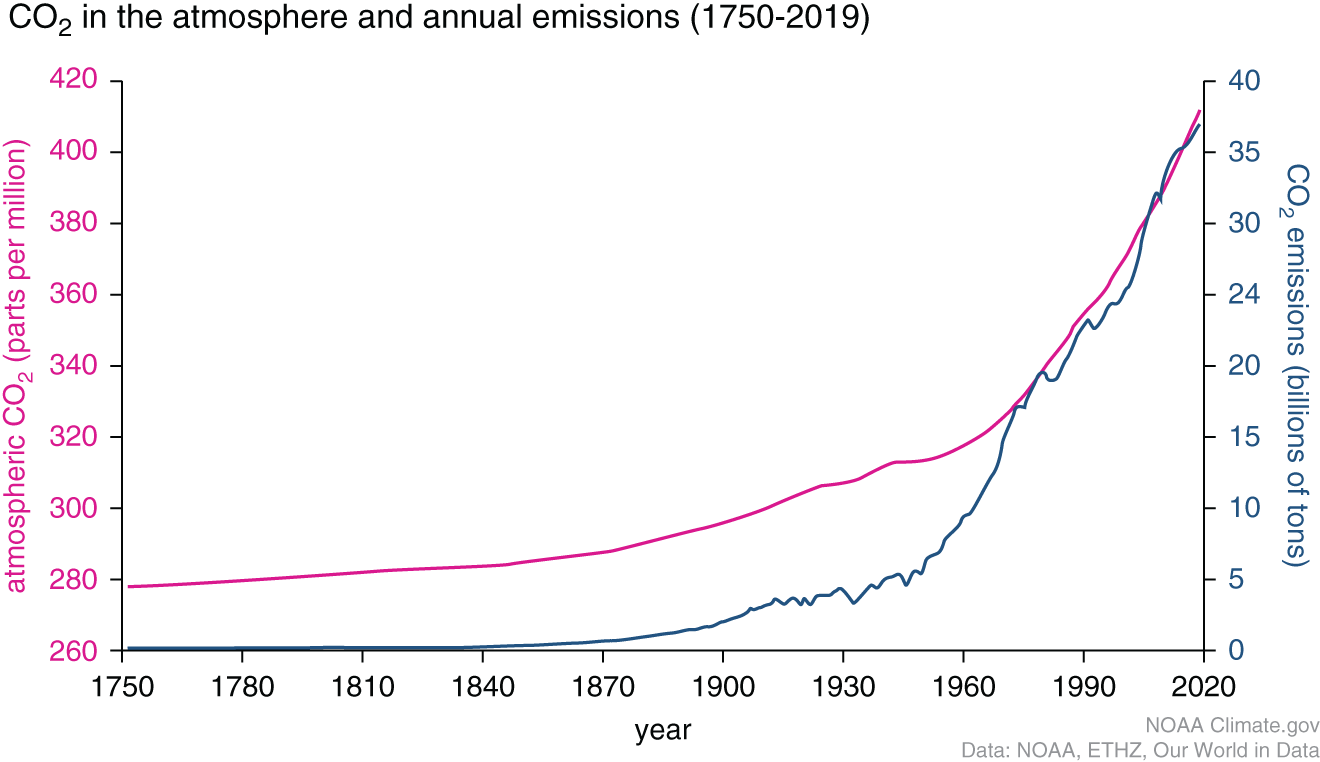
Figure 1.5 The CO2 emission rates and CO2 ppm
1.4. Greenhouse Gas Emissions by Economic Sector
It is disturbing to learn that greenhouse gas emissions are anthropogenic, which means that these environmental changes are caused mainly by human behaviour, that is everything that humans do to live and prosper in a society. The share of emissions depends on the various sectors of the economy contributing to our lifestyle, such as how we make things, how we grow our foods, how we are plugging into electricity and how we are getting around.
We can see that there are some paradoxes involved. For example, while we would all agree that we need both cement and steel to build our infrastructures, however making steel and cement alone accounts for approximately 10% of all emissions. There are some variations in the proportion of data for greenhouse gas emissions by economic sector depending on the sources and their chosen categories. I have chosen the categories and data from IPCC (2014a) as shown in Table 1.3.
From this table, we can note that electricity and energy account for just over a third of all greenhouse gas emissions. Indeed, the burning of coal, natural gas and oil for electricity and heat is the largest single source of global greenhouse gas emissions.
Table 1.3 Greenhouse gas emissions by economic sector
SOURCE: IPCC (2014a).
| Economic Sector | Percentages |
|---|---|
| Electricity and other energy | 35 |
| Agriculture and land | 24 |
| Industry | 21 |
| Transports | 14 |
| Buildings | 6 |
Greenhouse gas emissions from the agriculture and land sector come mostly from agriculture (the cultivation of crops and livestock) and the practice of deforestation. The gas emissions from cattle and sheep are also a significant source in this sector.
Greenhouse gas emissions from industry primarily involve fossil fuels burned on site at facilities for energy. This sector also includes emissions from chemical, metallurgical and mineral transformation processes not associated with energy consumption and emissions from waste management activities.
If we consider the transportation sector, greenhouse gas emissions primarily involve fossil fuels burned for road, rail, air and marine transportation. Almost all (95%) of the world's transportation energy comes from petroleum-based fuels, largely gasoline and diesel.
Greenhouse gas emissions from the energy sector arise from onsite energy generation and burning fuels for heat in buildings or cooking in homes. Emissions from the electricity and other sectors are covered in Chapter 7.
1.5. Summary
From the evidence-based analysis in this chapter some key points can be summarised:
- The global warming debate is over. There is incontrovertible evidence now that over the last 50 years our planet is warming between 0.5 degrees centigrade and 1.5 degrees centigrade. If no action is taken, the temperature will continue to rise and consequently sea levels will increase, with impacts on our weather cycle, including more frequent cyclones, wildfires and incidences of flooding.
- The world is producing 51 billion tonnes of greenhouse gases every year; the biggest contributor is carbon dioxide (82%) generated mainly from the combustion of coal, natural gas, oil and other fuels.
- The world's most advanced economies (e.g. USA, Japan, EU, UK and Canada) have been producing greenhouse gases. However, the growth in emissions will come from the emerging and populous economies (e.g. China, India, Brazil, Russia, Nigeria and Indonesia).
- The largest economic sector of CO2 emissions is the generations and consumption of energy (35%). Fossil fuels (e.g. coal, gas and oil) are the major sources of power plants and energy consumption in industries and houses.
- To avoid the climate disaster we must act now. We need to invest in future research for breakthrough solutions, but we have to deploy the tools we already have, such as solar and wind.
If we have a breakthrough process solution now we must apply it immediately. We should also aim for a sustainable outcome. The United Nations (United Nations Foundation, 2020) projected 17 sustainable development goals (SDGs) to be achieved by 2030, of which climate change is the 13th goal. Sustainability focuses on meeting the requirements of the present without compromising the ability of future generations to meet their own needs.
Green Six Sigma (a hybrid of Six Sigma) is designed to provide both breakthrough process solutions and sustainable outcomes.