
CHAPTER 8
Can Your Data Be Trusted?
by Thomas C. Redman
You’ve just learned of some new data that, when combined with existing data, could offer potentially game-changing insights. But there isn’t a clear indication whether this new information can be trusted. How should you proceed?
There is, of course, no simple answer. While many managers are skeptical of new data and others embrace it wholeheartedly, the more thoughtful managers take a nuanced approach. They know that some data (maybe even most of it) is bad and can’t be used, and some is good and should be trusted implicitly. But they also realize that some data is flawed but usable with caution. They find this data intriguing and are eager to push the data to its limits, as they know game-changing insights may reside there.
Fortunately, you can work with your data scientists to assess whether the data you’re considering is safe to use and just how far you can go with flawed data. Indeed, following some basic steps can help you proceed with greater confidence—or caution—as the quality of the data dictates.
Evaluate Where It Came From
You can trust data when it is created in accordance with a first-rate data quality program. They feature clear accountabilities for managers to create data correctly, input controls, and find and eliminate the root causes of error. You won’t have to opine whether the data is good—data quality statistics will tell you. You’ll find an expert who will be happy to explain what you may expect and answer your questions. If the data quality stats look good and the conversation goes well, trust the data. This is the “gold standard” against which the other steps should be calibrated.
Assess Data Quality Independently
Much, perhaps most, data will not meet the gold standard, so adopt a cautious attitude by doing your own assessment of data quality. Make sure you know where the data was created and how it is defined, not just how your data scientist accessed it. It is easy to be misled by a casual, “We took it from our cloud-based data warehouse, which employs the latest technology,” and completely miss the fact that the data was created in a dubious public forum. Figure out which organization created the data. Then dig deeper: What do colleagues advise about this organization and data? Does it have a good or poor reputation for quality? What do others say on social media? Do some research both inside and outside your company.
At the same time, develop your own data quality statistics, using what I call the “Friday afternoon measurement,” tailor-made for this situation. Briefly, you, the data scientist providing the analysis, or both of you, should lay out 10 or 15 important data elements for 100 data records on a spreadsheet. If the new data involves customer purchases, such data elements may include “customer name,” “purchased item,” and “price.” Then work record by record, taking a hard look at each data element. The obvious errors will jump out at you—customer names will be misspelled, the purchased item will be a product you don’t sell, or the price may be missing. Mark these obvious errors with a red pen or highlight them in a bright color. Then count the number of records with no errors. (See figure 8-1 for an example.) In many cases you’ll see a lot of red—don’t trust this data! If you see only a little red, say, less than 5% of records with an obvious error, you can use this data with caution.
Look, too, at patterns of the errors. If, for instance, there are 25 total errors, 24 of which occur in the price, eliminate that data element going forward. But if the rest of the data looks pretty good, use it with caution.
Example: Friday afternoon measurement spreadsheet
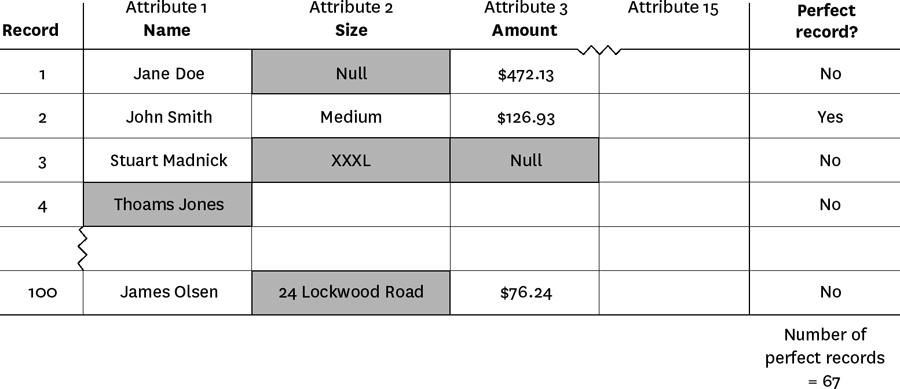
Source: Thomas C. Redman, “Assess Whether You Have a Data Quality Problem” on hbr.org, July 28, 2016 (product #H030SQ).
Clean the Data
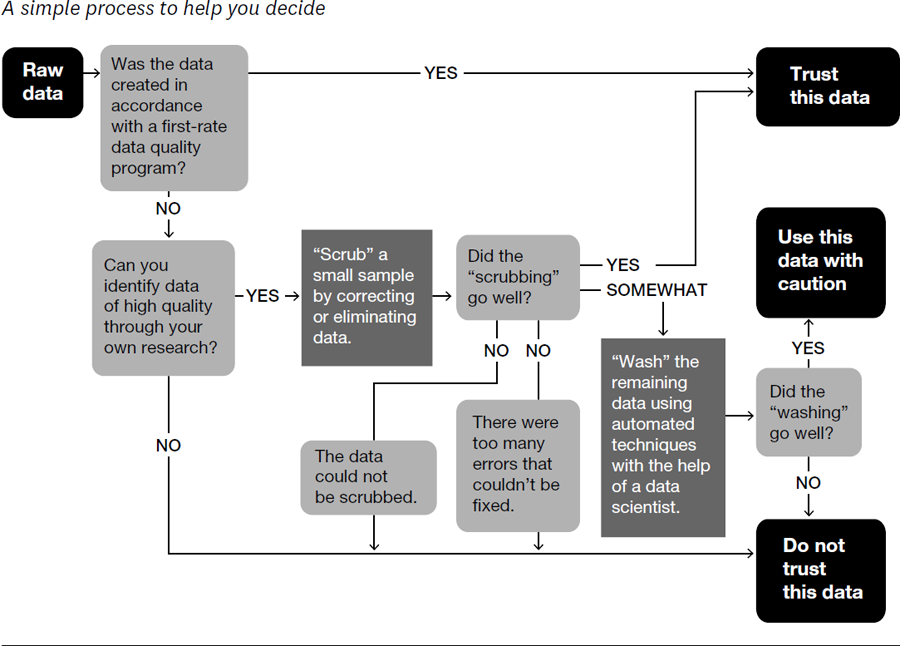
I think of data cleaning in three levels: rinse, wash, and scrub. “Rinse” replaces obvious errors with “missing value” or corrects them if doing so is very easy; “scrub” involves deep study, even making corrections one at a time, by hand, if necessary; and “wash” occupies a middle ground.
Even if time is short, scrub a small random sample (say, 1,000 records), making them as pristine as you possibly can. Your goal is to arrive at a sample of data you know you can trust. Employ all possible means of scrubbing and be ruthless! Eliminate erroneous data records and data elements that you cannot correct, and mark data as “uncertain” when applicable.
When you are done, take a hard look. When the scrubbing has gone really well (and you’ll know if it has), you’ve created a data set that rates high on the trustworthy scale. It’s OK to move forward using this data.
Sometimes the scrubbing is less satisfying. If you’ve done the best you can, but still feel uncertain, put this data in the “use with caution” category. If the scrubbing goes poorly—for example, too many prices just look wrong and you can’t make corrections—you must rate this data, and all like it, as untrustworthy. The sample strongly suggests none of the data should be used to inform your decision.
After the initial scrub, move on to the second cleaning exercise: washing the remaining data that was not in the scrubbing sample. This step should be performed by a truly competent data scientist. Since scrubbing can be a time-consuming, manual process, the wash allows you to make corrections using more automatic processes. For example, one wash technique involves “imputing” missing values using statistical means. Or your data scientist may have discovered algorithms during scrubbing. If the washing goes well, put this data into the “use with caution” category.
The flow chart in figure 8-2 will help you see this process in action. Once you’ve identified a set of data that you can trust or use with caution, move on to the next step of integration.
Ensure High-Quality Data Integration
Align the data you can trust—or the data that you’re moving forward with cautiously—with your existing data. There is a lot of technical work here, so probe your data scientist to ensure three things are done well:
- Identification: Verify that the Courtney Smith in one data set is the same Courtney Smith in others.
- Alignment of units of measure and data definitions: Make sure Courtney’s purchases and prices paid, expressed in “pallets” and “dollars” in one set, are aligned with “units” and “euros” in another.
- De-duplication: Check that the Courtney Smith record does not appear multiple times in different ways (say as C. Smith or Courtney E. Smith).
At this point in the process, you’re ready to perform whatever analytics (from simple summaries to more complex analyses) you need to guide your decision. Pay particular attention when you get different results based on “use with caution” and “trusted” data. Both great insights and great traps lie here. When a result looks intriguing, isolate the data and repeat the steps above, making more detailed measurements, scrubbing the data, and improving wash routines. As you do so, develop a feel for how deeply you should trust this data.
Data doesn’t have to be perfect to yield new insights, but you must exercise caution by understanding where the flaws lie, working around errors, cleaning them up, and backing off when the data simply isn’t good enough.
__________
Thomas C. Redman, “the Data Doc,” is President of Data Quality Solutions. He helps companies and people, including startups, multinationals, executives, and leaders at all levels, chart their courses to data-driven futures. He places special emphasis on quality, analytics, and organizational capabilities.
Adapted from content posted on hbr.org, October 29, 2015 (product #H02G61).