
CHAPTER 13
A Refresher on Statistical Significance
by Amy Gallo
When you run an experiment or analyze data, you want to know if your findings are significant. But business relevance (that is, practical significance) isn’t always the same thing as confidence that a result isn’t due purely to chance (that is, statistical significance). This is an important distinction; unfortunately, statistical significance is often misunderstood and misused in organizations today. And because more and more companies are relying on data to make critical business decisions, it’s an essential concept for managers to understand.
To better understand what statistical significance really means, I talked with Thomas Redman, author of Data Driven: Profiting from Your Most Important Business Asset, and adviser to organizations on their data and data quality programs.
What Is Statistical Significance?
“Statistical significance helps quantify whether a result is likely due to chance or to some factor of interest,” says Redman. When a finding is significant, it simply means you can feel confident that it’s real, not that you just got lucky (or unlucky) in choosing the sample.
When you run an experiment, conduct a survey, take a poll, or analyze a data set, you’re taking a sample of some population of interest, not looking at every single data point that you possibly can. Consider the example of a marketing campaign. You’ve come up with a new concept and you want to see if it works better than your current one. You can’t show it to every single target customer, of course, so you choose a sample group.
When you run the results, you find that those who saw the new campaign spent $10.17 on average, more than the $8.41 spent by those who saw the old campaign. This $1.76 might seem like a big—and perhaps important—difference. But in reality you may have been unlucky, drawing a sample of people who do not represent the larger population; in fact, maybe there was no difference between the two campaigns and their influence on consumers’ purchasing behaviors. This is called a sampling error, something you must contend with in any test that does not include the entire population of interest.
Redman notes that there are two main contributors to sampling error: the size of the sample and the variation in the underlying population. Sample size may be intuitive enough. Think about flipping a coin 5 times versus flipping it 500 times. The more times you flip, the less likely you’ll end up with a great majority of heads. The same is true of statistical significance: With bigger sample sizes, you’re less likely to get results that reflect randomness. All else being equal, you’ll feel more comfortable in the accuracy of the campaigns’ $1.76 difference if you showed the new one to 1,000 people rather than just 25. Of course, showing the campaign to more people costs more money, so you have to balance the need for a larger sample size with your budget.
Variation is a little trickier to understand, but Redman insists that developing a sense for it is critical for all managers who use data. Consider the images in figure 13-1. Each expresses a different possible distribution of customer purchases under campaign A. Looking at the chart on the left (with less variation), most people spend roughly the same amount. Some people spend a few dollars more or less, but if you pick a customer at random, chances are pretty good that they’ll be close to the average. So it’s less likely that you’ll select a sample that looks vastly different from the total population, which means you can be relatively confident in your results.
Compare that with the chart on the right (with more variation). Here, people vary more widely in how much they spend. The average is still the same, but quite a few people spend more or less. If you pick a customer at random, chances are higher that they are pretty far from the average. So if you select a sample from a more varied population, you can’t be as confident in your results.
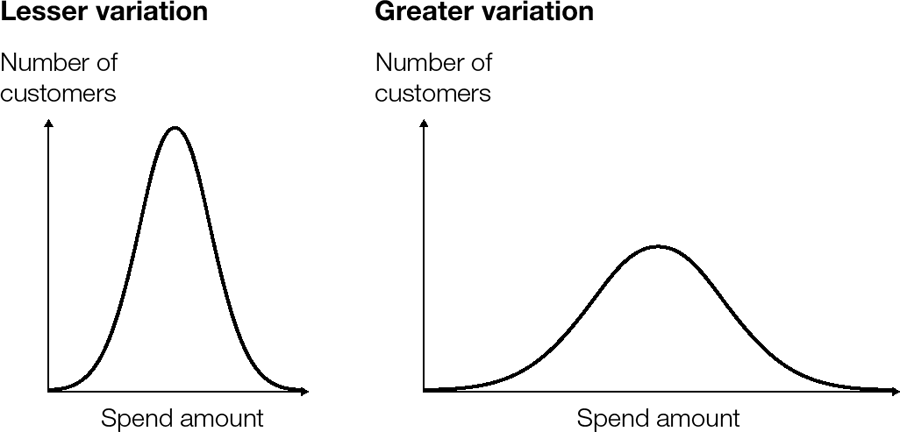
To summarize, the important thing to understand is that the greater the variation in the underlying population, the larger the sampling error.
Redman advises that you should plot your data and make pictures like these when you analyze the numbers. The graphs will help you get a feel for variation, the sampling error, and in turn, the statistical significance.
No matter what you’re studying, the process for evaluating significance is the same. You start by stating a null hypothesis. In the experiment about the marketing campaign, the null hypothesis might be, “On average, customers don’t prefer our new campaign to the old one.” Before you begin, you should also state an alternative hypothesis, such as, “On average, customers prefer the new one,” and a target significance level. The significance level is an expression of how rare your results are, under the assumption that the null hypothesis is true. It is usually expressed as a p-value, and the lower the p-value, the less likely the results are due purely to chance.
Setting a target and interpreting p-values can be dauntingly complex. Redman says it depends a lot on what you are analyzing. “If you’re searching for the Higgs boson, you probably want an extremely low p-value, maybe 0.00001,” he says. “But if you’re testing for whether your new marketing concept is better or the new drill bits your engineer designed work faster than your existing bits, then you’re probably willing to take a higher value, maybe even as high as 0.25.”
Note that in many business experiments, managers skip these two initial steps and don’t worry about significance until after the results are in. However, it’s good scientific practice to do these two things ahead of time.
Then you collect your data, plot the results, and calculate statistics, including the p-value, which incorporates variation and the sample size. If you get a p-value lower than your target, then you reject the null hypothesis in favor of the alternative. Again, this means the probability is small that your results were due solely to chance.
How Is It Calculated?
As a manager, chances are you won’t ever calculate statistical significance yourself. “Most good statistical packages will report the significance along with the results,” says Redman. There is also a formula in Microsoft Excel and a number of other online tools that will calculate it for you.
Still, it’s helpful to know the process in order to under stand and interpret the results. As Redman advises, “Managers should not trust a model they don’t understand.”
How Do Companies Use It?
Companies use statistical significance to understand how strongly the results of an experiment, survey, or poll they’ve conducted should influence the decisions they make. For example, if a manager runs a pricing study to understand how best to price a new product, they will calculate the statistical significance (with the help of an analyst, most likely) so that they know whether the findings should affect the final price.
Remember the new marketing campaign that produced a $1.76 boost (more than 20%) in the average sale? It’s surely of practical significance. If the p-value comes in at 0.03 the result is also statistically significant, and you should adopt the new campaign. If the p-value comes in at 0.2 the result is not statistically significant, but since the boost is so large you’ll probably still proceed, though perhaps with a bit more caution.
But what if the difference were only a few cents? If the p-value comes in at 0.2, you’ll stick with your current campaign or explore other options. But even if it had a significance level of 0.03, the result is probably real, though quite small. In this case, your decision probably will be based on other factors, such as the cost of implementing the new campaign.
Closely related to the idea of a significance level is the notion of a confidence interval. Let’s take the example of a political poll. Say there are two candidates: A and B. The pollsters conduct an experiment with 1,000 “likely voters.” From the sample, 49% say they’ll vote for A and 51% say they’ll vote for B. The pollsters also report a margin of error of +/- 3%.
“Technically, 49% plus or minus 3% is a 95% confidence interval for the true proportion of A voters in the population,” says Redman. Unfortunately, he adds, most people interpret this as “there’s a 95% chance that A’s true percentage lies between 46% and 52%,” but that isn’t correct. Instead, it says that if the pollsters were to do the result many times, 95% of intervals constructed this way would contain the true proportion.
If your head is spinning at that last sentence, you’re not alone. As Redman says, this interpretation is “maddeningly subtle, too subtle for most managers and even many researchers with advanced degrees.” He says the more practical interpretation of this would be “Don’t get too excited that B has a lock on the election” or “B appears to have a lead, but it’s not a statistically significant one.” Of course, the practical interpretation would be very different if 70% of the likely voters said they’d vote for B and the margin of error was 3%.
The reason managers bother with statistical significance is they want to know what findings say about what they should do in the real world. But “confidence intervals and hypothesis tests were designed to support ‘science,’ where the idea is to learn something that will stand the test of time,” says Redman. Even if a finding isn’t statistically significant, it may have utility to you and your company. On the other hand, when you’re working with large data sets, it’s possible to obtain results that are statistically significant but practically meaningless, for example, that a group of customers is 0.000001% more likely to click on campaign A over campaign B. So rather than obsessing about whether your findings are precisely right, think about the implication of each finding for the decision you’re hoping to make. What would you do differently if the finding were different?
What Mistakes Do People Make When Working with Statistical Significance?
“Statistical significance is a slippery concept and is often misunderstood,” warns Redman. “I don’t run into very many situations where managers need to understand it deeply, but they need to know how to not misuse it.”
Of course, data scientists don’t have a monopoly on the word “significant,” and often in businesses it’s used to mean whether a finding is strategically important. It’s good practice to use language that’s as clear as possible when talking about data findings. If you want to discuss whether the finding has implications for your strategy or decisions, it’s fine to use the word “significant,” but if you want to know whether something is statistically significant, be precise in your language. Next time you look at results of a survey or experiment, ask about the statistical significance if the analyst hasn’t reported it.
Remember that statistical significance tests help you account for potential sampling errors, but Redman says what is often more worrisome is the non-sampling error: “Non-sampling error involves things where the experimental and/or measurement protocols didn’t happen according to plan, such as people lying on the survey, data getting lost, or mistakes being made in the analysis.” This is where Redman sees more troubling results. “There is so much that can happen from the time you plan the survey or experiment to the time you get the results. I’m more worried about whether the raw data is trustworthy than how many people they talked to,” he says. Clean data and careful analysis are more important than statistical significance.
Always keep in mind the practical application of the finding. And don’t get too hung up on setting a strict confidence interval. Redman says there’s a bias in scientific literature that “a result wasn’t publishable unless it hit a p = 0.05 (or less).” But for many decisions—like which marketing approach to use—you’ll need a much lower confidence interval. In business, says Redman, there’s often more important criteria than statistical significance. The important question is, “Does the result stand up in the market, if only for a brief period of time?”
As Redman says, the results only give you so much information: “I’m all for using statistics, but always wed it with good judgment.”
__________
Amy Gallo is a contributing editor at Harvard Business Review and the author of the HBR Guide to Dealing with Conflict. Follow her on Twitter @amyegallo.
Adapted from content posted on hbr.org, February 16, 2016 (product #H02NMS).