
Urban Public Finance
Edward L. Glaeser, Harvard University and National Bureau of Economic Research, Cambridge, MA, USA
Abstract
America’s local governments spend about one-eighth of our national income, one-fourth of total government spending, and employ over 14 million people. This paper surveys the large and growing economics literature on local governments and their finances. A primary difference between local and national government is the ease of labor mobility within countries, which disciplines local governments and means that heterogeneous service levels can be beneficial, but mobility also challenges local attempts at redistribution. The empirical literature on mobility responses to local government is distinguished, but remains a pressing area for future research. We have sophisticated models of local spending, tax policy, and institutional design, but research is often far less developed on even basic questions of costs and benefits of core local public services.
Keyword
Property taxes; Borrowing; Investments; Centralization; Agglomeration; Cross-state differences; Revenues; Local government; City government; Public finance; Urban politics; Urban infrastructure; City management; Taxation; Mobility
1 Introduction
More than one-half of the world is urbanized and 84% of Americans live in metropolitan areas, which are typically anchored by significant cities. Urban proximity creates abundant externalities—good and bad—and urban governments expanded, long before their rural counterparts, partially to provide the infrastructure that can mitigate adverse urban externalities, like contagious disease. This essay will review the central tasks of local governments and how they are financed, primarily within the United States, with only pay limited attention paid to the rest of the world.
As of 2008, America’s local governments spent about one-eighth of our national gross domestic product (GDP), one-fourth of total government spending, and employ over 14 million people.1 Local governments differ from state and national governments because there are vastly more of them and because they specialize in delivering quite tangible services, like public safety and education, to taxpayers who generally pay for them. In the US, there are three central features that make local government finance distinctly different from public finance at the national or even the state level: property taxes are responsible for the majority of local taxes, intergovernmental transfers provide about one-third of local revenues, and localities typically maintain relatively balanced budgets.
These core features of urban public finance are intimately connected with the nature of cities and the functions of urban governments. One essential feature of cities is that people and capital can readily leave them; greater factor mobility is a key feature of urban, as opposed to national, public finance (Wildasin, 1986), and I review the evidence of migration in Section 6. Indeed, the modern economics literature on local public finance begins with Charles Tiebout’s classic 1956 article, which argued that local governments provided an ingenious way of embedding choice and competition into the provision of public services. The local government dependence on property taxes reflects, in part, the fact that real estate is fixed in a way that labor income is not, which reduces the distortions that can come from mobility. The large role of intergovernmental transfers enables city governments to be tools for redistribution, especially through schooling, despite the fact that the threat of out-migration limits that natural ability to lower levels of government to redistribute.
The discipline that mobility provides on local governments helps explain why these governments are typically far less ideologically partisan than their national equivalents. Ferreira and Gyourko (2009), for example, use a regression discontinuity approach to test whether Democratic or Republican mayors show significantly different spending patterns, as they do at the national or even state levels. Ferreira and Gyourko find little such urban partisanship, which corroborates the apparently similar approaches followed by mayors like New York’s Mayor Bloomberg, who was elected as a Republican, and Chicago’s former Mayor Daley, who was and is a Democrat.
Mobility is one of the forces that create severe limits that constrain the action of urban governments; state laws provide another set of limits. Cities, within the US, are creations of state governments. With the sole exception of Washington, DC, they have no independent constitutional status. As a result, states have generally restricted the taxing, borrowing, and functional authority of local governments, usually by legislative action and occasionally by referendum. Typically, cities like states face at least a notional balanced budget requirement.
Despite the formal limitations that appear to bind city governments, local leaders have often attempted to bypass those limits with different schemes to get around their budget constraints. Compensating workers with underfunded pension and health care benefits may be the most important example of bypassing the budget constraint, but there are many others. Privatizing city assets, such as selling the right to collect parking meter payments over future decades, recently created a cash windfall for Chicago.
There has also been a steady stream of governmental innovations that often create substitutes for traditional local government. There has been phenomenal growth, for example, in the number of special districts which provide services ranging from education to firefighting to public transit (Berry, 2009). America has also seen an explosion in the number of private and often gated communities (Blakely & Snyder, 1999), where corporations essentially take on the core tasks of local governments, and other nations have also followed this trend (Atkinson, Blandy, & Mostowska, 2007). Large cities have increasingly seen Business Improvement Districts (BIDs) where businesses pay fees for increased policing and improvements in public spaces.
The constraints on local government financing become particularly obvious during cyclical downturns, such as the American recession that began in 2007. In response, the federal government has stepped in providing support both for urban infrastructure, like roads, and basic funding of local government services, like schools. Federally managed revenue smoothing over the business cycle may have advantages relative to huge local spending cutbacks during downturns, but relying on federal support may also have costs, especially if the spending goes to services that have limited value, relative to a more locally managed smoothing process.
The American tradition of decentralized political authority is not unique but it does lie at the end of the global spectrum. At the other end are countries, such as the United Kingdom, where the national government maintains far more responsibility over local services. The mayor of London’s power, for example, extends primarily over transportation matters, while the home secretary and the education secretary have greater authority over London’s safety and schools. India occupies a middle ground where large state governments control most urban services.
Within the US, there are cross-state differences in the responsibilities allotted to cities and cross metropolitan area differences in the degree of political fragmentation. In some areas, such as Boston, the central city occupies a very small sliver of the metropolitan area and is surrounded by a vast number of smaller communities. In other metropolitan areas, such as Denver, the central city occupies a much larger spatial footprint. The spatial size of the central city can mean that its government essentially enjoys more monopoly power within the region.
The costs and benefits of decentralization and political fragmentation have been debated by economists since Tiebout. Tiebout’s core followers emphasize the benefits of diversity and competition. Their intellectual opponents argue that smaller areas cannot coordinate sufficiently to provide region-wide public goods or social services (Rusk, 1993). Empirical attempts to uncover the benefits of local government competition (Hoxby, 2000) have often met with serious debate (Rothstein, 2007).
In this essay, I will begin by reviewing the basics of city services, regulatory powers, and finance in Section 2. I will also include some discussion of the history of American city governments and some discussion with government structures in other parts of the world. Every country’s approach to urban government is different, so it would be impossible to meaningfully survey the world’s urban governments, but I will add a bit of international perspective mainly to emphasize the range of political options that are, at least in principle, available.
In Section 3, I will turn to the key features of urban governments: decentralized and limited authority, urban externalities, and selective migration. As I have already argued, these elements of urban government interact in important ways. Moreover, they all must be understood if we are to better understand or even improve urban government.
In Section 4, I will present a model of urban taxation and city services. The model takes the existence of a city as given, and then presents the key conditions for optimal taxation and service delivery. In line with standard urban models, maximizing social welfare (globally) occurs when a locality makes choices that either maximize local population or land value.2 The model delivers the standard result that a land tax is essentially non-distortionary at the local level (although that depends on having no investments that improve the value of land), but that in the absence of a land tax, a modified Ramsey rule holds for taxing property and income. There is also a version of this rule that holds when labor is mobile, where second-best tax formulas change to reflect geographic mobility.
In Section 5, I turn to the provision and financing of core city services, such as policing and education that is motivated by the results of the model. I discuss the ways in which the sources of revenue interact with the nature of service of provision. I will also use this section to discuss intertemporal aspects of city-budgeting.
Section 6 turns to local taxes and redistribution. As the model in Section 4 highlights, redistribution is a particular challenge for local governments because of mobility. Social welfare-related services were historically delivered by cities themselves, but since the New Deal these have been at least typically funded by higher levels of government, even when control over the services remained lodged at the city level. Other core urban services, like education, often have a redistributive component. There are also aspects of redistribution in some local regulations, like rent control and in some local tax systems.
In Section 7, I turn to urban infrastructure. Cities have often built extremely expensive investments such as water and transit systems. These have rarely been financed with direct taxes, but have almost always involved borrowing and occasionally been supported with large transfers from other levels of government. The Transportation Aid Act of 1973, for example, initiated federal financing for local transit systems. User fees or the sale of impacted land can also help finance the investment. I will discuss, briefly, the literature on cost-benefit analysis and infrastructure.
Section 8 addresses urban politics and institutions. Even within the United States, there is substantial heterogeneity in the forms of city government, between weak mayor systems and strong mayor systems, and areas with city managers. There is far more heterogeneity outside the United States. At one time, political machines dominated many larger cities, but they are considerably rarer today. I will discuss the interplay between political forces and city finances and services. Section 9 concludes.
2 The Functions and Powers of City Governments
America has a vast number of local governments—more than 89,000 of them—which is quite close to the 91,000 local governments that existed in 1962.3 Of those, 19,492 are city governments, a number that is almost unchanged in 50 years. In 1962, there were 18,000 municipal governments. The number of county governments has stuck between 3033 and 3049 for the last fifty years, and the number of town governments is only slightly more volatile. The number of general-purpose governments in the US is quite static.
By contrast, the number of school and special districts—the other two major types of local governments—has shifted enormously. There were over 34,000 school districts in 1962 and consolidation of far-flung districts means that there are only 13,000 today. The number of special districts has increased from 18,323 to 37,381 in 2007. These districts specialize in natural resources, like water, firefighting, and housing. They typically have a single primary purpose, and are often led by appointed, rather than directly elected, boards.
Taken as a whole, local governments, which include special and school districts, and townships spend 235 billion dollars on capital outlays and $1.2 trillion on current operations. About 40% of local governments spending goes toward primary and secondary education, and more than one-half (7.9 million) of local governments’ workers. The next largest employment area is policing, which employs 909,000, followed by hospitals (644,000), higher education (606,000), and fire protection (429,000). These functions are also significant sources of local government spending, but local utilities are also a large expenditure category, with 168 billion in local government spending nationwide.
There is considerable heterogeneity, however, in the spending patterns of individual large cities, in part because of the functions of government that are taken on by those cities. Taken as a whole, city spending can be grouped into three large bins: basic city services, many of which were meant to address urban externalities (including fire, policing, and waste management); social welfare spending (including explicit social welfare spending, cities hospitals, and housing); and education, which is a service unto itself. The basic services are almost all provided by city governments themselves. Social welfare spending and education are far less ubiquitous.
The overwhelming majority of large cities do not have any spending on education, because that function is overseen by an independent, or quasi-independent, school board. Even in some cases where the mayor maintains a fair amount of control over schooling, such as Chicago, the schools are not an official budget item. Only six of the thirty-five largest cities spend more than 2% of their budgets on education. Likewise, public welfare (which is typically not handled at the city level) involves more than 10% of the budget items for only four of the largest thirty-five cities (New York, Philadelphia, San Francisco, and Washington, DC); the majority of large cities spend nothing in this category.
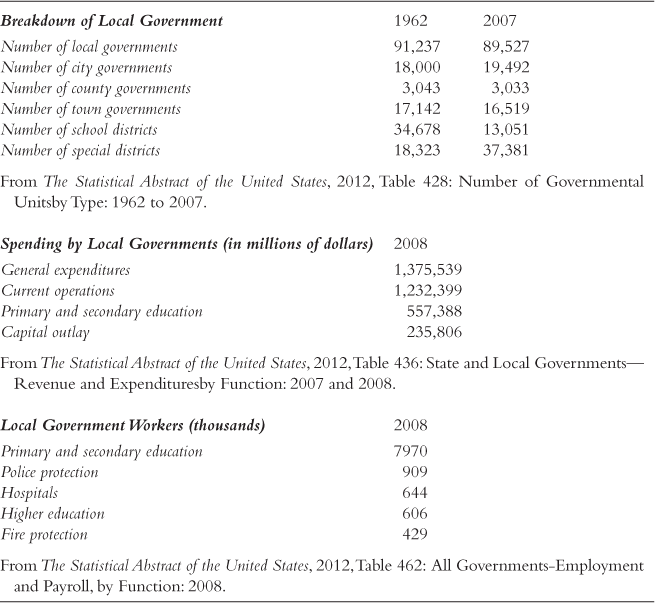
By contrast, every large city has some spending on police, fire, highways, and “parks and recreation.” Almost every city has some spending on “housing and community development,” solid waste management, and sewers, and the overwhelming majority spend on health and hospitals. The different tasks assigned to city governments make it extremely difficult to make sense of total city expenditures of tax levels. Figure 1 shows the relationship between the logarithm city population and per capita expenditure levels in 2000 for cities with more than 200,000 people. The relationship is positive, but at this level, it is hard to know if the relationship represents the greater cost of delivering government services at the city level or just the greater range of services typically provided by city governments, relative to other overlapping jurisdictions.
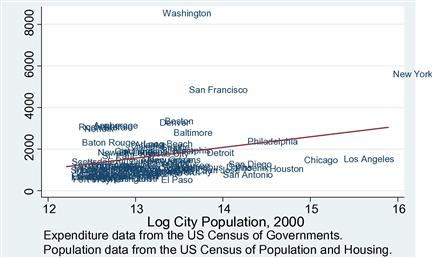
Figure 1 Population vs. Total Expenditure Per Capita, 2000 (for cities with 200,000 or more people).
It is somewhat more sensible to discuss differences in spending on particular categories. Figure 2 shows the relationship between per capita spending on police in 2000 and the logarithm of city population for the same sample of larger cities. In this case, the relationship is still potentially troubled by the role that other levels of government often play in policing (e.g., state troopers), but the relationship is closer to have some meaning. Larger cities do typically have higher labor costs and larger crime problems (Glaeser & Sacerdote, 1999) and that combination leads to more police spending.
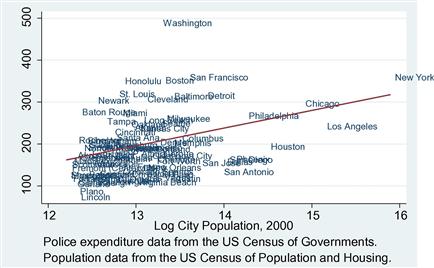
Figure 2 Population vs. Police Expenditure Per Capita, 2000 (for cities with 200,000 or more people).
On the revenue side, local governments as a whole receive the lion’s share of their revenues from intergovernmental transfers and local property taxes. Out of the $1.5 trillion of total revenues shared by America’s local governments in 2008, $524 billion come from intergovernmental transfers, and $397 billion came from property taxes. Sales taxes produced another $90 billion of revenue, but local governments, taken as a whole, rely very little on income or business taxes. The other two significant sources of revenues are user fees for utilities and hospitals, but these revenues fall significantly below the costs of providing these services.
The dominance of the property tax is among the most salient aspects of local government, and this has been the topic of significant amounts of academic research. Property tax rates differ in nominal rates, typical assessment rates (relative to true market values), and overall effective tax rates. For example, Philadelphia and Indianapolis both have quite high effective tax rates of 2.64% and 2.75%, respectively, but Philadelphia’s nominal tax rate is 8.24% and Indianapolis’ nominal rate is 2.75%. The difference, of course, is that while Indianapolis typically assesses at full market value, Philadelphia typically assess at 30% of market value. New York City has one of the most bizarre systems, and one of the lowest effective tax rates of .62%, which is accomplished with a nominal rate of 16.7% and an average assessment value of 3.7%.
The overall revenue picture for individual large cities can be quite different than the aggregate for local governments. New York City is sui generis. With $70 billion in general revenue, New York City’s government is approximately 10 times larger than the governments of Los Angeles and Chicago. The transfers the city receives from other levels of government, $26 billion, are 20 times larger than the two next largest cities, reflecting the larger range of services, especially education and social welfare, which are performed by the city of New York.
Property taxes provide less than one-fifth of New York City’s revenues, but while that is unusual for local governments as a whole, it is not that unusual for large cities to have less dependence on the property tax, which the model of Section 4 can help explain. Outside of Texas, every one of the 10 largest American cities depends on property tax revenue at less than half the standard 40% level for local governments. The only large cities where property taxes account for anything like that share of revenues are Honolulu (44%), Indianapolis (49%), Boston (40%), and Nashville (37%). Sales taxes are also a significant source of revenues, but general sales taxes are typically less significant than property taxes in all but a few western cities, like Phoenix, Tucson, and Albuquerque. Taxes on utilities, and direct utility revenues, also form a substantial part of big city revenues.
In addition, some cities, like New York and Philadelphia, also have income or wage taxes that generate significant revenues. Typically smaller jurisdictions are not granted the authority to levy these taxes, and many would not want to anyway, given the fears of repelling businesses and wealthier individuals. Indeed, Haughwout, Inman, Craig, and Luce (2004) estimate that the elasticity of earnings in cities with respect to the tax rate is so high that income tax rates quickly become counterproductive for producing revenue.
While there is a great deal of disparity in the revenue sources and spending patterns of local governments, local governments do tend to share a fair amount of authority over the built environment and business formation. The right of localities to regulate structures predates the US constitution. Indeed, Novak (1982) argues that the view of ![]() century America as a laissez-faire nation is mistaken, because there was so much regulation going on at the local level. Fire-related building regulations were common in American history for quite understandable reasons.
century America as a laissez-faire nation is mistaken, because there was so much regulation going on at the local level. Fire-related building regulations were common in American history for quite understandable reasons.
The Progressive Era saw a great spread of local regulations of both businesses and structures. New York City imposed the first citywide zoning plan in 1916, which was focused largely on preserving light by requiring building setbacks. Zoning that restricted uses of land to commercial, residential, and industrial purposes in different parts of the city became widespread (apart from Houston) after the Supreme Court deemed it legitimate in the Euclid Case (hence Euclidean Zoning). Every city, including Houston, engages in some form of control over land use.
While there are a number of studies that claim that local land use restrictions can severely distort property values and urban growth (e.g., Glaeser, Gyourko, & Saks, 2005), it also seems clear that there is a great deal of heterogeneity in the severity of these restrictions across space. Typically, large cities are less restrictive than their suburbs (Gyourko, Saiz, & Summers, 2008). Cities with less restrictive building environments tend, unsurprisingly, to have more housing and population growth (Glaeser & Gyourko, 2009) and lower housing prices. Only recently have some locations begun to directly monetize their permitting power by charging explicit impact fees for new projects.
Urban governments also typically have the power to restrict new business formation, particularly if that business has any health consequences. Restaurants and bars, for example, usually require licenses, although sometimes the authority to issue those licenses is lodged at the state, rather than the local level. Business owners often complain that individual cities are extremely hard to start a business in, but so far there is little cross-city research comparable to the cross-country work on the ease of starting a new enterprise and this is a pressing area for empirical work.
While the economics literature on local public finance has been considerably less developed in Europe than in the United States, there have been a number of fine survey essays highlighting the key features of local public finance in several European countries. For example, Friedrich, Gwiazda, and Nam (2003) discuss the public finance systems in Germany, Switzerland, Poland, and the United Kingdom, and provide comparisons in the share of spending done by local governments across the developed world. Municipal governments in France, for example, spend only 5.5% of GDP, but in Sweden local government spending accounted for 27.5% of GDP, which reflects both the large role of local governments in Sweden and the relatively large size of the Swedish state.
But the size of local government spending often provides a relatively misleading characterization of the overall importance of local governments, because that spending may be significantly constrained by central government. Ebel and Yilmaz (2003) sagely warn of the difficulties of using simple measures to capture the degree of fiscal decentralization. These empirical difficulties make cross-country work on local public finance (see, e.g., Mello, 2000) extremely complicated.
If anything, local public finance becomes even more difficult in the developing world, where institutional arrangements are often even more opaque. Moreover, these political institutions are notably fluid. For example, China has moved from having an extremely high level of political centralization, during the 1970s and earlier, to allowing considerably more local autonomy. Yet it is hard for outsiders to really understand how much freedom of operation actually exists at the local level in the People’s Republic. India, typically, has fairly strong states but quite weak governments within those states.
Latin America has historically had many highly centralized governments, such as Chile (Glaeser & Meyer, 2002), but it also has provided some textbook examples of the problems that can result from fiscal decentralization. Argentina, famously, allowed provincial governments to borrow by issuing obligations that became national government debts (Kruegar, 2002). Brazil’s decentralization has also led to significant amounts of subnational debt and a number of other problems (Dillinger & Webb, 1999).
On one level, the dizzying array of local governmental institutions across the world should make international comparative work on fiscal federalism enormously enlightening. However, there are so many ways in which institutions differ that the international literature on local public finance has been slow to mature. Often the best work (like Dillinger & Webb, 1999) focuses on just two countries, so that the authors can acquire the rich institutional detail that is necessary to say anything useful.
Moreover, it is unlikely that institutions have a homogeneous impact throughout the world. More decentralization is likely to be beneficial in some areas, and less so in others. Certainly, the competence of the federal government, the strength of local social institutions, and the advantages that are likely to accrue from local variety will all play into the benefits of localization and these certainly differ internationally. So, while the theory of urban public finance should hold internationally, it is likely to be most commonly used within particular large countries.
3 The Core Economics of Urban Government
Before turning to the key empirical findings on urban public finance, this section discusses the core economics of cities and their governments. I begin with discussing why cities exist and then turn to the externalities that are so common in dense communities. Those externalities explain why cities governments emerged early. The final subsection discusses local vs. higher control over public functions in cities.
3.1 The Formation of Cities and their Economies
At their core, cities are the absence of space between people and firms. They are defined by their density. They exist because people either want to be close to each other or close to some fixed geographic characteristic that exists in a place, such as a port, a court, or a coal mine.
Historically, urban theory can be roughly split into agglomeration-based theories of cities and everything else. Agglomeration-based theories, which were clearly described in Marshall (1890) and formalized by Krugman (1991) among others, explain the rise of cities with purely endogenous factors, such as the desire to eliminate the costs of transporting goods, people and ideas. As it is costly to ship products over space, firms cluster in one area. The concentration of potential employers in a place provides a form of insurance for workers who can easily find a new job if their employer has an idiosyncratic shock (see, e.g., Diamond & Simon, 1990)—the resulting matching of worker-to-firm enhances overall productivity. Some recent theories have borrowed from Marshall (1890) and Jacobs (1968) and emphasized the role of spatial proximity in facilitating learning and innovation (Duranton & Puga, 2005; Glaeser, 1999).
While these agglomeration theories now dominate the literature, they are not the only theories of urban concentration. Indeed, the simplest theory of urban density is that an area has an exogenous advantage and people come to be close to that advantage. Those urbanists who claim that geography can explain the location of certain cities have often been derided as geographic determinists, but it is not obvious that they were historically wrong. Waterways played an outsized role in determining the growth of American cities, because shipping was so much cheaper over water than by land. In 1900, every large American city was on a waterway, and Bleakley and Lin (2010) finds that the fall lines of rivers still greatly predict urban density today.
Harbors and agglomeration effects are two economic forces that drive city size, but politics also matters. Cities from ancient Rome to modern Kinshasa have been shaped by powerful central governments that have disproportionately favored residents close to the corridors of power. People cluster around kings and courts, especially when those leaders provide either favors or safety. The tendency of a single mega-city (the capital) to dominate a country’s urban form is much stronger in dictatorships than in stable democracies (Ades & Glaeser, 1995) which may reflect the tendency of democratic regimes to check the favoritism shown to the capital city.
Indeed, American political history shows an acute awareness of the potential advantages going to the capital city and repeated attempts to restrain that tendency. For example, many states and the country as a whole located their capitals far away from large, existing urban centers. One reason for that decision was to limit the flow of funds to any existing city. Other British offshoots, but not Great Britain itself, such as Canada and Australia, also chose to locate their capitals away from large cities for similar reasons. In addition, institutions, such as the Senate, explicitly favored less populous areas within the US.
The fact that cities reflect both innate production advantages of a place and agglomeration economies often complicates the task of actually estimating the economic advantages of density. If people move to areas where productivity is innately greater, then regressing productivity on density will yield biased results. The empirical problem is only exacerbated by the fact that more innately able people may sort into higher density locales.
Scholars have attempted to improve on cross-sectional estimates of the density-productivity relationship in three ways. First, they have used historical variables like density or rail networks in the ![]() century (Ciccone & Hall, 1996). This approach is valid only if these instruments are themselves uncorrelated with omitted productivity or individual ability levels, which is of course debated. Agglomeration economists argue that harbors may have mattered in the
century (Ciccone & Hall, 1996). This approach is valid only if these instruments are themselves uncorrelated with omitted productivity or individual ability levels, which is of course debated. Agglomeration economists argue that harbors may have mattered in the ![]() century but are essentially irrelevant today. A similar approach is followed by Rosenthal and Strange (2008) who use geographic variables, such as bedrock, that make it easier or harder to build up as instruments for density and estimate sizable agglomeration effects.
century but are essentially irrelevant today. A similar approach is followed by Rosenthal and Strange (2008) who use geographic variables, such as bedrock, that make it easier or harder to build up as instruments for density and estimate sizable agglomeration effects.
A second approach estimates urban area effects with individual fixed effects looking at the wage changes for migrants (Glaeser & Mare, 2001). These approaches may be able to eliminate some of the impact of omitted individual ability, yet it does little to distinguish between agglomeration economies and omitted area-level productivity variables. Glaeser and Mare do however argue that urban wage pattern for migrants, which shows little immediate wage gain for new migrants but faster wage growth over time, is probably more compatible with a learning-based agglomeration theory than any geographic advantage-based model.
The third approach examines the impact of a seemingly exogenous increase in local employment on the wages and productivity of other works in the city. Greenstone, Hornbeck, and Moretti (2010) use the location decisions of million dollar plants and compare areas that attract these plants with their competitors that just lost. They also estimate sizable agglomeration economies. The natural criticism against this type of work is that winning the plant may not be orthogonal to unobserved area-level characteristics. Kline and Moretti (2011) demonstrate the impact of the Tennessee Valley Authority on manufacturing development and estimate that these effects also suggest significant agglomeration economies. While any one approach is certainly subject to many criticisms, personally, I tend to find the mass of evidence that agglomeration economies exist, taken as a whole, to be fairly compelling, but taking the opposite view is not unreasonable.
Moreover, the selection of people into cities is not obviously a huge confound, at least based on observables, because cities seem to attract a wide variety of residents. In particular, they tend to attract people at both the top and bottom of the human capital distribution (Glaeser, Resseger, & Tobio, 2011). Inequality tends to be higher in denser areas. There has been relatively little written on the attraction that some rich people have for cities. The presumption is that they are there to take advantage of urban agglomeration economies, but it is also quite possible that many of them enjoy the consumption advantages made possible by urban scale, density, and occasionally historic investments (Glaeser, Kolko, & Saiz, 2001). Much more has been written on the urbanization of the poor.
Poverty rates are typically higher inside cities than in suburbs. Glaeser, Kahn, and Rappaport (2008) find a 10% difference in poverty rates in the 2000 Census. Becker (1965) provided one explanation for this tendency. If the income elasticity of demand for land is sufficiently high, then rich people will tend to live where land is cheap outside the urban core and poorer people will live closer to the center. Glaeser et al. (2008) argue that the income elasticity of demand for land is actually pretty modest, and that access to public transit is a dominant force explaining the urbanization of poverty, at least within the United States.
Cities have also traditionally been magnets for immigrants. Public transit may be one reason for the attraction of cities to recent migrants, but there are surely many other factors. Ethnic neighborhoods have traditionally been gateways into a new country. Urban governments have also often been friendlier to immigrants than suburban areas.
These arguments rely on purely economic factors, but social and political forces also help explain the urbanization of poverty. America’s system of local schooling, for example, pulls many wealthier parents outside of cities. If there is any local tendency to want to locate near similar people, this will exacerbate the power of public transportation or the demand for land. No matter what the cause, cities will continue to have to struggle with their tendency to attract poorer people. The massing of poverty in cities can exacerbate the great challenge of urban externalities, which are discussed next.
3.2 Urban Externalities
When people locate near one another, externalities become more severe. Human noise and refuse, accidental fire, and bacteria will inflict more damage on people who are close than people who are distant. Transportation becomes more difficult on crowded city streets. Crime becomes easier when there are more targets. Addressing urban externalities is the core function of city government, and historically the fight against blights like contagious disease and fire have consumed much of the public sector’s energy in cities.
The most important role of urban government is to provide clean water, for if the water supply becomes polluted death occurs on a large scale. Even the recent history of cities is replete with outbreaks of cholera and yellow fever, which are water-related diseases.4 Major cities have typically been built on rivers, for transportation purposes, but those rivers may not provide a clean source of water, at least once the city population also starts using the river as a dumping spot for refuse. At low population levels, wells can then supplement rivers and, indeed, Boston’s location south of the Charles River owes something to the presence of a usable well. But again, if waste is not properly disposed of, wells can also become easily infected. The signal triumph of modern epidemiology occurred when John Snow traced a London cholera epidemic in 1854 to a water pump that was dispensing disease.
In principle, especially in advanced economies, one could imagine the water problem being essentially handled by private providers. Companies can and do sell clean water and many consumers are willing to pay for water that is not infected. Yet there are three principal reasons why private water provision historically failed to eradicate disease: (1) information asymmetries; (2) contagious disease externalities; and (3) large returns to scale in major infrastructure provision. The quality of water has historically been fairly hard to assess and that means that private providers will often have an incentive to provide dodgy water and claim that it is clean.
In some cases, reputational concerns may be enough to guard against this tendency, but the highly imperfect link between bad water provision and disease limits the power of this reputation mechanism in settings where testing is difficult. In addition, individual consumers do not face the right incentives to buy clean water, since they bear only the costs of disease on themselves, not the costs their illness may impose through contagion on the rest of the city. Finally, the vast scale required for investments, like aqueducts, has been beyond the scope of most private investors historically.
A growing literature is focusing on the impacts of clean water in the US and elsewhere. Troesken and Geddes (2003) have done impressive work showing the health benefits of municipal water provision in early ![]() century cities; African-Americans particularly benefitted from the public provision of water. Ferrie and Troesken (2008) document that Chicago’s investments in water made a significant impact on that city’s mortality transition, causing reduction in a wide range of diseases, even those that are not waterborne. Figure 3 shows the remarkable reductions in mortality within New York City, which have typically been associated with the decline in communicable diseases, many of which are water related. Gamper-Rabindran, Khan, and Timmins (2010) find that piped water significantly reduces infant mortality in modern Brazil.
century cities; African-Americans particularly benefitted from the public provision of water. Ferrie and Troesken (2008) document that Chicago’s investments in water made a significant impact on that city’s mortality transition, causing reduction in a wide range of diseases, even those that are not waterborne. Figure 3 shows the remarkable reductions in mortality within New York City, which have typically been associated with the decline in communicable diseases, many of which are water related. Gamper-Rabindran, Khan, and Timmins (2010) find that piped water significantly reduces infant mortality in modern Brazil.
Figure 3 The Reduction in Mortality in New York City Over Time. (Source: Figure is by courtesy of the New York City Department of Health and Mental Hygiene (http://cjrc.osu.edu/researchprojects/hvd/usa/nyc/).)
The large expense of water investments creates a close tie between municipal public finance and clean water. Cutler and Miller (2006) argue that widespread water improvements only became possible as American cities got robust access to credit markets in the early ![]() century. They point out that American cities in the early
century. They point out that American cities in the early ![]() century were spending as much on clean water as the federal government was spending on everything except for the post office and the army.
century were spending as much on clean water as the federal government was spending on everything except for the post office and the army.
Cities continue today to be involved with water and sewage by management. Even when these utilities are private, they are highly regulated, both for safety reasons and because they are often seen as natural monopolies. It remains an open question whether private utilities and city governments are spending enough to maintain this infrastructure and certainly some critics allege that they are not.5
While city hospitals are also tools for diminishing the negative externalities associated with disease, their origins lie in charity or redistribution rather than fighting urban externalities. In the ![]() century, wealthier people received their health care (such as it was) at home, while public hospitals, such as New York City’s Bellevue, had their origins as almshouses for the poor. In some cases, city hospitals, such as New York’s Riverside Hospital on what is now called Roosevelt Island, were used to isolate the ill and reduce the spread of contagious diseases like typhoid. Nevertheless, I will address city hospitals at greater length when I turn to the topic of cities and redistribution.
century, wealthier people received their health care (such as it was) at home, while public hospitals, such as New York City’s Bellevue, had their origins as almshouses for the poor. In some cases, city hospitals, such as New York’s Riverside Hospital on what is now called Roosevelt Island, were used to isolate the ill and reduce the spread of contagious diseases like typhoid. Nevertheless, I will address city hospitals at greater length when I turn to the topic of cities and redistribution.
Traffic congestion is another primary urban externality and it has existed far longer than automobiles. The provision of public pathways is a classic form of government. Again, in principle, such roads could be provided privately and some private turnpikes have certainly existed. Yet the fragmented nature of land ownership means that hold-up problems can easily occur, such as the classic case of robber barons that extorted travelers on their roads. Moreover, lightly used, unpaved roads are close to being public goods. They are non-rival, when used lightly, and the cost of charging consumers was high relative to the value of the service.
The public nature of roads meant that cities were closely involved with the private entrepreneurs who initially brought public transportation to cities. America’s first omnibus ran in New York City in the 1820s, and at the point it seemed to be a small business that was naturally a private sector activity. Initially, the earliest transit systems had none of the large scale economies that later helped create local monopolies. No one could advocate for subsidizing public transit to reduce the congestion externalities from driving, since the primarily alternative was walking. The early omnibuses seemed like conventional private sector enterprises, except for the fact that they used publicly owned city streets.
Omnibus operators were soon eager to lay down rails to ease the path of their horse drawn carriages. Later in the ![]() century, private entrepreneurs, like the Wideners in Philadelphia, Jay Gould in New York City, and Charles Yerkes in Chicago, laid more extensive systems over existing public thoroughfares. While these systems were not typically given overt subsidies, transit operators often managed to appropriate formerly public spaces for nominal costs. Allegations of corruption were ubiquitous.
century, private entrepreneurs, like the Wideners in Philadelphia, Jay Gould in New York City, and Charles Yerkes in Chicago, laid more extensive systems over existing public thoroughfares. While these systems were not typically given overt subsidies, transit operators often managed to appropriate formerly public spaces for nominal costs. Allegations of corruption were ubiquitous.
In the ![]() century, these private operations faced tougher fee regulations and lost riders to competing modes of transport. In city after city, transportation became public. Today, public transit systems are typically separate from local government itself, but they still impose significant costs on taxpayers as well as riders. Even the federal government started subsidizing urban transit after the Federal Highway Aid Act of 1973. While these subsidies have been justified as a tool for fighting traffic congestion, Baum-Snow and Kahn (2005) have found that new subway stops typically have had a minimal effect on the share of population commuting by car to work.
century, these private operations faced tougher fee regulations and lost riders to competing modes of transport. In city after city, transportation became public. Today, public transit systems are typically separate from local government itself, but they still impose significant costs on taxpayers as well as riders. Even the federal government started subsidizing urban transit after the Federal Highway Aid Act of 1973. While these subsidies have been justified as a tool for fighting traffic congestion, Baum-Snow and Kahn (2005) have found that new subway stops typically have had a minimal effect on the share of population commuting by car to work.
While the logic of having free public roads for low density communities is easy to see, the practice of free road use can lead to problems as urban densities increase. Since individuals do not internalize the externalities created by their travel on others, the roads can become overused and slow to a crawl. Rotemberg (1985) provides a classic analysis of the economics of traffic jams.
The most typical means of addressing traffic congestion is to build more roads, yet this approach creates a behavioral response that can easily undo the benefits of new construction. Duranton and Turner (2009) empirically investigate the “fundamental law of road congestion,” which says that vehicle miles traveled increase one-for-one with highway miles built. That law suggests that construction on its own is unlikely to eliminate the congestion externality, at least at reasonable levels of construction. Likewise, subsidizing alternative modes of transport is, on theoretical grounds, a highly inefficient means of reducing traffic congestion, and empirically does not seem to solve the problem (Baum-Snow & Kahn, 2005).
Economists since William Vickrey have typically advocated some form of congestion pricing to induce drivers to internalize the costs of these externalities. These schemes can reduce congestion considerably, as seen in Singapore and London. Yet they are often politically unpopular and have met with little success in the United States. New York City’s attempt to introduce a congestion charge was stymied by the state legislature.
Instead, cities have turned to alternative tools such as lanes dedicated to cars with more than one or two commuters. Outside the US, cities have used schemes such as allowing cars with odd license plates to drive on some days and cars with even license plates to drive on other days. Rarely have these plans been seen as significant success stories.
Perhaps the most draconian tool that cities have used against congestion is to limit the physical crowding of the city with building regulations. In the ![]() century, fire was fought, in cities like St. Louis, by regulations that limited the use of wood in construction. During the Progressive Era, it became more common to require ventilation in buildings to prevent the spread of disease. Euclidean zoning, which restricted industrial uses in residential areas, was also meant to improve urban health. Finally, as land use restrictions became stricter, height requirements became tools that were limiting the overall growth and density of the city.
century, fire was fought, in cities like St. Louis, by regulations that limited the use of wood in construction. During the Progressive Era, it became more common to require ventilation in buildings to prevent the spread of disease. Euclidean zoning, which restricted industrial uses in residential areas, was also meant to improve urban health. Finally, as land use restrictions became stricter, height requirements became tools that were limiting the overall growth and density of the city.
The limits on building do seem to have had a significant impact on urban growth and pricing. Glaeser et al. (2005) argue that without these restrictions, the cost of an apartment would be close to the physical cost of building up, since higher construction does not typically require any more land in the absence of land use regulations. They estimate that these restrictions have effectively doubled the cost of a Manhattan apartment, which can be seen as the effective “congestion tax” being imposed on people who want to live in the city. They also argue that this “tax” seems far too high relative to the externalities that might occur in the city.
Building heights also relate to crime, as street crime appears to be higher in lower income neighborhoods with taller buildings (Glaeser & Sacerdote, 2000). Crime is not a classic externality, but it has many of the features of congestion and contagious disease. It imposes costs on people who are not criminals and it is typically more severe in cities (Glaeser & Sacerdote, 1999). The maintenance of rule of law is a central role of government, and this remains a significant function for many cities.
The historian Erik Monkonnen provides us with a long time series of murder rates in New York City, which gives us a sense of the changes in that most serious form of crime over time. Figure 4 shows the long time series of murder rates, which experienced tremendous volatility during the ![]() century. As the police force became professionalized, murder rates declined in the first decades of the
century. As the police force became professionalized, murder rates declined in the first decades of the ![]() century and then soared again after 1960. Cullen and Levitt (1999) estimate the rising crime levels reduce urban growth, and the dangers in our cities may have been one reason for their post-1960 decline.
century and then soared again after 1960. Cullen and Levitt (1999) estimate the rising crime levels reduce urban growth, and the dangers in our cities may have been one reason for their post-1960 decline.
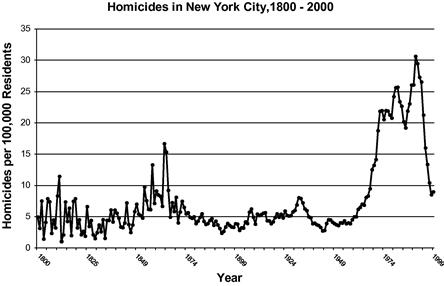
Figure 4 Homicides in New York City, 1800–2000. Data from the Homicide in New York City database, assembled by Erik Monkonnen (http://cjrc.osu.edu/researchprojects/hvd/usa/nyc/).
While the high crime rates of the 1970s made cities seem ungovernable, there have been significant improvements in safety since then. Levitt (2004) looks at the crime decline in the 1990s and argues that increased expenditures on policing and high incarceration rates help explain the drop. It is possible that improvements in policing techniques were also helpful. While the decline in big city crime is hardly the only reason why many cities have experienced comebacks, increased spending on safety did help people to see cities as places of pleasure rather than fear.
3.3 Decentralization and Local Government
While the existence of urban externalities means that cities often need government, it is not necessarily obvious that they need local government. Services could be provided by either state or federal governments, and indeed, in many parts of the world higher levels of government manage many of the affairs of their urban areas. Even within the US, particular city services, like policing, have occasionally been run by state governments. In 1857, for example, New York’s state legislature abolished the municipal police board and was replaced with a state-appointed metropolitan police board, which led to a pitched battle between the two police forces in front of City Hall. Transit systems have been administered by state-appointed officials. In extreme cases, the fiscal distress of particular cities has led to a complete takeover by state-appointed control boards.
Economists have long actively debated the relative merits of decentralized control; Oates (1999) provides a classic summary. Tiebout, most famously, emphasized the benefits of local diversity which enables citizens to vote with their feet and choose the public services that fit their own needs. Alesina, Baqir, and Easterly (2004) find that more racially and financially heterogeneous counties have split into more school districts. Oberholzer-Gee and Strumpf (2002) provide support for Tiebout by documenting that states with more heterogeneity in local preferences have decentralized control over alcohol policy. Besley and Coate (2003) emphasize that this argument presupposes some limit to the benevolence, or competence, of a national government. If a national government had the right incentives and abilities, it could produce the same city services that are currently provided by local governments. It could allow the same spatial heterogeneity that now exists in service levels. This work reminds us that incentives and information are crucial ingredients in any theory of decentralized control.
In reality, it is often quite difficult for the federal government to allow all that much local diversity in its programs. One could plausibly argue that higher density areas need more schooling assistance, while lower density areas need more help with roads. Yet legislative realities mean that transportation and other budget items are handled as a bundle, which means that cities received public transit support in an attempt to create more support for national highway spending. Moreover, it would be extremely difficult to have different federal tax rates for different areas in order to finance the different levels of desired government spending.
Given that city governments grew large before the federal government had a major peacetime role, it is perhaps more reasonable to ask about whether it makes sense to centralize authority given that starting point. Before the rise of the federal government, there seemed to be several attractive elements to America’s decentralized system. There was certainly considerable heterogeneity in the size of government across space, and local taxpayers typically paid for their government themselves. This created a certain pressure to ensure that funded services delivered meaningful benefits.
Highly localized governments may also have been more in touch with their constituents and their interests. Urban machines catered to the poorer citizenry, and especially the needs of recent immigrants. Reform and good-government groups were more likely to be favored by wealthier citizens. In some cases, relatively localized power structures have made it easier for local groups to influence decision-making. The local nature of government also meant that governments themselves often had relatively good information about local conditions. When he was a police commissioner, Theodore Roosevelt would prowl New York City’s streets looking for policemen who were shirking at their jobs.
Despite these seeming advantages, local governments were increasingly seen as inadequate by reformers including abolitionists, populists, progressives, and New Dealers, and there are several arguments that favor centralization. Larger scale governments may attract more talented leaders and enable those leaders to influence a wider range of locations. Boffa, Piolatto, and Ponzetto (2012) present a model where there are decreasing returns to voter information. More informed voters discipline leaders by voting corrupt ones out, as shown in Brazil by Ferraz and Finan (2008), but this has less of an impact as information increases since leaders have fewer rents to forego when they are ousted. If localities have heterogeneous levels of informed voters and the relationship between information and good political behavior is concave, then Jensen’s inequality implies that the level of discipline rises when politicians are elected by larger jurisdictions, since multiple jurisdictions average out local heterogeneity.
Perhaps the most egregious failing of localized authorities is that they are poorly set up to accomplish redistributive goals. If a locality tries to heavily redistribute, then wealthier citizens and businesses have an incentive to flee. In a sense, there is a fiscal externality because the generosity of one jurisdiction attracts beneficiaries from other jurisdictions thereby reducing the fiscal burden on the taxpayers of those other jurisdictions (Wildasin, 1991). More often, the local government just fails to achieve these redistributive aims.
Likewise, in the ![]() century, attempts to redistribute income increasingly involved the national government. The populists wanted redistribution through bimetallism, but during the New Deal, the government embraced a more extensive program of social welfare, which required federal action. One side benefit of this federalization is that an increasingly bureaucratic system involved more paper work and ultimately less corruption (Fishback, 2007). When the welfare state expanded during the war on poverty, federal intervention into local matters, like housing, expanded as well. When Richard Nixon tried to move away from the welfare state, he championed “New Federalism” meant to return power to more local governments. If local governments do not want to attract poorer people, then local control may mean less redistribution, since less generous systems may be one way to repel the poor.6
century, attempts to redistribute income increasingly involved the national government. The populists wanted redistribution through bimetallism, but during the New Deal, the government embraced a more extensive program of social welfare, which required federal action. One side benefit of this federalization is that an increasingly bureaucratic system involved more paper work and ultimately less corruption (Fishback, 2007). When the welfare state expanded during the war on poverty, federal intervention into local matters, like housing, expanded as well. When Richard Nixon tried to move away from the welfare state, he championed “New Federalism” meant to return power to more local governments. If local governments do not want to attract poorer people, then local control may mean less redistribution, since less generous systems may be one way to repel the poor.6
Today, cities are still entwined in a number of social welfare programs that are federally funded but that operate at the local level. Cities typically have housing authorities which interact with the federal government in the operation of housing projects and the administration of Section 8 housing vouchers. Medicaid provides significant funds for city hospitals. These systems are cobbled together to allow local management and federal largesse.
The federal government’s role also expanded because of perceived interjurisdictional externalities often linked to transportation infrastructure. While the Erie Canal was itself an undertaking of New York State, the federal government itself began funding later canals and federal support for such infrastructure projects was a major plank of the Whig party. When the Republicans took over this aspect of Whiggery, the intercontinental railroad system was subsidized with grants of federal land. Starting in the 1920s, and the expanding radically in the 1950s, the federal government began to pay for a national highway system.
While these federal interventions are easy to justify as means of solving coordination problems between jurisdictions, they also remind us that there can be costs of moving expenditures to the federal level. As the gap between a project’s beneficiaries and its funders increase, it becomes increasingly possible to fund very expensive projects that yield relatively little benefit. For example, it is impossible to imagine that Detroit would have funded its People Mover Monorail without federal aid. Given that system’s low ridership levels, non-funding would have surely been the right answer. Transportation projects have only rarely been subject to cost-benefit analysis at the federal level which reinforces suspicions about their wastefulness.
The Interstate Highway System, seemingly the poster child for benevolent federal intervention in infrastructure, has itself been subject to heavy criticism. Many urbanists have argued that highways have badly damaged the cities that they were supposed to serve. Baum-Snow (2007) found that a city’s population declined on average by 18% when two rays of a highway were built into its center. While the decline of urban population is by no means proof of inefficient infrastructure, the Office of Management Budget relates that highway “funding is not based on need or performance and has been heavily earmarked.”7
Between 2009 and 2012, spending on local infrastructure has been tightly tied to moves to reduce recession. For economists who believe in Keynesian anti-recessionary spending, there are good reasons to think that localities will be unlikely to perform the right level of stimulus on their own. If generating extra aggregate demand creates nationwide externalities, these are unlikely to be internalized at the local level.8 This provides one explanation why the federal government’s share of total expenditure soared during the Great Depression and has risen during the recent downturn.
The potential cost of these interventions is that the federal government may not spend in ways that deliver social value at the local level. Again, the Besley and Coate (2003) insight remains—a fully capable and benevolent government would not have such problems. But it is certainly possible that a federal government, facing strong incentives to move money quickly, might spend in ways that are not particularly valuable. The willingness of some states to walk away from proposed federal spending for high speed rail is just one example of a federal project that does not seem well matched to local needs.
The problems of inefficient spending may be mitigated if the federal government acts primarily by giving money to localities and letting them spend as they like. Indeed, recent federal largesse has helped states and cities face budget shortfalls created by the downturn. One potential cost of this approach is that it means that local governments have less incentive to budget for the future.
While it may be easy to laud the benefits of local control, one potential cost of decentralization is that segmentation of the population along race or income. Indeed, Tiebout clearly thought that certain types of segregation, based perhaps on the tastes for public services, were highly desirable. But it is less clear that all forms of segregation are so benign. Cutler and Glaeser (1997) show a strong correlation between the degree of political fragmentation and racial segregation across metropolitan areas and find that African-American outcomes are relatively worse in more segregated areas. For equity reasons, it may also not be desirable to have wealthier children segregated from poor children because of heterogeneity in local school districts. Local control will inevitably mean some degree of sorting and that surely has both benefits and costs. I now turn to a formal model of the financing and provision of core urban services.
4 A Model of Local Government Spending and Finances
I now turn from facts about government finance and spending, and theories about agglomeration economies and negative externalities to a simple benchmark model that nests several of the key results in local public economics. Initially, I assume homogeneous consumers and then extend the model to allow human capital heterogeneity so that I can discuss local redistribution and selective migration across space. In the model, individuals first choose locations and then choose housing quality, effort levels, and an “interactive action” that will impact their neighbors, like driving, which enables me to address local externalities.
Equilibrium in urban models requires three different equilibrium conditions, and the behavior of the local government. Individuals must be indifferent across space or choose to live in one locale only. The costs of supplying housing must equal the price of housing. Finally, the marginal product of labor must equal the wage. I assume that the marginal product of labor per effort unit in the city is fixed at ![]() for workers of type T in city j and hence that will be the wage per unit of effort. For individuals, gross earnings equal
for workers of type T in city j and hence that will be the wage per unit of effort. For individuals, gross earnings equal ![]() , and effort will be chosen by the individual to maximize welfare.
, and effort will be chosen by the individual to maximize welfare.
In the housing market, I gloss over differences between renting and owning and assume, in this static situation, that everyone is an owner, and that everyone occupies one unit of housing, although I allow the housing to have different levels of quality. I let ![]() denote the market price of housing of quality “q” in city j and now turn to the supply decision of developers, whom I assume to be competitive.
denote the market price of housing of quality “q” in city j and now turn to the supply decision of developers, whom I assume to be competitive.
The total supply of housing space in the city equals the total amount of land in the area times the average height on that land. Contrary to the Alonso-Muth-Mills model, I assume all land within the metropolitan area is identical, which is a purely simplifying assumption. There is a fixed amount of land available in the area of ![]() .
.
The total cost of producing a building of height H is ![]() , where H is the height,
, where H is the height, ![]() denotes convex construction costs, L represents the land area bought by the developer, and
denotes convex construction costs, L represents the land area bought by the developer, and ![]() is the equilibrium price of land in city j. The cost of building also increases with unit quality and that is captured with the
is the equilibrium price of land in city j. The cost of building also increases with unit quality and that is captured with the ![]() function; I have assumed that the cost of quality is independent of height. There is also a land tax, that is paid by the developer, and captured by the term
function; I have assumed that the cost of quality is independent of height. There is also a land tax, that is paid by the developer, and captured by the term ![]() .9 I chose to embed quality in the margin to create a clearer difference between a housing tax (which will also impact the quality choice) and a land tax which, given my other assumptions, will not.
.9 I chose to embed quality in the margin to create a clearer difference between a housing tax (which will also impact the quality choice) and a land tax which, given my other assumptions, will not.
The total amount of housing space produced by the developer is HL. Since I have assumed linearity in L, there are no gains from building larger or smaller developments, which is most compatible with the perfect competition assumption. Developers will choose H, L, and q to maximize ![]() , which implies that
, which implies that ![]() , and
, and ![]() . Housing prices will equal the marginal cost of building up and land rents will equal the gap between prices and construction costs. All builders will choose the same height, denoted
. Housing prices will equal the marginal cost of building up and land rents will equal the gap between prices and construction costs. All builders will choose the same height, denoted ![]() . The convexity in the cost for building up is the force that makes the supply of housing slope upward.
. The convexity in the cost for building up is the force that makes the supply of housing slope upward.
In any locality, the government has the ability to impact the quality of life through spending on police or parks or other public services. I assume that the local amenity level is represented by the function ![]() , where
, where ![]() represents aggregate public spending, and
represents aggregate public spending, and ![]() represents the average level of the “interactive action” in the community. This amenity level is assumed to be increasing the level of public spending and decreasing in city size, because of congestion.
represents the average level of the “interactive action” in the community. This amenity level is assumed to be increasing the level of public spending and decreasing in city size, because of congestion.
If there are positive externalities from neighbors, the effect of city size on amenities could also be positive, but I will focus on the downsides of density. The locality is large enough, so that individuals do not internalize the impact of their “interactive action” on the area-level quality of life. The model is somewhat unbalanced, because I allow the possibility of disamenities of city size, which will operate by lowering quality of life, but I exclude the possibility of agglomeration economies, which would cause wages to rise with city size, as they typically do in the real world I made this choice to reduce algebra by allowing only one effect of city size, and I focused on consumption externalities rather than agglomeration economies in production, to tie the model with the externality discussion above and to reduce interactions with the tax on labor income.
The government faces a balanced budget constraint. Revenues come from a tax on labor earnings, ![]() , a tax on housing that is proportional to total housing spending
, a tax on housing that is proportional to total housing spending ![]() , a tax on land
, a tax on land ![]() , and a tax on the interactive action
, and a tax on the interactive action ![]() , which should be understood as essentially a Pigouvian tax. Those revenues will be spent on the public amenity and equal
, which should be understood as essentially a Pigouvian tax. Those revenues will be spent on the public amenity and equal ![]() .
.
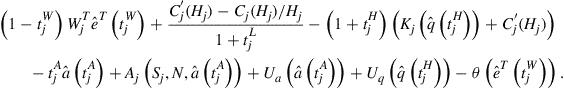
The utility of residents is separable and quasi-linear and equals:
![]() (1)
(1)
where ![]() represents unearned income for type T,
represents unearned income for type T, ![]() and
and ![]() are the welfare from housing quality and the interactive activity (which are strictly concave),
are the welfare from housing quality and the interactive activity (which are strictly concave), ![]() represents the cost of effort (which is strictly convex), and
represents the cost of effort (which is strictly convex), and ![]() represents unearned income from ownership of land. The separability assumption ensures that housing quality will be independent of changes to the land tax or the earnings tax and that effort levels will be independent of the land or housing taxes.
represents unearned income from ownership of land. The separability assumption ensures that housing quality will be independent of changes to the land tax or the earnings tax and that effort levels will be independent of the land or housing taxes.
Three first-order conditions determine the level of effort, housing equality, and amenity-related behavior: ![]() , and
, and ![]() . I denote the optimal effort as
. I denote the optimal effort as ![]() , and the optimal activity level as
, and the optimal activity level as ![]() . By using the developer’s indifference condition, we know that housing quality satisfies
. By using the developer’s indifference condition, we know that housing quality satisfies ![]() , which determines a unique value of housing quality denoted
, which determines a unique value of housing quality denoted ![]() . Differentiation tells us that every endogenous choice is strictly decreasing in the tax related to that choice. If N denotes the total population of the city, then
. Differentiation tells us that every endogenous choice is strictly decreasing in the tax related to that choice. If N denotes the total population of the city, then ![]() , and
, and ![]() .
.
Urban economists have often distinguished between “open city” and “closed city” models, and I will do so here. In closed city models, the population of the city is fixed, which means that the behavior of local governments is typically identical to the behavior of nation-states with the same preferences, tax instruments, and production technology. In open city models, the population adjusts so that welfare in the city equals the reservation utility available elsewhere. The spatial arbitrage condition is crucial in open city models, and absent in closed city models.
In closed city models, Pareto optimality typically involves choosing tax policies to maximize the welfare of residents. In open city models, the welfare of outsiders must also come into normative analysis. Developers compete away any profits in the building industry, so their ownership is irrelevant. I now consider how optimal tax and spending policies differ for closed and open city models, with homogeneous individuals.
In the closed city model I assume that the profits from land sales are shared equally among the residents of the city, so that each resident receives ![]() , which is the gap between marginal cost (which equals price) and average cost. In the closed city model, with homogeneous workers, each person’s welfare is identical
, which is the gap between marginal cost (which equals price) and average cost. In the closed city model, with homogeneous workers, each person’s welfare is identical
 (1)
(1)
Total spending equals total taxes or ![]()
![]() . This leads to the first result.
. This leads to the first result.
Claim #1a
If the city contains a fixed number of homogeneous people, and if the tax rate on land satisfies 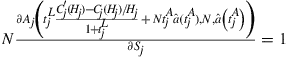 and
and ![]() , then welfare is maximized by setting the other tax rates equal to zero.
, then welfare is maximized by setting the other tax rates equal to zero.
I have specifically omitted formal proofs both to save space and to encourage students to work through the model on their own. When these conditions hold, then the derivative of welfare with respect to the other tax rates is zero, since the benefits of higher taxes (more spending on the public service) are perfectly offset by the cost (less income for private citizens). The second derivative of welfare with respect to all of the taxes is negative, so welfare is maximized when these other taxes are zero.
Claim 1 essentially represents the thinking of Henry George. If a land tax is available, then in a closed city world, then taxing land is the optimal revenue-raising tool since it is non-distortionary. George also thought that the land tax would have desirable redistributive effects, although those are not present here. The result depends on the assumption that no actor has the ability to make investments the increase the market value of land. If developers could build infrastructure that made land more valuable, or even if there were externalities from one development to the value of neighboring land, then a land tax may create distortions.
The amount of the tax should equate the marginal benefit of spending on the public service times the number of people (who all benefit from the spending) with the marginal cost of spending, which here equals 1. Local cost-benefit analysis is essentially about determining whether this equality is satisfied for any particular public project.
The land tax does little to address the externality from social behavior and that is why there needs to be a second tax on that behavior as well. A natural example of the model is urban traffic congestion, where providing an optimal level of road access would require both public spending and a congestion tax. The tax can be negative if the behavior yields a positive spillover.
As the political history of congestion pricing illustrates, political barriers may prevent policies that appear to be desirable. New York City’s attempt to introduce congestion pricing in 2007, for example, was stopped by the closed door session of the Democratic leadership of the New York State Assembly, led by Queens Representative Sheldon Silver. Queens has a significant number of middle-income individuals who drive into Manhattan. Taxing other urban externalities, like contagious disease, faces even more formidable obstacles.
If the tax on socially relevant behavior is unavailable, then there is still no use for earnings or housing taxes in this model, since earnings and housing consumption are independent of the externality creating behavior. The condition for the optimal land tax, and optimal spending, becomes: ![]() . If the behavior is harmful, so that the relevant externality tax generates positive revenues, then an inability to tax the externality will push toward higher land taxes to offset the loss in revenue from the externality-reducing tax. The overall impact on spending also depends on the sign of
. If the behavior is harmful, so that the relevant externality tax generates positive revenues, then an inability to tax the externality will push toward higher land taxes to offset the loss in revenue from the externality-reducing tax. The overall impact on spending also depends on the sign of ![]() , whether spending complements or substitutes for the social behavior.
, whether spending complements or substitutes for the social behavior.
If higher levels of the externality-related behavior increase the returns to spending, then the inability to tax the externality will increase the optimal level of overall public spending. If higher levels of the externality reduce the returns to spending, perhaps pollution makes beaches unusable, then an inability to tax the negative externality will reduce the optimal level of public spending. In the case of roads, the sign of the cross effect is unclear. Higher spending on roads may ease traffic congestion, but it also may mean that extra roads bring less benefit, because they are overused.
Land taxes may also be unused for political or administrative reasons, such as the difficulty of evaluating the value of land that sits under structures. As a historical matter, there has been relatively little willingness to tax the urban land underlying buildings, so I now turn to optimal taxation when the land tax is not available.
Claim #2a
When the land tax is set at zero, then the optimal conditions for the housing and earning taxes satisfy: 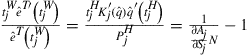 .
.
The claim follows from differentiation and it is a slight variation of the classic Ramsey rule. If ![]() denotes
denotes  and
and ![]() denotes
denotes 
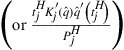 , the condition for the optimal tax on social behavior satisfies
 ![]() . This condition implies that the behavioral response elasticity for the negative social action must be higher than the behavioral response elasticity for the other commodities, since the tax is serving both to raise revenue and internalize an externality. The tax will equal the negative amenity times
. This condition implies that the behavioral response elasticity for the negative social action must be higher than the behavioral response elasticity for the other commodities, since the tax is serving both to raise revenue and internalize an externality. The tax will equal the negative amenity times ![]() which captures how elastic this behavior is relative to the other goods.
which captures how elastic this behavior is relative to the other goods.
If I assume that ![]() and that
and that ![]() , the cost of housing quality is linear just like the cost of leisure (the forgone wage), then:
, the cost of housing quality is linear just like the cost of leisure (the forgone wage), then: ![]() . The tax rates depend on the elasticities. Taxes will decline with the elasticity of one of the products (leisure or housing quality). If the two elasticities are equal then
. The tax rates depend on the elasticities. Taxes will decline with the elasticity of one of the products (leisure or housing quality). If the two elasticities are equal then ![]() will be higher than
will be higher than ![]() because flexible housing quality only represents a small part of the total cost of housing. The relatively fixed component in housing supply pushes toward greater taxation of that commodity, which may be one reason why localities have typically taxed housing more than income, although this does not explain why localities should use housing taxes more than other levels of government, since this same logic would also operate at the state and federal level.10
because flexible housing quality only represents a small part of the total cost of housing. The relatively fixed component in housing supply pushes toward greater taxation of that commodity, which may be one reason why localities have typically taxed housing more than income, although this does not explain why localities should use housing taxes more than other levels of government, since this same logic would also operate at the state and federal level.10
I now turn to the open city model. In this case, N is a parameter determined by the spatial equilibrium. In the open city model, it is more natural to assume that the profits accrue to individuals whether they move into the city or not. Property revenues should not depend on the migration decision. If the total population sharing in the land profits equals T, then each person receives ![]() , which is denoted by
, which is denoted by ![]() . Individuals outside the city receive welfare equal
. Individuals outside the city receive welfare equal ![]() , where
, where ![]() is an exogenous utility level.
is an exogenous utility level.
The spatial equilibrium requires that:
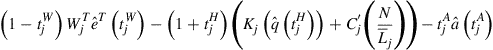 (2)
(2)
![]()
Since everyone is identical and all receive the same utility, overall utility in the city will also equal ![]() . This fact leads to one of the more curious claims in local public finance:
. This fact leads to one of the more curious claims in local public finance:
This claim is typically associated with Arnott and Stiglitz (1979) who called it the Henry George Theorem. It follows because profits per capita equal total land value divided by T. A second result follows:
This claim follows from the fact that welfare equals the reservation utility plus land values, so maximizing land value is sufficient to maximize welfare. Moreover, as land value equals ![]() , the derivative of land value with respect to any policy parameter, x, other than
, the derivative of land value with respect to any policy parameter, x, other than ![]() , yields first-order condition
, yields first-order condition ![]() , which will be satisfied when
, which will be satisfied when ![]() , or when N is maximized.
, or when N is maximized.
This fact will be useful when I turn to policy choices beyond the land tax, but in the case of the open city, there is again a result that is similar to the closed city results about the land tax.
Claim #1b
In an open city model, if ![]() and if
and if ![]() then if the land tax is set so that
then if the land tax is set so that ![]() , then welfare is maximized by setting the other tax rates equal to zero.
, then welfare is maximized by setting the other tax rates equal to zero.
The proof of this claim is similar to the proof of claim #1a. The condition for the optimal externality-related tax is the same as in the closed city model. The condition ![]() is also the same as in the open city model, but critically now I must assume that
is also the same as in the open city model, but critically now I must assume that ![]() for this spending rule to be optimal. That condition means that the tax on the externality creating behavior is also sufficient to eliminate the distortions that come from city size.
for this spending rule to be optimal. That condition means that the tax on the externality creating behavior is also sufficient to eliminate the distortions that come from city size.
One assumption that produces this result is that ![]() , so that the size of the externality equals the number of people times the average externality produced by each person. In that case,
, so that the size of the externality equals the number of people times the average externality produced by each person. In that case, ![]() and if
and if ![]() is set at
is set at ![]() , then
, then ![]() . In this case, the externality-related tax handles the population size externality perfectly, and the land tax can pay for the spending on the public amenity without creating distortions. Given these conditions, the derivative with respect to the other taxes is zero, which given our earlier assumptions related to convexity and concavity proves the condition.
. In this case, the externality-related tax handles the population size externality perfectly, and the land tax can pay for the spending on the public amenity without creating distortions. Given these conditions, the derivative with respect to the other taxes is zero, which given our earlier assumptions related to convexity and concavity proves the condition.
If there was an externality associated with city size that was not corrected for by the general tax on externality, then in principle, this externality could be handled with a lump-sum tax or subsidy on city residents. Alternatively, if the externality is negative, then this can be addressed with fixed limitations on city size, such as the growth controls that many communities have adopted. Alternatively, if more people increased the well-being of the city, then the optimal policy would be to subsidize movement into the urban area.
To see this, temporarily assume ![]() , and allow the government to impose a lump sum tax of
, and allow the government to impose a lump sum tax of ![]() on city dwellers, but assume that the tax revenues from this tax are spread evenly throughout the population. In that case, maximizing social welfare is equivalent to maximizing
on city dwellers, but assume that the tax revenues from this tax are spread evenly throughout the population. In that case, maximizing social welfare is equivalent to maximizing ![]() .
.
Claim #1c
If ![]() , then welfare is maximized if the land tax is set so that
, then welfare is maximized if the land tax is set so that ![]() and
and ![]()
![]() .
.
This claim implies that a local entity cannot reach the right population size on its own if there are positive externalities from in-migration. The subsidy for in-migration would have to come from the city’s own coffers, which would mean that there is no way to truly subsidize people who are coming to the city.11 If the city was too large, the city could, in principle, tax its own residents and transfer the funds to non-residents, but it is hard to imagine that strategy being politically palatable. A more reasonable approach toward negative externalities from in-migration would be to use land use regulations that can be used to limit N. In that case, the optimum could be achieved by just setting N at the optimal quantity and setting the land tax so that ![]() .
.
The difficulty that cities have in inducing migrants to internalize positive agglomeration effects (in consumption or production) underpins various national place-making policies (Glaeser & Gottlieb, 2008). But while economics can help create a logical role for place-specific subsidies, there are grave difficulties in actually administering such a system since we cannot adequately measure local externalities. Moreover, I have assumed that there are no externalities within the other locales, while there is every reason to expect externalities from every location. As a result, the optimal subsidy weighs the gain from moving to one place from another, and that requires policy-makers to know the relative impact of more residents in each locale.
Before turning to a multitype model, I will drop the assumption that governments have access to land taxes (or lump sum taxes) and focus on the case where revenues must come from either income and taxes that are proportional to housing values. In this case, optimal taxes again will again maximize population size.
Claim #2b
When the population is homogeneous and mobile and the land tax is set at zero, then the optimal housing and earning taxes again satisfy:  .
.
Claim # 2b implies that the optimal tax on earnings and housing wealth with a mobile population is identical to the optimal tax when the population is immobile. As a result, all of the earlier discussion remains relevant whether people are mobile. This consistency reflects the fact that maximizing the welfare of existing residents in the closed city model is identical to maximizing the size of the city in the open city model, and that is also identical to maximizing the land value and general social welfare in the open city model. Good government in a closed city is identical to good government in an open city, when workers are homogeneous, but this will not be true when there are heterogeneous workers. Just as before, the case for housing taxes, relative to income taxes, must depend on a difference in their elasticities not in anything about migration.
The importance of migration appears once I introduce individual heterogeneity, but heterogeneity must be of a specific type if it is to influence the results. One type of heterogeneity is created by heterogeneity in tastes for the locale, but identical in every other ways. To formalize that case, I assume that everyone in the city receives the baseline welfare from living in the city plus a term ![]() that represents a person-specific benefit from living in the city. This idiosyncratic benefit is distributed with density function f(.) and cumulative distribution F(.). This heterogeneity makes the supply of residents in the city less elastic, but it also complicates the social welfare function.
that represents a person-specific benefit from living in the city. This idiosyncratic benefit is distributed with density function f(.) and cumulative distribution F(.). This heterogeneity makes the supply of residents in the city less elastic, but it also complicates the social welfare function.
One simple assumption is that the social planner maximizes expected welfare across the population as a whole. In this case, welfare becomes 1/T times: ![]() , where B represents the baseline welfare in the city, apart from the idiosyncratic taste parameter and any other transfers, such as land earning and payments from a lump sum city-specific tax, which are represented with R. The term
, where B represents the baseline welfare in the city, apart from the idiosyncratic taste parameter and any other transfers, such as land earning and payments from a lump sum city-specific tax, which are represented with R. The term ![]() represents the idiosyncratic welfare for the marginal resident of the city. Since the spatial equilibrium equates welfare inside and outside the city, the first derivative of welfare with respect to any policy instrument “X” will set
represents the idiosyncratic welfare for the marginal resident of the city. Since the spatial equilibrium equates welfare inside and outside the city, the first derivative of welfare with respect to any policy instrument “X” will set ![]() . If the policy has no direct impact on transfers, but impacts transfers only by changing N, then since N is determined by
. If the policy has no direct impact on transfers, but impacts transfers only by changing N, then since N is determined by ![]() , the policy instrument will be optimal only if it optimizes baseline welfare.
, the policy instrument will be optimal only if it optimizes baseline welfare.
If the city size externality either doesn’t exist, or is multiplicative and is handled through the direct tax on the externality, or is handled through a lump sum tax on locating in the city, then the optimal condition for the land tax is again ![]() , because at that spending level, increases in N have no impact on baseline welfare plus transfers (assuming the externality has been addressed). The direct benefit of the tax on baseline welfare is exactly offset by the reduction in property earnings associated with higher property taxes.
, because at that spending level, increases in N have no impact on baseline welfare plus transfers (assuming the externality has been addressed). The direct benefit of the tax on baseline welfare is exactly offset by the reduction in property earnings associated with higher property taxes.
This framework also allows us to consider the impact of different public objective functions. Perhaps the most natural assumption is that the city government only cares about welfare in the city, which would equal: ![]() , if property is evenly dispersed. The derivative of the expression with respect to any policy variable X would yield:
, if property is evenly dispersed. The derivative of the expression with respect to any policy variable X would yield: ![]() . For policy interventions that only impact transfers through N, the total condition becomes:
. For policy interventions that only impact transfers through N, the total condition becomes: ![]() . As long as
. As long as ![]() , then optimal policy will still maximize baseline welfare and maximize N. This condition means that even though the welfare function creates an incentive to reduce population, which can increase the welfare of the average urban citizen, that effect is not strong enough to overcome the basic incentive to increase well-being in the city.
, then optimal policy will still maximize baseline welfare and maximize N. This condition means that even though the welfare function creates an incentive to reduce population, which can increase the welfare of the average urban citizen, that effect is not strong enough to overcome the basic incentive to increase well-being in the city.
The basic result on land taxes, however, depends on whether there are absentee owners or not. If property ownership is spread throughout the population evenly, then property taxes will be higher than in the previous results, because the local government doesn’t internalize the costs borne by non-residents. If property is held only by inframarginal residents, then the core result returns, where ![]() (excluding effects related to the externality), because the costs of the tax are born by urban residents.
(excluding effects related to the externality), because the costs of the tax are born by urban residents.
Results are quite different if the locality can impose a growth control that limits the size of the city. A local government that cares only about the welfare of its citizens has a strong incentive to reduce new growth, as long as the city can achieve that result without lowering welfare in the city. Typically new residents have less welfare in the city than current residents, which means that maximizing average well-being in the city leads to limits of expansion. This provides one of the possible explanations why localities may go too far, from a global perspective, in limiting the amount of construction within their areas.
A more interesting form of heterogeneity is to allow for individuals with more and less human capital. I now assume that there are two types of individuals, labeled S and U, for skilled and unskilled. I continue to assume heterogeneity in the taste for the community within groups, which is categorized by density functions ![]() and
and ![]() and cumulative distribution functions
and cumulative distribution functions ![]() and
and ![]() , for the skilled and unskilled groups respectively.
, for the skilled and unskilled groups respectively.
I assume that ![]() . Following the literature on human capital externalities, I assume that wages in the city for group S equal
. Following the literature on human capital externalities, I assume that wages in the city for group S equal ![]() and wages for U group equal
and wages for U group equal ![]() , where
, where ![]() reflects the number of skilled people in the area. The number of unskilled people in the area is denoted
reflects the number of skilled people in the area. The number of unskilled people in the area is denoted ![]() and the total populations of both groups are denoted
and the total populations of both groups are denoted ![]() and
and ![]() . I also assume that the two types have difference reservation utilities of
. I also assume that the two types have difference reservation utilities of ![]() and
and ![]() . I furthermore assume that the taste for housing quality is
. I furthermore assume that the taste for housing quality is ![]() for the U-types and
for the U-types and ![]() for the S-types.12 I assume that welfare from the amenity is
for the S-types.12 I assume that welfare from the amenity is ![]() for U-types and
for U-types and ![]() for S-types. I assume that amenities are only a function of spending and that
for S-types. I assume that amenities are only a function of spending and that ![]() ,
, ![]() ,
, ![]() , and
, and ![]() . Skilled individuals own
. Skilled individuals own ![]() units of land each and unskilled individuals own
units of land each and unskilled individuals own ![]() units of land each.
units of land each.
The new spatial equilibrium conditions for the skilled are now:
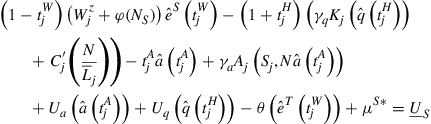 (2′)
(2′)
and the condition for the unskilled is identical except for appropriate subscripts and superscripts.
I assume a linear social welfare with potentially different weights, denoted ![]() and
and ![]() , for groups S and U respectively. If the baseline utility (excluding the
, for groups S and U respectively. If the baseline utility (excluding the ![]() terms) in the city are denoted
terms) in the city are denoted ![]() and
and ![]() and per capita transfers (land taxes and any public payouts) to each group are
and per capita transfers (land taxes and any public payouts) to each group are ![]() and
and ![]() , then total welfare can be written:
, then total welfare can be written:
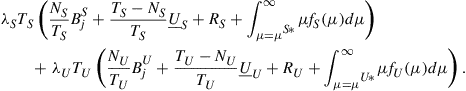 (3)
(3)
Given this welfare function, if ![]() , and if the government has access to a land tax, an externality tax, and a lump sum tax/subsidy on skilled and unskilled workers in the city, then the next claim follows:
, and if the government has access to a land tax, an externality tax, and a lump sum tax/subsidy on skilled and unskilled workers in the city, then the next claim follows:
Claim #1e
If ![]() , then if
, then if ![]() , and if
, and if ![]() , then welfare is maximized with no other taxes.
, then welfare is maximized with no other taxes.
In a purely utilitarian setting with multiplicative externalities, three taxes are necessary to maximize welfare. The tax on land must be set so that the value of cash equals ![]() times the value of spending on the public amenity. The tax on the externality must equal
times the value of spending on the public amenity. The tax on the externality must equal ![]() times the welfare cost of the externality. The subsidy to the skilled to live in the community must equal the wage benefits of having the skilled around.
times the welfare cost of the externality. The subsidy to the skilled to live in the community must equal the wage benefits of having the skilled around.
In a more complicated setting with non-utilitarian social welfare function, these basic results would go through, as long as there was some other means of redistributing income between the two groups in the country as a whole. Naturally, the human capital externality only implies a subsidy because it exists within the city and not outside. If human capital externalities were equal everywhere, there would be a case for subsidizing education as a whole, but not for providing incentives for individuals to move across areas.
I now assume that the government only has access to labor and housing taxes, which are spent solely within the city. I also admit the possibility of different welfare weights on the two groups, but eliminate the role of amenity-related externalities, letting ![]() and
and ![]() . I also assume
. I also assume ![]() . Skilled individuals own a share,
. Skilled individuals own a share, ![]() , of the land (altogether) and unskilled individuals own the remainder.
, of the land (altogether) and unskilled individuals own the remainder.
Claim 2c
If ![]() and
and ![]() then welfare is maximized when
then welfare is maximized when
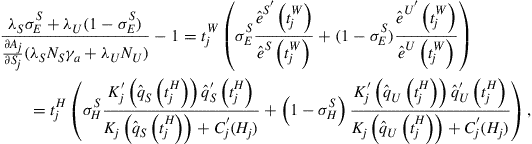
where ![]() is the share of housing spending done by the skilled and
is the share of housing spending done by the skilled and ![]() is the share of earning done by the skilled. This essentially represents a weighted version of the standard elasticity formula. The benefits are weighted by the Pareto weights and the population shares, and the costs and elasticities are similarly weighted. The key condition that generates this formula is that the welfare weights equal the migration elasticity for each group. This condition means that the migration-related reasons for favoring one or the other group are equal to the welfare-related forces favoring one or the other group. There is no particular reason why this condition should hold, as it is quite possible that the skilled are more mobile but the unskilled are valued more in the welfare equation. But this extreme case illustrates one setting where introduction migration of different groups has little impact on the overall results.
is the share of earning done by the skilled. This essentially represents a weighted version of the standard elasticity formula. The benefits are weighted by the Pareto weights and the population shares, and the costs and elasticities are similarly weighted. The key condition that generates this formula is that the welfare weights equal the migration elasticity for each group. This condition means that the migration-related reasons for favoring one or the other group are equal to the welfare-related forces favoring one or the other group. There is no particular reason why this condition should hold, as it is quite possible that the skilled are more mobile but the unskilled are valued more in the welfare equation. But this extreme case illustrates one setting where introduction migration of different groups has little impact on the overall results.
The more general formula is considerably more complicated, even with a utilitarian welfare function, which I assume. Using the notation 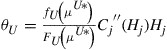 and
and 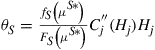 , the first-order condition for the optimal earnings tax is that
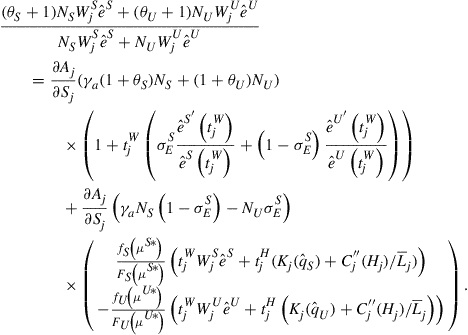
The term before the equal sign reflects the direct cost of raising taxes, where the ![]() terms essentially put more weight on the costs of the more mobile group. The first term after the equality reflects the benefits of spending more, where the benefits are weighted toward the tastes of the more mobile group through the
terms essentially put more weight on the costs of the more mobile group. The first term after the equality reflects the benefits of spending more, where the benefits are weighted toward the tastes of the more mobile group through the ![]() terms, and there is a variant of the usual effort adjustment in optimal tax terms.
terms, and there is a variant of the usual effort adjustment in optimal tax terms.
The final term is another mobility-related term. This term will be positive (and therefore raise the effective benefit of taxation) if 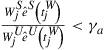 and
and 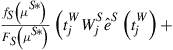

![]() . The first inequality implies that the ratio of incomes is less than the ratio of the taste for the public good between the two groups. If this inequality holds, then wealthier people actually like taxes more than poor people do, because the taxes are being spent on goods that they prefer. The second inequality gives us that increasing the attractiveness of the community to the wealthy increases total taxable income more than increasing the attractiveness of the community to the poor. This will occur as long as the rich pay more taxes, which should be generally true, and if the number of rich people on the margin of in-migrating isn’t too much lower than the density of poorer people on the margin of moving into the community.
. The first inequality implies that the ratio of incomes is less than the ratio of the taste for the public good between the two groups. If this inequality holds, then wealthier people actually like taxes more than poor people do, because the taxes are being spent on goods that they prefer. The second inequality gives us that increasing the attractiveness of the community to the wealthy increases total taxable income more than increasing the attractiveness of the community to the poor. This will occur as long as the rich pay more taxes, which should be generally true, and if the number of rich people on the margin of in-migrating isn’t too much lower than the density of poorer people on the margin of moving into the community.
If the first inequality fails, but the second inequality holds, then higher taxes will tend to repel the wealthy and this creates a break on local spending. Redistributive spending can be seen as spending on a good that the wealthy do not value at all (![]() ). In that case, the mobility of the wealthy will act as a break on local spending, and as long as the second condition holds (so the rich pay more and are not dramatically less mobile), then mobility will act as a break on local spending. This last argument provides the strongest explanation of why income taxes are likely to be less attractive at the local level than at the national level. This extra mobility effect, even when there are not human capital spillovers, will make earnings taxation less attractive because it repels the rich and they contribute more to the funding of public goods.
). In that case, the mobility of the wealthy will act as a break on local spending, and as long as the second condition holds (so the rich pay more and are not dramatically less mobile), then mobility will act as a break on local spending. This last argument provides the strongest explanation of why income taxes are likely to be less attractive at the local level than at the national level. This extra mobility effect, even when there are not human capital spillovers, will make earnings taxation less attractive because it repels the rich and they contribute more to the funding of public goods.
There is an equivalent condition for housing taxes, which finally enables a discussion of the impact of mobility on housing vs. property taxes. The housing tax will have less of an impact on the migration of the wealthy as long as housing expenditures increase less than one for one with income. Overall housing expenditure income elasticities are close to one (Glaeser et al., 2008), but much of this strong relationship reflects the tendency of richer people to live in more expensive communities. If the within-community elasticity is significantly less than 1, then this implies that property taxes will do less to induce out-migration of the rich, which may explain why localities tend to use them more than income taxes.
Using this framework as a starting point, I now turn to discuss the financing and provision of core public services.
5 The Financing and Provision of Core Urban Services
This section addresses the provision and financing of core urban services, including education, police, fire, parks, and the operational expenses of public sewage. These are areas where government intervention is typically justified because of externalities rather than redistribution (with the possible exception of education). These are also areas which typically lack a sizable substantial temporal component to them, except in the area of deferred forms of compensation like pensions, which I will address in Section 6.
I will first discuss the appropriate level of city service and then turn to the public private mix in provision. I will then discuss the financing of these services, whether through property taxes or user fees or other city-specific sources. Finally, I will address intergovernmental transfers from either the state or federal government.
5.1 The Appropriate Level of City Services
Before turning to how the services are to be provided and paid for, it would presumably be desirable to understand both the positive and normative economics of these city services. For education and crime, the normative economics have been well studied even though there is a lack of consensus. In the other areas of municipal service, the economics literature is relatively sparse, although there are certainly accepted standards for appropriate provision of fire safety and sewage. The costs and benefits of parks remain distinctly understudied.
Economists have been engaged in estimating the costs and benefits of education for over half a century (see, e.g., Wiseman, 1965). The literature has become quite sophisticated about general equilibrium effects (see Heckman, Lochner, & Taber (1998)), but there is still uncertainty about the core parameters needed for any serious analysis. There remains a moderate debate about the private returns to schooling, and a far larger debate about the social returns to schooling (Acemoglu & Angrist, 2001; Moretti, 2004). Moreover, it is not all that obvious the more spending alone achieves meaningful increases in test scores (Hanushek, 2000).
Much of the debate has moved instead toward specific institutional reforms, which are then evaluated one-by-one. For example, the remarkable effects of the Perry Pre-School Effects have led many scholars to believe that investments in early education can easily cover their costs (Belfield, Nores, Barnett, & Schweinhart, 2006). While the Tennessee STAR experiment showed that smaller class sizes can improve test scores, the economic benefits of that intervention seem closer to costs (Krueger, 2003). We are, of course, in a golden era of randomized experiments in education and while the economists evaluating these interventions are still focused primarily on what achieves results; cost-benefit analysis will surely follow close behind.
One approach to the optimal level of a public service is to rely on cost-benefit analysis; another is to trust the opinions of voters. There is also a growing literature on how much parents value school quality. For example, Black (1999) looks at property values on two sides of attendance district borders and finds that parents are willing to pay substantially more to live in areas with access to better primary schools. Hilber and Mayer (2009) argue that homeowners without children support public education precisely because it raises the value of their homes.
Overall, it is hard to come to a meaningful conclusion about whether municipalities spend too much or too little on schooling. While it is easy to point to programs, like Perry Pre-School, that have been successes, many scholars doubt the advantages of just increasing total education expenditures (e.g., Hanushek, 2003). At this point, the schooling literature is far more focused on delivering better outcomes at essentially current spending levels rather than changing the overall level of spending.
There is also a robust cost-benefit literature relative to policing and crime prevention (e.g., Welsh & Farrington, 2001). The technologies involved in policing are more transparent than schooling, so it is more straightforward to link spending on police and incarceration levels with crime (e.g., Levitt, 1996, 1997). More recent work has used federal aid for policing to provide exogenous shocks to the level of crime prevention and found significant negative effects on crime (Evans & Owens, 2007). Moreover, we have somewhat more confidence in our estimates of the social costs of crime. Typically, the big costs are associated with murder and these can rely on the extremely rich literature on the value of life. Estimates for lesser crimes are more likely to rely on hedonic estimation (Thaler, 1977) and are understandably contentious.
Cook and Ludwig (2010) present an up-to-date review of the costs and benefits of crime prevention. There take on the evidence is that “providing police departments with more funding has benefits (in terms of crime control) that are a multiple of costs.” Donohue and Ludwig (2007) make a similar claim. The advantages of increased prison sentences are far less clear, and many others (such as Donohue & Siegelman, 1998) argue that funding social programs would have more benefit on crime prevention than increased prison sizes.
While the education literature is mixed, the policing literature has a much clearer conclusion that, if anything, we are spending too little on policing. There is, however, far less consensus on incapacitation, and many are profoundly worried about the vast costs of America’s large prison population, not just on taxpayers but on the prisoners and their communities (Loury, 2009). There is also a growing literature evaluating the impact of targeted police interventions that shows significant impacts on crime in many cases (see, e.g., Braga, 2010).
There is also an old literature estimating costs of city services, such as refuse collection (Hirsch, 1965), and applying cost-benefit analysis to sewers and water systems planning (Howe, 1971). This area is extremely technical, and economists have had somewhat little to say about this in recent years. Firefighting has received even less attention, and relatively little is known about the relative benefits of adding one more firefighter. Google Scholar produced nothing on this topic, which is somewhat surprising given its importance. By contrast, there is significantly more on cost-benefit analysis of parks (e.g., Ackerman & Heinzerling, 2001–2002), but even in this case, there is relatively little that would be of use to urban planners.
5.2 The Public and Private Provision Mix
Even in cases, where public subsidy is appropriate because of externalities or redistributive reasons, there remains a profound question about whether provision should be undertaken by private or public entities. All of the key service areas have examples of both types of provision. Education is provided by fully private and charter schools, as well as public providers. Policing is provided by private security guards, such as those hired by individual buildings, shopping malls, and Business Improvement Districts. Water and sewers have been in both public and private hands, and volunteer fire departments dot the American countryside, reminding us that there are both for-profit and non-profit options in private provision.
Hart, Shleifer, and Vishny (1997) provide a framework for understanding the costs and benefits of private provision. In their model, private providers are contracted to provide some core public service, like operating a prison. The key difference between private and public providers is that the private providers have incentives to cut costs. That incentive yields the desirable effect of crowding out waste. It also achieves the less desirable effect of lowering quality. The proper role of government, therefore, is to provide those services that are likely to be severely compromised by private provision.
Their work explains the problem of private water supply in the ![]() century perfectly. At the end of the
century perfectly. At the end of the ![]() century, New York City provided the Manhattan Water Company with a subsidy—the ability to engage in banking activities—in exchange for providing more water for Manhattan. The company provided relatively little water and there were allegations about its quality, but it was quite successful as a bank, which eventually became the Chase Manhattan Bank. Troesken and Geddes (2003) show the water quality seems to have improved dramatically in the move from private to public provision.
century, New York City provided the Manhattan Water Company with a subsidy—the ability to engage in banking activities—in exchange for providing more water for Manhattan. The company provided relatively little water and there were allegations about its quality, but it was quite successful as a bank, which eventually became the Chase Manhattan Bank. Troesken and Geddes (2003) show the water quality seems to have improved dramatically in the move from private to public provision.
Does privatization actually occur when it is efficient? Lopez-de-Silanes, Shleifer, and Vishny (1997) look empirically at privatization within the US and argue that political factors, such as union power, actually explain where privatization does and does not occur. They suggest that politics explains why privatization is rare despite the cost savings that it can bring.
Advocates for privatization argue that cost savings are only a relatively modest benefit from private provision. Private provisions are also allegedly less likely to be encumbered by bureaucratic rules that hinder innovation. In some cases, the rules are restricting the level of service delivery in relatively straightforward ways. The advocates of charter schools argue that they achieve benefits through a combination of innovative methods and longer class hours, which are made difficult because of contracts with teachers’ unions.
Glaeser and Shleifer (2001) present a model of not-for-profit firms that draws on Hansmann (1981), Weisbrod (1978), and Hart et al. (1997), and argues that non-profits occupy an intermediate space between governments and the private sector. In this model, non-profits face incentives to cut costs, but these incentives are limited by the non-distribution constraint—the fact that the leaders of non-profits cannot just pocket the profits. This fact makes non-profits an attractive alternative that creates more scope for innovation than direct government provision and less incentive for quality-reducing cost cutting than for-profit providers.
While the literature on water provision in US history showed clear benefits from public provision, many papers have found that at least some charter schools have achieved remarkable successes. The key element in evaluating these schools is that successful schools are typically oversubscribed and admit students based on a lottery, which provides a random sample of treated students. Abdulkadiroglu, Angrist, Dynarski, Kane, and Pathak (2011) and Hoxby and Murarka (2009) are two of the papers documenting significant benefits from charter schools—private providers with public funding. There is also relatively positive evidence on private school provision from the school choice programs in Chile, the Netherlands, and Sweden.
Business Improvement Districts are one of the more radical privatizations of public functions in cities today. They operate within cities and take on responsibility for core urban services, like safety and street quality. They are funded with levies on businesses with the district. While there have been complaints about heavy-handed treatment of street people by BID policemen, the general view of these districts is quite positive. Studies have found that they reduce crime levels (Brooks, 2008) and increase local property values (Ellen, Schwartz, & Voicu, 2007). The fact that businesses voluntarily choose to form them and fund them makes them relatively likely to generate some value.
One concern, however, with the privatization of city services, like policing, is that this reduces the pressure on local governments to improve the general quality of public services. These concerns have been particularly serious in Latin America, where some authors have suggested that the prevalence of private security among the wealthy decreases their incentive to vote for higher taxes for security citywide. While this is a concern, there is little hard evidence that estimates the magnitude of this effect.
5.3 User Fees vs. Property Taxes vs. Alternative Means of Financing
Business districts essentially shift the costs of providing safety for an area from general tax revenues to charges imposed on the businesses that occupy that area. They operate with user fees, and such fees are one source of funding local government services. Utilities, for example, generally rely on user fees, and user fees also help pay for some portion of public transit. As discussed above, property taxes provide the main alternative source of local government funding. Local sales taxes and income taxes are also sometimes used to fund local governments. What determines the optimal mix of financing local public services?
The case for user fees is that they operate like a price and that can be helpful both for efficiency and equity reasons. The efficiency gains from user fees occur in investment, maintenance, and at the point of ultimate use. In the case of standard services, where there is a marginal cost of use (like crowding a city bus or delivering water), user fees generate efficiency at the point of ultimate use because they help deter wasteful overutilization, just like standard prices. If water is costly to provide, then charging people to use water will get them to internalize some of those costs.
One downside of user fees is just the administrative cost of charging people. For example, the London congestion system has operating costs that consume a significant fraction of the system’s revenues. We must, however, suspect that technological improvements, such as electronic road pricing, will generally make it easier to charge users at a relatively low administrative cost.
A second downside of using user fees to ration service is that this may be counterproductive if the case for public supply is based on some form of externality. In the case of water, where the externality fundamentally comes from low quality, not quantity, using prices to ration quantity seems natural and efficient. In the case of education, where the externality comes from both quantity and quality, user fees are less natural. Part of the point of public education is to induce people to get more education than they would on their own account. If individuals were charged for the full cost of education, this would eliminate a key advantage of public provision.
In the case of public transportation, theory suggests that user fees should be reduced to account for the externality in driving. It may still make sense to charge bus riders some of the marginal social costs of their transit use, but since governments do not typically charge drivers for the social costs of driving, cross-subsidizing transit is one way of reducing that externality. The subsidy should be proportional to the reduction in external social cost created by taking the bus, i.e., the reduction in the probability that the individual will drive times the social cost of driving.
User fees have value beyond individual choice. By paying providers based on usage, providers have an incentive to maintain quality. This should occur even if the government is paying with a voucher instead of the user paying out of pocket. This is one of the hopes of charter schools. User fees also create a useful discipline on investment within the political process. If projects are to be eventually funded by user fees, then the project must generate enough users to cover its costs. This will tend to cut down on white elephants, as I will discuss later in the section on infrastructure investment.
In some cases, like policing and fire, economic theory suggests that there are less likely to be social gains from user fees. In principle, it might be possible to imagine charging building owners for the firefighting costs associated with addressing a fire, but equity concerns mediate against that course. It would be politically difficult to imagine having a firefighter deliver a bill to a property owner who had just lost a child to a fire. In the case of police, the biggest benefits occur to individuals who are never the victims of a crime. As a result, it is hard to see how a user fee system could be put into operation.
Of course, it is quite possible to set fees on socially harmful behavior. In some cases, businesses are charged for the cost of a fire department visit due to a false alarm. Such fees should, presumably, create an incentive that internalizes the costs to the fire department of making such visits.
If user fees are unable to fund every service, then a tax system is necessary, and then the question becomes whether the current local dependence on the property tax is appropriate. Certainly, it is conceivable to imagine greater dependence on sales or income taxes or to follow Henry George and rely solely on a land tax. Section 4 provides the core theoretical justification for the land tax.
The primary virtue of the property tax that has made it popular for centuries is that historically, property was far more observable to local government than other forms of wealth or income. Sales transactions or earnings were hard to monitor. As such, governments relied on property taxes (or even coarser taxes based only on the number of windows). While incomes and sales have generally become much more observable, property taxes remain dominant in local governments, perhaps partially due to historical path dependence.13
But the property tax also has several key virtues for a locality. First, property is considerably less mobile than income or other forms of wealth. Even the tiniest community, like a Business Improvement District, can levy a charge based on the amount of real property in the community. That property will not just get up and walk away, while an attempt to have a neighborhood level income tax would surely lead to considerable out-migration by the wealthy.
The immobility of real property, however, does not mean that property taxes are distortion free. If we tax real estate, we create incentives not to add value by building up. A developer can deduct the price of construction from his income taxes, but property taxes are typically proportional to adjust to the assessed value of the building.
Henry George proposed one approach to this problem—taxing only the value of land, not the value of the structure on the land. In the model above, land taxes consistently produced optimal outcomes. As discussed earlier, George’s plan does face an assessment problem—the total value of a building is easier to evaluate than the value of the land under that building. The assessment problem is only increased if the tax is meant to be only on unimproved land values, so that there is no distortion to decisions that might increase the value of a neighborhood and its land. Still, it is somewhat puzzling that pure land taxes have been so rare in the United States.
While property taxes distort the incentive to construct, they do have several advantages beyond mere observability. In some cases, the value of the property may be proportional to the cost of delivering the relevant public services, like police. In that case, the property tax becomes a de facto user fee.
Additionally, the property tax makes governments sensitive to the value of local property. This creates an incentive within the government to increase the value of local homes and businesses and that may create desirable incentives (Glaeser, 1996). There is a long-standing result in urban economics that social welfare is maximized, under certain conditions, when local property values (or at least land values) are maximized (Arnott & Stiglitz, 1979; Brueckner, 1990).
The property tax is less redistributive than a progressive income tax, but it is not particularly regressive either. Typically, income elasticity of demand for real estates are estimated to be near 1 (Glaeser et al., 2008). This fact means that, on average at least, the property’s tax cost rises proportionally with income.
One key question about property taxes is whether they should have the same rates for commercial and residential real estate. In many cities, such as Boston, commercial real estate is taxed at a higher rate. While the most conventional explanation for this gap is political—votes per dollar of real estate value are higher in residential properties than in commercial properties—there are potential economic justifications for this gap. For example, if commercial real estate creates greater costs for city government than residential government, perhaps by bringing in more commuters per square foot, then the gap would be justifiable. Whatever the reason, the gap does create an incentive to convert from commercial to residential uses, which is appropriate only if the net social benefit of residential space exceeds that of commercial space.
Sales taxes and wage taxes are two other forms of revenue that are used at the local level. One argument for these forms of revenue is that they charge the users of city services, commuters, and tourists, for the costs of their actions. Of course, the users of these services are already implicitly paying some taxes, because the businesses that employ them and the restaurants that serve them are already paying commercial real estate taxes. There is too little written on whether these taxes are already appropriate.
Income taxes, of course, can be far more redistributive than sales taxes and that is one of the reasons for their attraction to many cities. The problem with local income taxes is that they potentially repel wealthier individuals (e.g., Haughwout et al., 2004). That provides one reason why many forms of local redistributive services are actually funded by higher levels of government.
5.4 Intergovernmental Transfers and Basic City Services
As discussed in Section 2, intergovernmental transfers account for about one-third of the total revenues of local governments. Historically, these transfers have been tied to specific local services, such as public housing or transit systems. In recent decades, education has become less local and had more funding from state and local sources. The federal government also began funding local police services during the Clinton Administration.
These funds can either take the form of pure transfers or they can be tied to local performance. Both No Child Left Behind and Race to the Top explicitly aimed at improving local performance by using federal aid to improve incentives. State-initiated school finance equalization schemes also create incentives at the local level that can either increase or decrease the incentives to spend on education (Hoxby, 2000).
There are two core rationales for providing funding for local governments with intergovernmental transfers: redistribution and incentives. Each of these rationales has two different variants as well. The simplest redistribution-related story is that the money is being given for a service that is targeted at the poor and the locality would not provide that service on its own. Housing support is a clear example of this phenomenon.
A second redistribution-related explanation is that intergovernmental transfers are essentially an in-kind transfer to the poor to purchase government services. When state aid to a locality is tied to the number of poor people in a community, it is as if each poor person has a voucher that helps pay for local government. The case for providing aid in this fashion, rather than with direct cash transfers, is the same as for any in-kind transfer. Either there are paternalistic reasons to encourage the poor to consume more government services, or non-poor taxpayers receive positive benefits from seeing the poor consume more government services, as opposed to other forms of consumption.
The first incentive-related explanation is that higher level of government just thinks that, for whatever reason, the locality does not have the right incentives to spend enough on a given service, such as policing. In this case, the optimal strategy would not be to just give cash grants, but to tie grants to increases in local spending. A second incentive-related explanation is that the higher level of government believes that the locality is taking the wrong actions, like retaining below par teachers or making it too hard to open a charter school. Tying aid to performance along these metrics seems to provide one means of improving performance.
The No Child Left Behind Act tied federal aid to education to performance on standardized tests. While the act has been roundly criticized, a number of academic papers have found significant test score improvements, not just on the high stakes tests (Dee & Jacob, 2011) but also on low stakes tests taken by the same students (Ballou & Springer, 2008). Reback, Rockoff, and Schwartz (2011) present a particularly comprehensive analysis of the act and find “either neutral or positive effects on students’ enjoyment of learning and their achievement gains on low-stakes exams in reading, math, and science.” These results parallel the results found on federal aid for policing found by Evans and Owens (2007).
The Great Recession that started in 2007 represents a particularly radical departure in the federal role in spending for local governments. The federal government structured its recovery support in the form of significant transfers to states and localities that enabled them to sustain existing expenditure levels without significant increases in tax rates. Essentially, the federal government has taken on the role of providing insurance against a downturn, which may be desirable if localities are unable to save or borrow enough to smooth their own spending. Still, this would seem to reduce some of the incentives that do exist for fiscal prudence at the local level. I now turn to city services and redistribution.
6 Cities, Taxes, and Redistribution
A central difference between cities and national governments is that it is relatively easy to leave a local jurisdiction. This mobility puts significant checks on local welfare systems which should tend to attract the rich and repel the poor. Since there is a redistributive element in many urban services and since the poor are disproportionately drawn to cities, this is an important element in much of urban public finance.
In this section, I will first discuss migration and redistribution, and then turn to local housing policies, and then end with public health and social services, including some redistributive elements in education.
6.1 Migration and Redistribution
How much do the poor and rich respond to financial incentives in making their migration decisions? There is a robust literature on the tendency of the poor to migrate in responses to differences in welfare payments. Before welfare reform, states typically had significant differences in maximum Aid to Families with Dependent Children (AFDC) payments. In some cases, metropolitan areas like St. Louis were split between more and less generous states (Illinois and Missouri), and those welfare gaps seemed to explain the extraordinarily high levels of poverty in higher welfare areas like East St. Louis.
More systematically, a number of papers have examined whether the migrations decisions of the poor respond to the differences in welfare payments. Blank (1988), for example, found that “[t]he probability of a typical female-headed household with little outside income leaving an area with low welfare payments and low wages can be as much as 12% points higher over a four-year period than the probability of leaving a high-welfare area.” Borjas (1999) found particularly large impacts on the location decisions of recent immigrants. Conversely, Levine and Zimmerman (1999) find “little evidence indicating that welfare-induced migration is a widespread phenomenon.”
There is a similar literature assessing whether the wealthy relocate in response to high local tax rates. Feldstein and Wrobel (1998) take what may be the strongest stance; their data suggests that behavioral responses make local redistribution essentially impossible. It is however unclear whether their findings represent migration or other behavioral responses to higher taxes. Bakija and Slemrod (2004) use income tax records and find that the “rich flee from high tax states,” although their estimated effects are modest.
Cohen, Lai, and Steindel (2011) examine Internal Revenue Service data from 1992 to 2008, and find that increases in the state marginal tax rate have “small but significant” impacts on net migration rate. Their estimates suggest that New Jersey’s “cumulative losses from increases in average marginal tax rates after 2003 (most importantly the 2004 “millionaires’ tax”) totaled roughly 20,000 taxpayers and $2.5 billion in annual income.” Young and Varner (2011) also examine New Jersey during this period. They find that out-migration of the wealthy increased after the tax increase, but note that out-migration also increased for poorer people, so their estimate of tax migration elasticities using a difference-in-difference (between over and under $500,000 before and after 2003) is tiny.
There is also a literature estimating the impact of local attempts at redistribution on business formation. Holmes (1998) looked at industrial growth in neighboring counties on opposite sides of state borders, where the states had different policies toward businesses, like Right-to-Work rules. He finds quite sizable effects of anti-business rules on industrial growth in post-war America. Carlton (1983) found negative effects of local tax rates on new business formation, and Papke (1991) found similar results for many industries. Hines (1996) and Coughlin, Terza, and Arromdee (1991) find less foreign direct investment in states with higher tax rates.
Taken together, these studies suggest that economic incentives do impact migration decisions of the poor, the wealthy, and businesses, although these migration responses may not be all that large. One reason why migration elasticities can be hard to estimate is that governments typically deliver value as well as taxing, and higher service levels may be correlated with higher tax levels. Another potential empirical confound is that only local governments with sufficient other attraction may take the risk of increasing the local tax burden on the wealthy or on businesses.
Before the New Deal, the redistribution initiated by American governments was often led by the state and local levels. The scale was modest, and urban governments seemingly understood that they had fixed assets, like a thriving harbor, that would keep businesses in the city even with some social welfare spending. Moreover, some of these policies could certainly be justified as a tool for making the city a somewhat more pleasant environment (e.g., moving sick people off the street into almshouses). With the radical transformation of the desired level of social insurance, the federal government took the lead but worked jointly with local governments to administer programs, such as those associated with the Works Progress Administration or the Federal Emergency Relief Administration.
These programs became the nucleus of the larger welfare system that would emerge in the post-war world. Aid to Families with Dependent Children, which was started under the Social Security Act of 1935, became a core means of distributing aid to poorer families, until the 1996 welfare reform. AFDC was always a hybrid federal-state-local program. The federal government set relatively minimal rules and paid for part of the program. The state exercised some oversight, either directly administering or supervising the program, and decided on the benefit level. In states that chose supervision, localities often directly administered the programs. This meant that cities did not have control over the size of the benefits, but they could often control the administrative style and efficiency of the system. As a result, localities had some ability to influence how friendly their jurisdiction was to the poor.
The New Deal also launched the federal government into the housing business in a major way and the Federal Housing Administration was another significant source of funding for urban areas. Fishback, Horrace, and Kantor (2005) claim that this spending was extensive and that it helped shape migration during the New Deal. It is one example of the local housing policies that have some connection to redistribution.
6.2 Local Housing Policies
Localities have long regulated housing, but the purpose of most pre-![]() century interventions was the mitigation of externalities, not redistribution. During the
century interventions was the mitigation of externalities, not redistribution. During the ![]() century, localities have become more aggressively involved with the production and regulation of housing, often supported by the federal government. There are three primary types of local redistribution-related interventions that have shaped urban housing markets, and often urban finances: rent control; the production of public housing and urban renewal; and the administration of housing vouchers.
century, localities have become more aggressively involved with the production and regulation of housing, often supported by the federal government. There are three primary types of local redistribution-related interventions that have shaped urban housing markets, and often urban finances: rent control; the production of public housing and urban renewal; and the administration of housing vouchers.
Rent control first became common in the US during World War I, as an emergency wartime measure and it reappeared on a large scale during World War II. Price controls were ubiquitous during the wars, partially as an attempt to limit the morale-related costs of obvious producer profits and higher consumer expenditures. Some localities, such as New York City, have kept some form of rent control ever since. The most common form of rent control is a limit on the extent the rents can be increased on an existing tenant, although there can also be limits as well on the extent that rents can be increased between tenants. The alleged benefit of rent control is the redistribution from landlord to tenant, but Arnott (1995) has also argued that rent stabilization serves to minimize a hold-up problem that can occur once tenants have paid the fixed costs of moving into a building.
The economic literature on rent controls is enormous, and since Friedman and Stigler (1946) it has typically been widely criticized. Economists have emphasized the adverse supply consequences of a price control, leading to both underproduction and the conversion of rental units into owner-occupied housing (which appears to have been quite common during the 1940s). Others have emphasized the deterioration of unit quality due to rent control (Frankena, 1975), rent-seeking behavior created by the system (Barzel, 1974), and misallocation of units among renters (Glaeser & Luttmer, 2003). Some have even questioned whether lowering rents is counterproductive from a redistributive perspective, as landlords can be poorer than tenants (Johnson, 1951). Certainly, few economists today would argue that rent control is an efficient means of redistributing wealth.
In an interesting example of restricting local authority, the majority of states have enacted statewide rules preventing localities from imposing rent control. For example, rent control in Cambridge, Massachusetts was ended by the state legislature. An economic explanation for this state intervention is that rent control imposes costs on people outside the jurisdiction, who might want to move to the community but are prevented by the lack of supply of available housing.
Rent control also has possible impacts on municipal finances, which depend heavily on property taxes. By reducing the value of rental properties, rent control would seem to reduce the tax revenues of the community. Of course, the city could offset this with an increase in tax rates, but that may be difficult for institutional or political reasons. The heavily distorted property market in New York City, for example, may have something to do with that city’s relatively light reliance on property taxes.
The second primary means in which localities use housing as a means of redistribution is through the direct provision of public housing, which was also initiated as part of the New Deal.14 The Public Works Administration and later the United States Housing Authority began the federal engagement with public housing projects. More federal funding was made available by the Federal Housing Act of 1949, which helped encourage the process of “urban renewal.” These funds typically supported the clearing of existing poorer neighborhoods, often called “slums,” and their replacement with newer, often high-rise buildings, frequently for middle-income residents, who would pay below market rate rents.
While these initiatives always had the veneer of redistribution, initially they seemed like redistribution from both taxpayers and the poorest urban residents to people in the middle of the income distribution. Many of these projects had rules that worked to exclude the poorest people from their premises, although explicit racial barriers were met with significant protest (Zipp, 2010). Eventually, however, the projects became far more focused on poorer urbanites.
While state and federal funding provided significant financing for these projects, there were also implications for local budgets. Localities did bear some of the cost of building and maintain public housing. Moreover, public housing meant that large swaths of the city were taken off the tax rolls, and if public housing encouraged poorer people to stay in the city that would lead to larger expenditures on other municipal services.
By the 1960s, there was widespread antipathy to public housing in the United States. Jane Jacobs argued that these projects were poorly designed to meet the human needs of their residents. Cities and taxpayers were increasingly unwillingly to shoulder the costs of these projects. The visible poverty in the projects led many to argue that they actually made things worse for their residents, although that view has been challenged in recent research. Currie and Yelowitz (2000) and Jacob (2004) both provide evidence suggesting that public housing does not have demonstrable negative effects on children’s outcomes.
Nevertheless, the Nixon Administration moved away from public housing, embracing instead Section 8 housing vouchers. The Reagan Administration changed its supply focus to the Low Income Housing Tax Credit instead, which provides incentives for developers to construct “affordable” housing for lower income residents. The impact of the Low Income Housing Tax Credit on housing production has been questioned by Sinai and Waldfogel (2005) among others, who present evidence suggesting that these public units significantly crowd out the private production of housing. Glaeser and Gyourko (2009) argue that the Low Income Housing Tax Credit errs by introducing a common housing approach across urban areas with wildly different housing conditions, and that it makes little sense to subsidize housing in areas which are already oversupplied with cheap homes.
Housing vouchers have been typically seen as being a relatively efficient way to provide in-kind housing. Economists of course question whether this aid would not be better distributed in the form of unrestricted cash. Moreover, the somewhat opaque manner in which these vouchers are redistributed has been fairly puzzling to many. By creating a large, lumpy benefit, there is more demand than supply for the vouchers and local authorities typically enjoy significant autonomy over their distribution.
Both the Low Income Housing Tax Credit and Section 8 housing vouchers are administered by local housing authorities, which are important local governmental entities. While these entities typically have independent budgets, they are often controlled by the mayor or other local officials. As such, they remain an arm of local government providing aid that is at least meant to be redistributive in nature and that is largely funded by the federal government.
6.3 Public Hospitals and Health Care in Cities
Cities also engage in the redistribution through public hospitals and other local agencies meant to improve the welfare of the poor. City hospitals have a long history in the United States and they began as tools for addressing illness among the urban poor (Opdycke, 1999). Public hospitals, just like public health insurance, do seem to crowd out private health insurance (Rask & Rask, 2000), but competition from public hospitals, at least in the United Kingdom, appears to increase managerial quality in nearby institutions (Bloom, Propper, Seiler, & Reenan, 2010).
Just as the federal government’s rising role in paying for redistribution reduced the local role in that area, federal health care interventions have similarly been associated with a reduced local commitment to providing health care for the poor. Medicaid represents a significant shift in the vision for low income health care in America. Historically health care was provided free by public or non-profit hospitals, and was paid for either by local taxpayers, charitable giving, or cross-subsidization from other income. Medicaid meant that the federal government had taken on responsibility for paying for the health needs of the poor. This meant that hospitals of all sort could provide health care to the poor and expect to get it paid for, at least in large part by the federal government.
While public hospitals receive funding from federal Medicaid and state-level support they can also impose costs on local budgets. The combination of fiscal shortfalls at the city level and rising health costs has caused many cities to scale back their commitment to local public hospitals. For example, in response to the fiscal crisis of 1975, New York City cut the payroll of its Health and Hospitals Corporation by 17%, which appears to have led to significantly adverse health outcomes (Freudenberg, Fahs, Galea, & Greenberg, 2006).
More generally, between 1975 and 1995, the number of local government and state-run hospitals declined by 30% and the number of beds in those hospitals declined by 34%. The rising costs of providing health care have often challenged local budgets, and public hospitals are not particularly nimble in responding to changes in health care compensation. Hansmann, Kessler, and McClellan (2003) show that while for-profit and non-profit hospitals scaled back services to the poor dramatically in response to a reduction in federal reimbursements, public hospitals did not. Duggan (2000) finds that when California increased incentives to care for low income patients, more of these patients ended up at non-profit and for-profit hospitals, while a lower share of them ended up in public hospitals.
Cities, both in their hospitals and in their health care costs more generally, are facing the national challenge of dealing with the expanding costs of providing care. Weak (or non-existent) incentives to ration health care have been cited as a primary problem with the current system. As a result, many of the calls for reform have focused on alternative service models which create stronger incentives to cut costs as well as increase quality.
7 Cities, Investment, and Deferred Compensation
To many, urban public finance connotes the intertemporal aspects of municipal spending. Typically, local governments in the US are formally restricted from running operating expenditure deficits. They can, however, borrow to finance infrastructure and indeed their borrowing is implicitly subsidized by the fact that investors often do not have to pay income taxes on interest paid by municipal governments. In this section, I will start with the theory of intertemporal financing decisions by municipalities. I then treat infrastructure and deferred spending on operating expenditures in separate subsections.
7.1 The Timing of Spending by Municipalities
Like US states, cities typically face balanced budget rules that constrain their ability to borrow for operating expenses. While there has been a large literature on the impact of different types of balanced budget rules across US states (Inman, 1998; Poterba, 1994), there has been less investigation of these rules at the city level. Grembi, Nannicini, and Troiano (2011) found that when Italy relaxed its fiscal rules for cities with fewer than 5000 inhabitants, deficits increased from zero to roughly 2% of the city budget, and most of the change occurred because of reductions in tax revenues. Moreover, there are abundant examples of cities that have managed to defer the costs of operational spending either through creative accounting (Gramlich, 1976) or through underfunded pension promises (Novy-Marx & Rauh, 2011).
The economic case for local budget rules trades the costs of limiting financing options with the advantage of imposing discipline on local governments. Certainly, the inability to borrow means that cities may have difficulty responding to revenue shortfalls during a recession. The widespread nature of these rules suggests that voters do see them as necessary to restrain local public excesses, but it is unclear why these rules are more prevalent at the local than at the national level. Perhaps, the national ability to borrow is seen as a critical element in fighting wars or perhaps, local governments are seen as less trustworthy and therefore in need of more fetters.
Importantly, in many states, municipal borrowing is restrained by state law or the state constitution rather than by city charters. One interpretation of these rules is that the state is dealing with an externality related to local borrowing. If the state ultimately feels some obligation to deal with municipal debts, then restricting local borrowing is a means of pushing the city against imposing costs on other municipalities. The extreme example of state interventions in municipal finance occurs when cities have gotten into fiscal trouble and the state actually takes over the administrative function of the city. In some cases, like New York in the 1970s, the outside control board was seen as necessary to persuade investors to continue to buy city debt.
There are also plausible reasons why local public officials might want to engage in too much current spending, relative to voter desires, at least if they do not have to pay for them with current taxes. Certainly, there have been abundant allegations that city mayors have shown a strong desire to do just that in many situations. Perhaps the simplest model of this process is that politicians enjoy spending money, either because it builds political support or because spending is just fun, but they do not enjoy raising taxes, presumably because voters complain. If the costs are put off into the future, the politician faces less current hostility for spending and will overspend.
While this model has the virtue of simplicity and probably also truth, it does run afoul of more sophisticated economic theories. Homeowners, for example, should realize that they will end up paying the cost of extra spending in the future either through higher taxes or because those expected future taxes get compensated into the price of the home. Indeed, on theoretical grounds, we might expect Ricardian equivalence to operate quite strongly at the local level, when revenues are paid for by property taxes.
According to capitalization theory, if the city undertakes a obligation of present value of X dollars, which will be fair by property taxes on a set of N identical homes, then if current tax to pay for the obligation is Y/N, then the value of the homes declines by (X − Y)/N to reflect the future obligations. The assets owned by homeowners decline by Y/N because of the tax payment and (X − Y)/N because of declining property values. The total and immediate loss to homeowner is X/N no matter how the expenditure is financed.
Yet this Ricardian argument is unlikely to hold for renters, who may not expect to pay any future taxes. Rent control will particularly limit the impact that taxes imposed on property owners have on rents, which may reduce the incentive of people in rent-controlled units to oppose taxes, but it may also reduce the preference for current vs. future spending. Moreover, the Ricardian equivalence argument may fail if voters have trouble understanding the size of the expenditures, especially deferred expenditures. Lack of information may mean that voters expect a certain amount of expenditure deferral, but they will not impose extra costs for more deferral and that reduces the costs on politicians who raise total spending beyond revenues.
The cost of these budget restrictions depends on the ability to increase revenues during budget shortfalls or, if revenues cannot be adjusted, the costs of limiting city expenditures during a downturn. Buettner and Wildasin (2006) find that when there are revenue shortfalls, intergovernment grants help provide budgetary stability for larger cities while revenue cuts are more important for smaller cities. Baicker (2004) shows similar results on increasing revenues for county governments using the negative budgetary shock of having a capital crime trial. There has been relatively little work on the impact of local spending cuts on relevant outcomes (e.g., Freudenberg et al., 2006).
The ability of cities to respond to revenue shortfalls also depends on their ability to raise tax rates, which are themselves constrained in some states. For example, California and Massachusetts both passed referenda that severely limit the ability of communities to adjust tax rates. Bradbury, Mayer, and Case (2001) show that Massachusetts Proposition ![]() significantly constrained community spending. Those limits must either be seen as internalizing cross-jurisdictional externalities, or voters perceived inability to restrain their own local governments. Fischel (1989) argued that California’s court order restriction on spending differences in schools in Serrano v. Priest made Proposition 13 more attractive by limiting the ability to spend more on schooling.
significantly constrained community spending. Those limits must either be seen as internalizing cross-jurisdictional externalities, or voters perceived inability to restrain their own local governments. Fischel (1989) argued that California’s court order restriction on spending differences in schools in Serrano v. Priest made Proposition 13 more attractive by limiting the ability to spend more on schooling.
While cities are constrained (at least officially) from running deficits for current expenses, they can borrow to fund infrastructure investments, such as building new schools. In these cases, the logic is that these investments will pay off in the future so it makes sense to charge future residents or homeowners. Moreover, the scale of the investment might overwhelm local budgets if paid for out of current taxes. In some cases, the bond issues will be paid for by user fees on the infrastructure, such as tolls.
The ability of cities to borrow used tax-exempt securities creates potential investment opportunities because municipalities can borrow at lower rates than their taxpayers (Gordon & Slemrod, 1986). This provides an incentive for cities to borrow on behalf of their constituents. Gordon and Metcalf (1991) argue that the tax-exempt borrowing does not so much subsidize municipal investment, which could after all be financed directly by taxes, but it does create incentives for financial rebalancing.
In many cases, municipal bond issues must be approved by voters in an explicit vote. Cellini, Ferreira, and Rothstein (2010) use the need for bond issues to get local votes to estimate the impact of school investment on housing values. Their approach exploits the natural discontinuity in votes when 50% of the population approve. The need for voter approval creates yet another check on the ability to spend for future investments.
Perhaps the most surprising aspect of all the controls on deferring local spending is that things look so different at the local and national level. While the federal government finds it extremely easy to run large deficits, local governments cannot do anything like that. This surely helps explain the increasing role of the federal government. Certainly, this arrangement can be justified because of the federal role in countercyclical spending, but it is still hard to reconcile the ease with which the federal government runs deficits during good periods and the difficulties facing local governments borrowing even during sharp recessions.
7.2 Infrastructure: Cost-Benefit Analysis and Financing
The benefits of infrastructure spending are rarely easy to quantify, and serious cost-benefit analysis has been a significant contribution that economists have made to urban finance debates. Economists have also weighed into the related issue of the financing of infrastructure and the larger place of infrastructure in urban growth and change.
Cost-benefit analysis has progressed through essentially three stages, reflecting the increasing complexity of factors brought into the analysis. The simplest version of cost-benefit analysis essentially values the direct impact of the investment on its users treating current prices as given. For example, a new highway can be evaluated by estimating the time savings for the estimated number of riders who use the highway. A cleaner water system can be evaluated by assessing the health advantage for users of the system.
The second layer of cost-benefit analysis introduces general equilibrium effects and impacts on non-users. For example, a new highway can deliver benefits for users themselves and for drivers on related roads where the congestion has been decreased. Change in wages or prices can also reflect impacts of the investment, although in some cases, there is a risk of double counting. For example, the price impact of a new road on housing should reflect the direct benefit that drivers receive from the infrastructure.
The third layer is to include a wide range of hard-to-measure externalities. For example, the case for Cross Rail investment in London was partially made by emphasizing the positive agglomeration externalities that the added commuters would create (Graham, 2007). Glaeser and Gottlieb (2008) have questioned whether these agglomeration economies are sufficiently well understood to provide a sound basis for public investment.
The vagaries of local situations mean that it is difficult to make any blanket statements about whether there is too much or too little infrastructure investment within the US, despite the claims of the Civil Engineers Report Card and many politicians that America has a dire infrastructure gap. There certainly are papers that find some correlation between infrastructure investments and subsequent growth at least at the national level (e.g., Canning & Pedroni, 2008). But there is reasonable doubt about whether these associations are causal and whether the advantages of infrastructure in developing countries have much to say about the advantages of infrastructure in the developed world.
Duranton and Turner (2009), like Baum-Snow (2007), look at the impact of highway and other transportation investments. They find that highways did tend to increase metropolitan area growth within the US, but this does not actually make the case that highways create benefits that cover the costs. Highways may pull development in one area or another, but that development may well have occurred anyway. Kain (1990) and others have long made the case that subway investments were based on wildly optimistic ridership projections that led to faulty cost-benefit analysis.
The regression discontinuity design of Cellini et al. (2010) does seem to provide a more compelling means of assessing investments, at least in school infrastructure. They find that these investments are significantly valued by local homeowners, who see home prices rise by more than the cost of the infrastructure, but they also see relatively little impact on test scores.
The case for investing in infrastructure is particularly dubious in declining cities, which typically are relatively well endowed with structures and roads, relative to the current state of demand. Glaeser and Gyourko (2005) argue that low-income rustbelt cities remain primarily because of their durable structures. Yet infrastructure for declining areas is often sold as a tool for helping those areas come back. There is little evidence that supports these claims and an abundance of failed projects, such as Detroit’s People Mover. Even Bilbao’s Guggenheim Museum, which is usually held up as a model of successful urban regeneration, has been found to have costs that are exceeding benefits (Plaza, 2006). Since it is relatively easy to justify white elephant projects with far reaching claims about city-building, it makes sense to be particularly wary about inserting these elements into cost-benefit analysis, especially since moving economic activity from one area to another does not imply any automatic welfare gain.
The financing of infrastructure is also a subject of a considerable economic discussion. The decision about funding infrastructure through user fees or tax revenues goes back to Adam Smith, who argued that user fee-based financing would eliminate unnecessary projects. The case against user fee financing is that the marginal social cost of using the infrastructure may be significantly below the average cost of delivering the infrastructure especially when, as in the case of public transit, the infrastructure’s use reduces external costs elsewhere in the system.
If marginal social costs are less than average costs, then the standard argument is that general tax revenues should be used to pay for the infrastructure. Typically, the property tax is seen as handling this problem equitably since property owners will supposedly benefit from the infrastructure as it is capitalized into real estate prices. One argument for using other taxes, such as sales taxes, to pay for infrastructure is that some of the infrastructure’s value may be experienced by the tourists or commuters who use the infrastructure to get into the city. Of course, even in those cases, the benefits of the real estate should presumably be capitalized, in part, by commercial real estate prices.
There is also an ongoing debate about private infrastructure provision in the US (Winston, 2010) and throughout the world. The advocates of private provision argue that it can create more scope for innovation, more incentives for maintenance, and a tighter link between costs and benefits. The opponents emphasize the extent to which private-public partnership often ends in the expropriation of either the public or private entity (Engel, Fischer, & Galetovic, 2007).
7.3 Deferred Expenditures for Operating Expenditures
While current tax expenditures are intended to cover current expenses, urban governments have often managed to contrive means of delaying costs. Historically, artful accounting played this role, but today the largest issue appears to be insufficient funding of worker pensions and retiree health care. Novy-Marx and Rauh (2011) present evidence that there is currently a three trillion dollar shortfall in state and local pension plans. They argue that pension plans are usually evaluated using extremely high expected asset returns, which can only be realized by taking on large amounts of risk. Yet pension obligations are essentially fixed, and for that reason, they argue that they should be evaluated essentially using risk-free rates. Even if existing accounting practices are used, many states and municipalities have managed to develop large pension shortfalls.
The fundamental political economy model that explains this behavior is the one discussed above. Politicians seem to have an incentive to obscure the costs of current spending. As such, they strike deals with municipal unions where workers receive relatively low current wages and are compensated with relatively high levels of deferred compensation. One cost of this behavior is that communities may be purchasing more government employee time than would be optimal if voters recognized the true costs of labor.
Another cost is that workers may be provided with suboptimal earnings packages from a standard compensation theory framework. A simple model of optimal compensation would suggest that employers should only defer compensation if workers are more patient than employers. Yet the work of Fitzpatrick (2011) suggests that workers do not value their retirement packages terribly much. She examines an Illinois program that allowed teachers to increase the value of their pensions by making a one-time payment. For younger workers, the cost of the top up was less than one-fifth of its net present value. Yet less than one-half of younger workers typically took the deal. This suggests that the current system is distinctly suboptimal.
If indeed deferred compensation creates social waste by pushing workers to backload compensation and leading communities to have outsized governments, then the natural fix is to ensure more transparency in the cost of pensions and other benefits. One approach would be to require more investment into state pension plans. Another approach is to follow private industry and move from defined benefit to defined contribution plans that would be funded during the year in which the employee works. Facing significant fiscal crises, many municipalities are now considering this sort of move.
8 Urban Political Economy
In this final section, I will discuss the political economy of urban governments. I will start by discussing the institutions of local government and how local governments interact with the national political system. I will then turn to the interplay between mobility, sorting, and elections. I will end with a brief discussion of urban political machines.
8.1 The Institutions of Local Government
Typically, cities are endowed with both a legislature, such as a city council, and an executive, typically a mayor in larger governments. A smaller city legislature may employ a professional city manager to serve as its executive, which creates the possibility of benefitting from specialized skills. Allegedly, professional managers might manage to lower costs, but empirically that does not appear to be the case (Chang & Hayes, 1990). Indeed, recent work finds that city spending actually falls when cities switch from managers to mayors, possibly because managers are meant to implement the plans favored by city councils, while mayors can also veto those plans (Coate & Knight, 2011).15
Mayors are typically elected by citywide pluralities, but city council members may be elected either from particular districts or at large elections. Large elections essentially allow the entire city to vote on particular candidates and then winning candidates are selected based on some measure of their total support. At-large candidates can sometimes provide one of the rare examples of proportional representation in American politics. The primary literature on at-large elections has focused on their role in promoting diversity (e.g., Welch, 1990), rather than on the functioning of the city.
In many cities, mayors appear to be able to dominate city councils because of their control over patronage and city projects. This essentially means that mayors can reward or punish city councilors as needed. As a result, in some cities, city councils seem to be only a moderate check on the power of the mayor. Indeed, the balance between legislature and executive typically seems far less even than in the federal government. City mayors also typically enjoy far more ability to generate publicity than council members, which gives them an added ability to reward and punish council members.
The advocates of strong city mayors argue that they are the only elected official who is likely to take responsibility for the overall functioning of the city. Since city council members are not really held responsible, they are more likely to be beholden to specific interest groups such as public section unions. The strong power of the mayor is seen as appropriate given the need for a responsible leader to act for the larger interests of the city, but many cities have also introduced term limits to provide some form of limitation on mayoral power. Ferreira and Gyourko (2009) show that mayors typically enjoy strong incumbency advantages and that can also provide an argument for term limits (Glaeser, 1996). Interestingly, however, these limits do not always appear to be all that durable in the face of a strong mayor, as evidenced by the recent rewriting of term limits in New York City.
Of course, mayors and city council members operate in the murky world of urban interest groups. Logan and Molotch (1987) argue that “urban growth machines” are a typical feature of many cities. These growth machines are a combination of real estate, banking, and commercial interests who support the increased expansion of the city and are able to heavily influence urban policies. The effect of these machines may not be so harmful if without them cities adopt NIMBYist policies that excessively restrict the production of new buildings.
Public sector unions are another important urban interest group that appears to carry sizable weight in local elections. The growth of public sector unions may reflect the fact that in cities, unions influence both the demand and supply of labor (Freeman, 1986). American states differ sharply in the extent to which they allow collective bargaining for municipal services, and research in this area typically finds some positive impact of collective bargaining on labor costs in the relevant sector (e.g., Valletta, 1989).
Cities are, of course, also influenced by political economy factors at the national level. The over-representation of low density states in the Senate and the tendency of cities to vote with the Democratic policy may reduce the political clout of cities in the United States. In other countries, cities have often been more powerful because they are the seats of political power (Ades & Glaeser, 1995).
8.2 Mobility, Sorting, and Elections
The politics of cities is deeply influenced by the fact that people can move across these areas. Ferreira and Gyourko (2009) find little evidence that Democratic and Republican mayors differ in their spending policies. One explanation for this fact is that city mayors are constrained from following their ideological impulses because of the threat of out-migration. The ability to leave cities may also make citizens more tolerant of strong government at the local level than at the national level.
The sorting of people across districts creates the possibility that cities might get caught in political poverty traps. If poorer people vote for more local redistribution, and if local redistribution increases the poverty of an area, then redistribution and poverty might reinforce each other, and lead to a city with high levels of poverty and little effective redistribution.
The tendency of areas to lock themselves into poverty traps will be ameliorated if voters or politicians are forward looking and anticipate that increases in redistribution will lead to more poverty down the road. But this effect will be weakened if mayors draw their electoral support from the poor and therefore welcome the emigration of the wealthy. Glaeser and Shleifer (2005) named this phenomenon the “Curley Effect,” after Boston’s James Michael Curley, who seemed perfectly happy encouraging wealthier, Protestant Bostonians who opposed his leadership style to leave the city. The administration of Coleman Young in Detroit may provide another example of this phenomenon.
Sorting across cities shapes the demographic composition of cities and this may lead to different political outcomes. Alesina, Baqir, and Easterly (1999) argue that ethnic diversity makes it difficult to agree on public goods and pushes cities instead to focus on public employment that can be spread among ethnicities. Eisinger (1982) finds that African-American mayors increase the level of African-American employment in city government.
8.3 Urban Political Machines
No discussion of urban political economy could be complete without some mention of the urban political machines that once controlled city governments throughout the country (Steffens, 1904). The basic structure of these machines was that they would provide services to constituents who would then vote for the machine and induce their friends to vote. Critics of machines argued that they led to over-employment of semi-competent workers and corrupt profits for their leaders.
Long-lived modern mayors may create political systems that resemble old style political machines. Mayors still have patronage to dispense and they can still favor their political supporters. Yet the current situation is a shade of past excesses. The level of patronage controlled is far smaller and the legal barriers preventing wholesale expropriation of city property are far more common. Wallis, Fishback, and Kantor (2006) argue that the New Deal was a crucial turning point for the fortunes of political machines that had to obey rules put in place by the federal bureaucracy.
There is a growing literature on the impact of these machines on city costs and employment. Menes (1999), for example, finds that cities with machines typically paid workers more, spent more on government, but also had more public goods.
There were several institutions that progressive reformers put in place to limit the supposedly deleterious effects of local machines. More direct democracy through referendums and recall were meant to be tools against entrenched city government. Civil service reform that limited patronage and often doled out jobs through tests was another measure against patronage politics. Rauch (1995) finds that these reforms had little impact on the overall size of government even though they did shift expenditures from labor to capital. Rauch also found that reform increased manufacturing growth.
Interestingly, while late ![]() century privatization was seen as a tool to combat municipal corruption and incompetence, increasing the size of the public force in the
century privatization was seen as a tool to combat municipal corruption and incompetence, increasing the size of the public force in the ![]() century was also seen as a means to combat corruption. Kickback deals between city governments and private providers of services, like street cleaning, were seen as a major problem in cities like New York. Direct public provision of street cleaning, for example, was seen as a means of reducing this problem. The long history suggests that corruption may be fought by changes in either direction—toward more or less private provision—that disturb a cozy and corrupt status quo.
century was also seen as a means to combat corruption. Kickback deals between city governments and private providers of services, like street cleaning, were seen as a major problem in cities like New York. Direct public provision of street cleaning, for example, was seen as a means of reducing this problem. The long history suggests that corruption may be fought by changes in either direction—toward more or less private provision—that disturb a cozy and corrupt status quo.
9 Conclusion
Cities are an important part of the American economy and increasingly dominate the rest of the world. They need governments to address the externalities that exist in cities and local governments that have often played an important role in addressing perceived national political objectives. Yet the economic literature on urban public finance is still in a relatively early stage.
The most salient aspects of urban political economy are the dependence on property taxes and the important role of intergovernmental transfers. There are good economic arguments for both features of local public finance. Yet we are far from knowing whether the current systems are, in any sense, optimal. The growing dependence of cities on federal largesse is quite understandable, but that change creates distortions and the possibility for spending that is not valued at the local level. These areas are badly in need of future research.
In addition, local governments face important challenges regarding intertemporal tradeoffs. They operate with seemingly strict balanced budget rules, but then often seem to work hard to eliminate the impact of those rules. The political forces that lie behind this process are also an important topic for future research.
While there was a robust urban politics literature during the 1960s, there has been less work in this area in recent years and the positive political economy revolution in political science has produced relatively few papers that are relevant for cities. This is another shortfall that is worth addressing.
Acknowledgments
I am grateful for financial assistance to the Taubman Center for State and Local Government. Kristina Tobio and Peter Ganong provided helpful research assistance. Alan Auerbach, Patrick Kline, Joel Slemrod, Laszlo Sandor, Ugo Troiano, and David Wildasin provided helpful comments and suggestions.
References
1. Abdulkadiroglu A, Angrist JD, Dynarski SM, Kane TJ, Pathak PA. Accountability and flexibility in public schools: Evidence from Boston’s charters and pilots. Quarterly Journal of Economics. 2011;126(2):699–748.
2. Ades AF, Glaeser EL. Trade and circuses: Explaining urban giants. Quarterly Journal of Economics. 1995;110(1):195–227.
3. Acemoglu D, Angrist J. In: Cambridge, MA and London: MIT Press; 2001;Bernanke BS, Rogoff K, eds. How large are human-capital externalities? Evidence from compulsory schooling laws. vol. 15.
4. Ackerman F, Heinzerling L. Pricing the priceless: Cost-benefit analysis of environmental protection. University of Pennsylvania Law Review. 2001;150(5):1553–1584.
5. Alesina A, Baqir R, Easterly W. Public goods and ethnic divisions. The Quarterly Journal of Economics. 1999;114(4):1243–1284.
6. Alesina A, Baqir R, Easterly W. Political jurisdictions in heterogeneous communities. Journal of Political Economy. 2004;112(2):348–396.
7. Arnott R. Time for revisionism on rent control? Journal of Economic Perspectives. 1995;9(1):99–120.
8. Arnott RJ, Stiglitz JE. Aggregate land rents, expenditure on public goods, and optimal city size. Quarterly Journal of Economics. 1979;93(4):471–500.
9. Atkinson R, Blandy S, Mostowska M. Gated communities. Journal of Housing and the Built Environment. 2007;22(2):231–234.
10. Baicker K. The budgetary repercussions of capital convictions. Advances in Economic Analysis & Policy. 2004;4(1):6.
11. Bakija, J., & Slemrod, J. (2004). Do the rich flee from high state taxes? Evidence from federal estate tax returns. NBER working paper series. The National Bureau of Economic Research, Cambridge, MA.
12. Ballou D, Springer MG. Achievement trade-offs and no child left behind. Peabody College of Vanderbilt University 2008.
13. Barzel Y. A theory of rationing by waiting. Journal of Law and Economics. 1974;17(1):73–95.
14. Baum-Snow N. Did highways cause suburbanization? The Quarterly Journal of Economics. 2007;122(2):775.
15. Baum-Snow N, Kahn ME. Effects of urban rail transit expansions: Evidence from sixteen cities, 1970–2000. In: Burtless G, Pack JR, eds. Brookings-Wharton Papers on Urban Affairs. Washington DC: Institute Press; 2005;147–197.
16. Becker GS. A theory of the allocation of time. Economic Journal. 1965;75(299):493–517.
17. Belfield CR, Nores M, Barnett S, Schweinhart L. The high/scope perry preschool program: Cost-benefit analysis using data from the age-40 followup. Journal of Human Resources. 2006;41(1):162–190.
18. Berry CR. Imperfect union: Representation and taxation in multilevel governments. Cambridge University Press 2009.
19. Besley T, Coate S. Centralized versus decentralized provision of local public goods: A political economy approach. Journal of Public Economics. 2003;87(12):2611–2637.
20. Black SE. Do better schools matter? Parental valuation of elementary education. Quarterly Journal of Economics. 1999;114(2):577–599.
21. Blakely EJ, Snyder MG. Fortress america: Gated communities in the United States. Washington, DC: Brookings Institution Press; 1999.
22. Blank RM. The effect of welfare and wage levels on the location decisions of female-headed households. Journal of Urban Economics. 1988;24(2):86–211.
23. Bleakley, H., & Lin, J. (2010). Portage: Path dependence and increasing returns in US history. NBER working papers, No. 16314. The National Bureau of Economic Research, Cambridge, MA.
24. Bloom, N., Propper, C., Seiler, S., & Reenan, J.V. (2010). The impact of competition on management quality: Evidence from public hospitals. NBER working papers, No. 16032, The National Bureau of Economic Research, Cambridge, MA.
25. Boffa F, Piolatto A, Ponzetto GAM. Centralization and accountability: Theory and evidence from the clean air act. Mimeograph 2012.
26. Borjas GJ. Immigration and welfare magnets. Journal of Labor Economics. 1999;17(4):607–637.
27. Bradbury KL, Mayer CJ, Case KE. Property tax limits, local fiscal behavior, and property values: Evidence from Massachusetts under proposition 2 1/2. Journal of Public Economics. 2001;80(2):287–311.
28. Braga AA. Setting a higher standard for the evaluation of problem-oriented policing initiatives. Criminology & Public Policy. 2010;9(1):173–182.
29. Brooks L. Volunteering to be taxed: Business improvement districts and the extra-governmental provision of public safety. Journal of Public Economics. 2008;1–2:388–406.
30. Brueckner JK. Growth controls and land values in an open city. Land Economics. 1990;66(3):237–248.
31. Buettner T, Wildasin DE. The dynamics of municipal fiscal adjustment. Journal of Public Economics. 2006;90(6–7):1115–1132.
32. Canning D, Pedroni P. Infrastructure, long-run economic growth and causality tests for cointegrated panels. Manchester School. 2008;76(5):504–527.
33. Carlton D. The location and employment choices of new firms: An econometric model with discrete and continuous endogenous variables. Review of Economics and Statistics. 1983;65(3):440–449.
34. Cellini SR, Ferreira F, Rothstein J. The value of school facility investments: Evidence from a dynamic regression discontinuity design. The Quarterly Journal of Economics. 2010;125(1):215.
35. Chang S, Hayes K. The relative efficiency of city manager and mayor-council forms of government. Southern Economic Journal. 1990;57(1):167–177.
36. Ciccone A, Hall RE. Productivity and the density of economic activity. American Economic Review. 1996;86(1):54–70.
37. Coate S, Knight B. Government form and public spending: Theory and evidence from US cities. American Economic Journal: Economic Policy. 2011;3(3):82–112.
38. Cohen R, Lai A, Steindel C. The effects of marginal tax rates on interstate migration in the US. Mimeograph: New Jersey Department of Revenue; 2011.
39. Cook, P. J. & Ludwig, J. (2010). Economical crime control. NBER working paper series. The National Bureau of Economic Research, Cambridge, MA.
40. Coughlin CC, Terza JV, Arromdee V. State characteristics and the location of foreign direct investment within the United States. Review of Economics and Statistics. 1991;73(4):675–683.
41. Cullen JB, Levitt SD. Crime, urban flight, and the consequences for cities. Review of Economics and Statistics. 1999;81(2):159–169.
42. Currie J, Yelowitz A. Are public housing projects good for kids? Journal of Public Economics. 2000;75(1):99–124.
43. Cutler DM, Glaeser EL. Are ghettos good or bad? Quarterly Journal of Economics. 1997;112(3):827–872.
44. Cutler D, Miller G. Water, water everywhere: Municipal finance and water supply in American cities. In: Glaeser EL, Goldin C, eds. A national bureau of economic research conference report. Chicago and London: University of Chicago Press; 2006.
45. Dee TS, Jacob B. The impact of no child left behind on student achievement. Journal of Policy Analysis and Management. 2011;30(3):418–446.
46. de Mello Jr LR. Fiscal decentralization and intergovernmental fiscal relations: A cross-country analysis. World Development. 2000;28(2):365–380.
47. Diamond CA, Simon CJ. Industrial specialization and the returns to labor. Journal of Labor Economics. 1990;8(2):175–201.
48. Dillinger W, Webb SB. Fiscal management in federal democracies: Argentina and Brazil. Economica (National University of La Plata). 1999;45(3):423–483.
49. Donohue JJ, Ludwig J. More COPS Brookings institution policy brief 158 Washington, DC: Brookings Institution; 2007.
50. Donohue III JJ, Siegelman P. Allocating resources among prisons and social programs in the battle against crime. The Journal of Legal Studies. 1998;27(1):1–43.
51. Duggan MG. Hospital ownership and public medical spending. Quarterly Journal of Economics. 2000;115(4):1343–1373.
52. Duranton G, Puga D. From sectoral to functional urban specialisation. Journal of Urban Economics. 2005;57(2):343–370.
53. Duranton, G., & Turner, M.A. (2009). The fundamental law of road congestion: Evidence from US cities. Working paper, No. w15376. The National Bureau of Economic Research, Cambridge, MA.
54. Ebel RD, Yilmaz S. On the measurement and impact of fiscal decentralization. In: Martinez-Vazquez J, Alm J, eds. Studies in fiscal federalism and state-local finance. Cheltenham, UK and Northampton, MA: Elgar; 2003.
55. Eisinger PK. Black employment in municipal jobs: The impact of black political power. American Political Science Review. 1982;76(2):380–392.
56. Ellen, I., Schwartz, A., & Voicu, I. (2007). The impact of business improvement districts on property values: Evidence from New York City. Brookings-Wharton Papers on Urban Affairs, 1–39.
57. Engel, E., Fischer, R., & Galetovic, A. (2007). The basic public finance of public-private partnerships. NBER Working Paper Series. The National Bureau of Economic Research, Cambridge, MA.
58. Evans WN, Owens EG. COPS and crime. Journal of Public Economics. 2007;91(1–2):181–201.
59. Feldstein M, Wrobel MV. Can state taxes redistribute income? Journal of Public Economics. 1998;68(3):369–396.
60. Ferraz C, Finan F. Exposing corrupt politicians: The effects of Brazil’s publicly released audits on electoral outcomes. Quarterly Journal of Economics. 2008;123(2):703–745.
61. Ferreira F, Gyourko J. Do political parties matter? Evidence from US cities. Quarterly Journal of Economics. 2009;124(1):399–422.
62. Ferrie JP, Troesken W. Water and Chicago’s mortality transition, 1850–1925. Explorations in Economic History. 2008;45(1):1–16.
63. Fischel WA. Did serrano cause proposition 13? National Tax Journal (1986–1998). 1989;42(4):465–466.
64. Fishback PV. The new deal. In: Government and the American economy: A new history. Chicago: University of Chicago Press; 2007.
65. Fishback PV, Horrace WC, Kantor S. Did new deal grant programs stimulate local economies? A study of federal grants and retail sales during the great depression. The Journal of Economic History. 2005;65(1):36–71.
66. Fitzpatrick MD. How much do public school teachers value their retirement benefits? Mimeo: Stanford Institute for Economic Policy Research; 2011.
67. Frankena M. Alternative models of rent control. Urban Studies. 1975;12(3):303–308.
68. Freeman RB. Unionism comes to the public sector. Journal of Economic Literature. 1986;24(March):41–86.
69. Freudenberg N, Fahs M, Galea S, Greenberg A. The impact of New York City’s 1975 fiscal crisis on the tuberculosis, HIV, and homicide syndemic. American Journal of Public Health. 2006;96(3):424–434.
70. Friedman M, Stigler GJ. Roofs or Ceilings: The Current Housing Problem. In: Popular Essays on Current Problems Volume 1, Volume 2. Irvington-on-Hudson, New York: Foundation for Economic Education, Inc; 1946.
71. Friedrich, P., Gwiazda, J., & Nam, C. W. (2003). Development of local public finance in Europe. CESifo working paper, No. 1107.
72. Gamper-Rabindran S, Khan S, Timmins C. The impact of piped water provision on infant mortality in Brazil: A quantile panel data approach. Journal of Development Economics. 2010;92(2):188–200.
73. Glaeser EL. The incentive effects of property taxes on local governments. Public Choice. 1996;89(1–2):93–111.
74. Glaeser EL. Learning in cities. Journal of Urban Economics. 1999;46(2):254–277.
75. Glaeser EL, Gottlieb JD. The economics of place-making policies. Brookings Papers on Economic Activity. 2008;39(1):155–253.
76. Glaeser EL, Gyourko J. Arbitrage in housing markets. In: Glaeser EL, Quigley JM, eds. Housing markets and the economy: Risk, regulation, and policy. Cambridge: Lincoln Institute of Land Policy; 2009;113–146.
77. Glaeser EL, Gyourko J. Urban decline and durable housing. The Journal of Political Economy. 2005;113(2):345–375.
78. Glaeser EL, Gyourko J, Saks R. Why is Manhattan so expensive? Regulation and the rise in housing prices. Journal of Law and Economics. 2005;48(2):331–369.
79. Glaeser EL, Kahn ME, Rappaport J. Why do the poor live in cities? The role of public transportation. Journal of Urban Economics. 2008;63(1):1–24.
80. Glaeser EL, Kolko J, Saiz A. Consumer city. Journal of Economic Geography. 2001;1(1):27–50.
81. Glaeser EL, Luttmer EFP. The misallocation of housing under rent control. The American Economic Review. 2003;93(4):1027–1046.
82. Glaeser EL, Mare DC. Cities and skills. Journal of Labor Economics. 2001;19(2):316–342.
83. Glaeser EL, Meyer JR, eds. Chile, political economy of urban development. Cambridge, MA: Harvard University Press; 2002.
84. Glaeser EL, Sacerdote B. The social consequences of housing. Journal of Housing Economics. 2000;9(1–2):1–23.
85. Glaeser EL, Sacerdote B. Why is there more crime in cities? Journal of Political Economy. 1999;107(6):S225–S258.
86. Glaeser E, Shleifer A. Not-for-profit entrepreneurs. Journal of Public Economics. 2001;81(1):99–115.
87. Glaeser E, Shleifer A. The Curley effect: The economics of shaping the electorate. Journal of Law, Economics, and Organizations. 2005;21:1–19.
88. Glaeser EL, Resseger M, Tobio K. Urban inequality. In: Johnson NJ, Svara JH, eds. Justice for all: Promoting social equity in public administration. Armonk, New York: M.E. Sharpe; 2011;76–99.
89. Goolsbee A, Lovenheim MF, Slemrod J. Playing with fire: Cigarettes, taxes, and competition from the internet. American Economic Journal: Economic Policy. 2010;2(1):131–154.
90. Gordon RH, Metcalf GE. Do tax-exempt bonds really subsidize municipal capital? National Tax Journal (1986–1998). 1991;44(4):71–72.
91. Gordon RH, Slemrod J. An empirical examination of municipal financial policy. In: Rosen HS, ed. National bureau of economic research project report series. Chicago and London: University of Chicago Press; 1986.
92. Graham DJ. Agglomeration, productivity and transport investment. Journal of Transport Economics and Policy. 2007;41(3):317–343.
93. Gramlich EM. The New York City fiscal crisis: What happened and what is to be done? American Economic Review. 1976;66(2):415–429.
94. Greenstone M, Hornbeck R, Moretti E. Identifying agglomeration spillovers: Evidence from winners and losers of large plant openings. Journal of Political Economy. 2010;118(3):536–598.
95. Grembi V, Nannicini T, Troiano U. Do fiscal rules matter? A difference-in-discontinuities design. Mimeograph 2011.
96. Gyourko J, Saiz A, Summers A. A new measure of the local regulatory environment for housing markets: The Wharton residential land use regulatory index. Urban Studies. 2008;45(3):693–729.
97. Hansmann H. The rationale for exempting nonprofit organizations from corporate income taxation. Yale Law Journal. 1981;91(1):54–100.
98. Hansmann H, Kessler D, McClellan M. Ownership form and trapped capital in the hospital business. In: Glaeser EL, ed. The governance of not-for-profit organizations. Chicago: University of Chicago Press; 2003.
99. Hanushek EA. The failure of input-based schooling policies. Economic Journal. 2003;113(485):F64–F98.
100. Hanushek, E.A. (2000). Rationalizing school spending: Efficiency, externalities and equity, and their connection to rising costs. University of Rochester – Wallis Institute of Political Economy, Wallis working papers No. WP2, 2000.
101. Hart O, Shleifer A, Vishny RW. The proper scope of government: Theory and an application to prisons. Quarterly Journal of Economics. 1997;112:1127–1161.
102. Haughwout A, Inman R, Craig S, Luce T. Local revenue hills: Evidence from four US cities. Review of Economics and Statistics. 2004;86(2):570–585.
103. Heckman JJ, Lochner L, Taber C. General-equilibrium treatment effects: A study of tuition policy. American Economic Review. 1998;88(2):381–386.
104. Hilber CAL, Mayer C. Why do households without children support local public schools? Linking house price capitalization to school spending. Journal of Urban Economics. 2009;65(1):74–90.
105. Hines JR. Altered states: Taxes and the location of foreign direct investment in America. American Economic Review. 1996;86(6):1076–1094.
106. Hirsch WZ. Cost functions of an urban government service: Refuse collection. Review of Economics and Statistics. 1965;47(1):87–92.
107. Holmes TJ. The effect of state policies on the location of manufacturing: Evidence from state borders. The Journal of Political Economy. 1998;106(4):667–705.
108. Howe, C.W. (1971). Benefit-cost analysis for water system planning. Monograph No. 2. Washington, DC: American Geophysical Union.
109. Hoxby CM. Does competition among public schools benefit students and taxpayers? American Economic Review. 2000;90(5):1209–1238.
110. Hoxby, C.M., & Murarka, S. (2009). Charter schools in New York City: Who enrolls and how they affect their students’ achievement. Working paper No. w14852. The National Bureau of Economic Research, Cambridge, MA.
111. Inman, R. P. (1998). Do balanced budget rules work? US experience and possible lessons for the EMU. NBER working paper series. The National Bureau of Economic Research, Cambridge, MA.
112. Jacob BA. Public housing, housing vouchers, and student achievement: Evidence from public housing demolitions in Chicago. The American Economic Review. 2004;94(1):233–258.
113. Jacobs J. The economy of cities. New York: Vintage Books; 1968.
114. Johnson DG. Rent control and the distribution of income. The American Economic Review. 1951;41(2):569–570.
115. Kain JF. Deception in Dallas: strategic misrepresentation in the promotion and evaluation of rail transit. Journal of the American Planning Association 1990;(Spring):184–196.
116. Kline P, Moretti E. Local economic development, agglomeration economies, and the big push: 100 years of evidence from the Tennessee valley authority. Mimeographed 2011.
117. Krueger A. Crisis prevention and resolution: Lessons from Argentina. International Monetary Fund 2002.
118. Krueger AB. Economic considerations and class size. Economic Journal. 2003;113(485):F34–F63.
119. Krugman P. Increasing returns and economic geography. The Journal of Political Economy. 1991;99:483–499.
120. Levine PB, Zimmerman DJ. An empirical analysis of the welfare magnet debate using the NLSY. Journal of Population Economics. 1999;12(3):391–409.
121. Levitt SD. The effect of prison population size on crime rates: Evidence from prison overcrowding litigation. Quarterly Journal of Economics. 1996;111(2):319–351.
122. Levitt SD. Understanding why crime fell in the 1990s: Four factors that explain the decline and six that do not. Journal of Economic Perspectives. 2004;18(1):163–190.
123. Levitt SD. Using electoral cycles in police hiring to estimate the effect of police on crime. American Economic Review. 1997;87(3):270–290.
124. Logan J, Molotch H. Urban fortunes: The political economy of place. Los Angeles: University of California Press; 1987.
125. Lopez-de-Silanes F, Shleifer A, Vishny R. Privatization in the United States. RAND Journal of Economics, The RAND Corporation. 1997;28(3):447–471.
126. Loury, G. (2009). A nation of jailers. Cato unbound. <http://www.cato-unbound.org/2009/03/11/glenn-loury/a-nation-of-jailers/>. Accessed 11.03.09.
127. Marshall A. Principles of economics. London: Macmillan and Co.; 1890.
128. Menes, R. (1999). The effect of patronage politics on city government in American cities, 1900–1910. NBER working paper series. The National Bureau of Economic Research, Cambridge, MA.
129. Moretti E. Estimating the social return to higher education: evidence from longitudinal and repeated cross-sectional data. Journal of Econometrics. 2004;121(1–2):175–212.
130. Moretti E. Local multipliers. American Economic Review: Papers and Proceedings. 2010;100(2):1–7.
131. Novak M. The spirit of democratic capitalism. New York: Simon and Schuster; 1982.
132. Novy-Marx R, Rauh J. Public pension promises: How big are they and what are they worth? Journal of Finance. 2011;66(4):1211–1249.
133. Oates W. An essay on fiscal federalism. Journal of Economic Literature. 1999;37:1120–1149.
134. Oberholzer-Gee F, Strumpf K. Endogenous policy decentralization: Testing the central tenet of economic federalism. Journal of Political Economy. 2002;110:1–36.
135. Opdycke S. No one was turned away: The role of public hospitals in New York City since 1900. NY: Oxford University Press; 1999.
136. Papke L. Interstate business tax differentials and new firm location: Evidence from panel data. Journal of Public Economics. 1991;41(1):47–68.
137. Plaza B. The return on investment of the Guggenheim Museum Bilbao. International Journal of Urban and Regional Research. 2006;30(2):452–467.
138. Poterba JM. State responses to fiscal crises: The effects of budgetary institutions and politics. Journal of Political Economy. 1994;102(4):799–821.
139. Rask K, Rask K. Public insurance substituting for private insurance: New evidence regarding public hospitals, uncompensated care funds and medicaid. Journal of Health Economics. 2000;19(1):1–31.
140. Rauch JE. Bureaucracy, infrastructure, and economic growth: Evidence from US cities during the progressive era. The American Economic Review. 1995;85(4):968–969.
141. Reback, R., Rockoff J., & Schwartz, H. L. (2011). Under pressure: Job security, resource allocation, and productivity in schools under NCLB. NBER working paper series. The National Bureau of Economic Research, Cambridge, MA.
142. Rosenthal SS, Strange WC. The attenuation of human capital spillovers. Journal of Urban Economics. 2008;64(2):373–389.
143. Rotemberg JJ. The efficiency of equilibrium traffic flows. Journal of Public Economics. 1985;26(2):191–205.
144. Rothstein J. Does competition among public schools benefit students and taxpayers? Comment. American Economic Review. 2007;97(5):2026–2037.
145. Rusk D. Cities without suburbs. Baltimore: Johns Hopkins University Press; 1993.
146. Serrato J, Wingender P. Estimating local fiscal multipliers. Mimeographed 2011.
147. Sinai T, Waldfogel J. Do low-income housing subsidies increase the occupied housing stock? Journal of Public Economics. 2005;89(11–12):2137–2164.
148. Steffens L. The shame of the cities. New York: Amereon; 1904; Reprinted 1957.
149. Thaler R. An econometric analysis of property crime: Interaction between police and criminals. Journal of Public Economics. 1977;8(1):37–51.
150. Troesken W, Geddes R. Municipalizing American waterworks, 1897–1915. Journal of Law, Economics, and Organization. 2003;19(2):373–400.
151. US Government Printing Office (2012). Statistical Abstract of the United States.
152. Valletta RG. The impact of unionism on municipal expenditures and revenues. Industrial and Labor Relations Review. 1989;42(3):430–442.
153. Vlaicu, R., & Whalley, A. (forthcoming). Hierarchical accountability in government: Theory and evidence. American Economic Review.
154. Wallis JJ, Fishback PV, Kantor S. Politics, relief, and reform: Roosevelt’s efforts to control corruption and political manipulation during the new deal. In: Glaeser EL, Goldin C, eds. Anational bureau of economic research conference report. Chicago and London: University of Chicago Press; 2006.
155. Weisbrod B. The voluntary non-profit sector: An economic analysis. Lexington, MA: Lexington Books, DC Heath; 1978.
156. Welch S. The impact of at-large elections on the representation of blacks and Hispanics. Journal of Politics. 1990;52(4):1050–1076.
157. Welsh BC, Farrington DP. Toward an evidence-based approach to preventing crime. Annals of the American Academy of Political and Social Science. 2001;578:158–173.
158. Wildasin D. Income redistribution in a common labor market. American Economic Review. 1991;81(4):757–774.
159. Wildasin D. Urban public finance. Chur, Switzerland: Harwood Academic Press; 1986.
160. Winston C. Last exit: Privatization and deregulation of the US transportation system. Washington DC: Brookings Institution Press; 2010.
161. Wiseman J. Cost-benefit analysis in education. Southern Economic Journal. 1965;32:1–12.
162. Young C, Varner C. Millionaire migration and state taxation of top incomes: Evidence from a natural experiment. National Tax Journal. 2011;64(2, Part 1):255–284.
163. Zipp S. Manhattan projects: The rise and fall of urban renewal in cold war New York. NY: Oxford University Press; 2010.
1The Source for the employment figure is the 2012 Statistical Abstract of the United States.
2This result does not hold if the locality is being funded with taxes on the population outside its borders.
3The source for the figures in this and the next two paragraphs is the 2012 Statistical Abstract of the United States, where I have used the most recent available numbers. See Table 1: Facts about Local Governments for more detail.
4Yellow Fever is of course mosquito carried, not waterborne, but water vectors are still related to the spread of the disease.
5See http://www.infrastructurereportcard.org/.
6The switch from AFDC to TANF essentially replaced matching grants with lump-sum grants, following the Nixon-era move to Community Development Block Grants, and that structure should also decrease the incentive to redistribute, especially if localities are wary of attracting lower-income individuals.
7http://georgewbush-whitehouse.archives.gov/omb/expectmore/summary/10000412.2007.html.
8Moretti (2010) and Serrato and Wingender (2011) both find quite high local multipliers, relative to those found at the national level, which suggests that the interjurisdictional leakages may not be that important.
9In this static model, it would be equivalent to assume that the land tax is paid directly by the final user.
10One potential explanation for this difference is that localities may have better information about housing values than higher levels of government.
11If there was heterogeneity within the city between marginal residents and fixed residents, then it would be possible to tax the fixed residents to subsidize the marginal residents. While that could, in principle, cause migrants to internalize the social benefits of moving to the city, such a program would be difficult politically.
12It would be more attractive for this difference to come out of declining marginal utility of income among the richer, more skilled residents, but the assumption of quasi-linearity precludes that possibility.
13The increasing prevalence of internet transactions, however, has pushed in the opposite direction making the enforcement of sales taxes more difficult for local governments (Goolsbee, Lovenheim, & Slemrod, 2010).
14Zipp (2010) provides a helpful overview of the public projects within New York City.
15Vlaicu and Whalley (2012) find that cities with managers have fewer police officers per capita, which they interpret as reflecting the greater isolation of managers from popular tastes, but it is unclear whether having fewer police officers is desirable or not.