
Uses of Streaming and Digital Media Report
In Q1 of 2004, Aberdeen Group and StreamingMedia.com administered two separate surveys to visitors to the StreamingMedia.com website. The surveys asked respondents about their usage of streaming and digital media in a business and personal context. It also asked them about their patterns of use of rich media, including frequency, session length, and preferred media players. This appendix summarizes the survey responses and provides Aberdeen’s analysis of the data. Most importantly, this appendix translates that data and analysis into specific recommendations and the direct impact for enterprises, content providers, and end-users of digital media.
We have included the Executive Summary of the report that gives the facts and figures based on the findings. More information on the entire 70-page report is available at http://www.streamingmedia.com/research.
Statistically Significant Research Data
Unlike many surveys conducted in the past on streaming and digital media, these surveys have a statistically significant respondent base. Thus, the results and analysis are defensible as an empirical benchmark against which readers can gauge their own use of business and personal applications and upon which future trend analysis can be conducted.
The StreamingMedia.com website receives more than 50,000 unique visits per month, with more then 25,500 individuals receiving its weekly newsletter, Streaming Media Xtra. The survey created by Aberdeen Group received 918 valid responses; the survey created by StreamingMedia.com received 2,043 valid responses. Those levels provide a 99% confidence level with a confidence interval of ±3%. In other words, the responses to the survey represent StreamingMedia.com’s population.
The next logical question is, does the StreamingMedia.com population represent the general public, buyers of the streaming technologies, Web surfers, or other some other subgroup of the general population? The respondent overview in Chapter Two of the report presents the aggregated demographics of the respondent base. Individual readers of the entire report should use Chapter Two to determine how close the respondent base is to their target population, be that internal users, external customers, or potential buyers of technologies and services.
Aberdeen Group has performed all of the analysis and recommendations included in this report. Aberdeen analyzed the data as a total group and in several subgroups: by company size and by interest group, which is how the respondents themselves classified their “interest in streaming and digital media” per a specific survey question. The subgroup analysis is not so statistically significant as the overall data set; the confidence level for some of these subgroups drops to 95%. Chapter Two presents the response levels of the subgroups. Readers should use Chapter Two to determine the statistical significance of any specific of the subgroups in comparison with the aggregated data.
Findings Contained in the Report
This report contains statistically significant measurements of:
• Usage rates of business and personal applications that involve streaming and digital media, with segment analysis by company size and interest group, for today and for the next 12 months
• Planned spending on streaming and outsourced technologies, services, and applications for the next 12 months
• For business respondents, the percentage of company sites currently enabled for streaming or digital media
• User frequency and session length of streaming media sessions, with segment analysis by company size and interest group
• Media player installed base and user preference
• Adoption rates of file sharing, subscription, and for-pay content services
Each of the data sets is presented in table or graph format and includes Aberdeen’s analysis of what is important or noteworthy. Aberdeen also highlights the relevant implications, recommendations, and impact for enterprises, content providers, and end-users.
StreamingMedia.com believes this report is the first statistically valid benchmark of the streaming and rich media market. Although the population for this study may not represent 100% of the market at large, it is highly representative of individuals, businesses, and suppliers that have an active interest in streaming and digital media.
Executive Summary
Streaming and Digital Media Are Ready for Prime Time
Aberdeen has followed the technologies and services that make up the streaming and digital media marketplace for the last four years. In Aberdeen’s analysis, the market has gone from hype (1999) to hurt (2001) to helpful (2003). Over this period, some companies jumped in feet first, only to find the technologies and users were not mature enough to use the media effectively. In this report, Aberdeen proves that now is the time to aggressively engage—or re-engage—in using streaming and digital media in business and personal applications, for cost savings, revenue opportunities, and customer interaction. The reader has heard this claim before. However, the numbers are new. This statistically valid benchmark study points the way to streaming and digital media success and reveals the following findings:
• A mature, experienced user base now exists. Enterprises and content providers can now deploy streaming and digital media confident that internal employees and external customers have a solid experience with media in a variety of contexts.
• Firms that have deployed streaming applications in some business areas (e.g., distance learning, Webcasting) should look to other applications (e.g., product launches, executive communications) that build on those successes.
• Company executives, IT professionals, and content providers who are dabbling in media usage should move full-force toward expanding their deployments.
This report has real numbers to show that users are actively engaging the streaming and digital media applications available to them. The Executive Summary highlights the key findings from this report in relation to business applications and use, personal applications and use, and overall media usage.
Highlights of Business Application Usage
The following summarizes the top-level findings for business application usage from the survey results.
Business Applications with Media Approaching 50% Adoption in the Coming Year —
Most business applications with streaming or digital media components have a solid current use, with 25% to 35% of respondents regularly using rich media in company meetings, distance learning, external corporate announcements, and internal executive communications. Respondents also show a consistent projected adoption of business applications with streaming or digital media over the next 12 months, with total potential usage approaching 50% of users.
Contrary to expectations, sales force training trails most other business applications, with a little more than 20% of respondents reporting current use and only 38% indicating potential adoption of these applications in the next 12 months. Vendors regularly tout sales force training as the largest category which is not the case. Rather, Webcasting and Web conferencing are the leading business applications for streaming and digital media.
Enterprises should compare their current use of these applications with the survey results and ask themselves, Am I a leader or laggard? Leaders in one application should examine other applications with similar adoption rates for opportunities to increase the leverage of their IT investments in digital media. Laggards can use this analysis to determine where to start: High-use applications will be less expensive and more mature than the low-use applications.
Vendors regularly tout sales force training as the largest category, which is not the case. Rather, Webcasting and Web conferencing are the leading business applications for streaming and digital media.
Spending on Media Apps in 2004 is Not Strong — Despite the economic upturn, suppliers in the streaming and digital media industry should plan on another tough year. Survey respondents said that their average spending per company for the coming year would be less than $100,000 for products and services and less than $50,000 for outsourced broadcast services. Only 5% of respondents expect to spend more than $1 million in the next 12 months.
Aberdeen research indicates that at least part of this low projected spending level is caused by the milestone approach to IT spending: buyers may plan for the overall investment, but they do not commit real dollars until specified milestones are reached. They purchase for one location or one application, get results from that segment, and then spend more only if the results are positive.
Spending per company for the coming year will be less than $100,000 for products and services and less than $50,000 for outsourced broadcast services.
Highlights of Personal Application Usage
The following summarizes the top-level findings for personal application usage from the survey results.
Media and Entertainment Dominate Personal Uses — The online versions of entertainment, news, and media content, such as news sites, movie trailers, and streaming radio, have the highest uptake, with more than 50% of respondents using these applications. Traditional “for-pay” categories, such as games and sports, have the lowest uptake, with less than 10% of respondent usage. Although only 27% of respondents indicated that they belong to subscription services, more than 60% have paid for online content.
These findings indicate that the best personal use of media applications is to augment other forms of media and entertainment. Subscriptions are a viable method to gather an audience, but should not be relied upon as the primary method for distributing content.
Highlights of Overall Media Usage
The following summarizes the top-level findings for overall media usage from the survey results.
Media Use is a Regular Occurrence Among All Users — Enterprises can expect that their users are already familiar with accessing media on their desktops. The survey shows that more than 50% of respondents use streaming or digital content at least once per day. Nearly 75% of respondents use online media at least two to three times per week, including the business user subsegment.
As a result, enterprises can be confident that the majority of their users, both employees and end-customers, are comfortable using media on their computers, in business and personal applications. This finding opens wide the door for expanding the use of network-delivered media in the enterprise, without fear that transitioning from traditional broadcast, videotape, or other forms of delivery will decrease usability.
Users are Conditioned to Use Media for Short Spurts — Despite the familiarity, most users are not ready to spend long periods of time consuming media on the desktop. The survey shows that users access media in short spurts, with nearly 65% of the respondents spending 30 minutes or less per session. Enterprises can be confident that their users are comfortable using media in business and personal applications.
The implication for businesses is not that longer content will not be watched: The survey did not ask about preferences for this topic, only about current habits. However, to conform to current usage patterns, enterprises should cut longer media into segments that are consumable in stages.
All Players are Installed, but Microsoft is Preferred — Enterprises and content providers can rest assured that users will be able to access media in almost any format. Microsoft Windows Media leads in installed media players, with nearly a 95% installed base, but only by a narrow margin: RealPlayer has an 87% installed base, and QuickTime has 83%. When it comes to which player users prefer, though, Microsoft is the clear leader. Users reported a 2-to-1 preference for Windows Media over RealPlayer or QuickTime.
Companies should continue making player and media server choices based on the business case: which technology best fits the needs of the application and provides the highest return on investment? Although users are comfortable with all players, to please the greatest number of users, companies should choose Microsoft technologies—as long as the business case does not preclude Windows Media because of cost, customizability, or other requirements.
Media Usage and Preferences
This section presents the research findings, analysis, and impact of survey responses in the following subject areas:
• Frequency of media use
• Length of media sessions
• Installed media players installed
• Preferred media player
This data is presented in three ways: all respondents, segmented by company size, and segmented by interest group (as classified by the respondents). Frequency of Streaming and Digital Media Usage The Aberdeen survey asked respondents the following question:
A1. |
How often do you use streaming media or digital media (audio or video streamed or downloaded over a network or the Internet) either for personal or business use? |
|
|
a. |
Once per month |
|
b. |
Two to three times per month |
|
c. |
Once per week |
|
d. |
Two to three times per week |
|
e. |
Once per day |
|
f. |
More than once per day |
Figure A-1 summarizes the aggregated responses to this question. Figure A-2 segments responses by Company Size. Figure A-3 segments respondents by Interest Group.

Source: Aberdeen Group, January 2004
Figure A-1
Frequency of Use—All Respondents: Most users access media at least two to three times per week.
Source: Aberdeen Group, January 2004
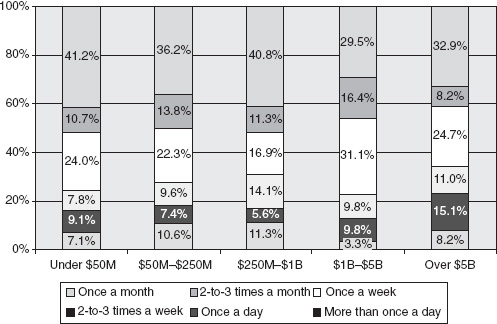
Figure A-2
Frequency of Use—Company Size: Respondents of smaller companies are likely to use media more frequently than respondents of larger companies.
Source: Aberdeen Group, January 2004
Figure A-3
Frequency of Use—Interest Croup: Most groups use streaming and digital media several times per week. Outside of the supplier community, daily use is less common.
All Respondents
• Research Finding: More than 50% of respondents access streaming or digital media content at least once a day. Nearly 75% of respondents use online media at least 2-3 times a week. (See Figure A-1.)
• Analysis: There is an audience that is experienced and comfortable with accessing and consuming digital media content over the Internet and IP networks.
• Impact: This is great news for content providers and for businesses. When this research is combined with the recent Arbitron Inc./Edison Media Research finding that residential broadband penetration has reached 21% of the U.S. population, it indicates that an end-user market of significant size and frequency of use now exists to create a profitable business for a mass consumer market—good news for everyone but content providers in particular. For businesses, the frequency indicates that users are achieving a solid experience and comfort level with streaming and digital media. That should help prevent the underlying technologies from inhibiting usage of corporate streaming media applications themselves. That is a big leap from the previous situation, where the new technologies caused more problems than they were able to solve.
Company Size
• Research Finding: More than half of the respondents in the small company segments said that they use media at least once per day. Respondents in less than half of the large company segments use media at least once per day. For usage of more than two to three times per week, all segments approach or exceed 75% (Figure A-2).
• Analysis: Users at companies of all sizes commonly use streaming and digital media, with a higher frequency in smaller companies.
• Impact: Enterprises considering expanding their streaming and digital media programs can be assured that, because of regular usage, their users are already quite comfortable with the format.
Interest Group
• Research Finding: Suppliers are by far the largest users of streaming and digital media, with almost 64% of supplier respondents using media at least once per day. Few personal users access media on a daily basis (more than 33%), but approach 65% at two to three times per week (Figure A-3).
• Analysis: Although company size closely reflects the aggregate data, there are significant variations when examining the data by interest group. Personal users, who are expected to be the largest user group, are actually not nearly as heavy users as suppliers. Business users, presumed to be enterprise or corporate users who are not suppliers of streaming and digital media technologies and services, have a strong base.
• Impact: It is no surprise that suppliers use streaming and digital media the most frequently. It is surprising, however, that the business group uses media more frequently than personal users. One implication is that businesses are requiring more use of streaming and digital media, which drives up the frequency of use. However, no correlation analysis has been performed at this time to associate business applications to business usage, although this analysis is available upon request.
Session Length of Streaming and Digital Media
The Aberdeen survey asked respondents the following question:
A2. |
How long is your typical session when using streaming or digital media? |
|
|
a. |
Less than 5 minutes |
|
b. |
5 to 15 minutes |
|
c. |
15 to 30 minutes |
|
d. |
30 minutes to 1 hour |
|
e. |
1-2 hours |
|
f. |
More than 2 hours |
Figure A-4 summarizes the aggregated responses to this question. Figure A-5 segments responses by company size. Figure A-6 segments respondents by interest group.

Source: Aberdeen Group, January 2004
Figure A-4
Length of Session—All: More users access shorter media segments.

Source: Aberdeen Group, January 2004
Figure A-5
Length of Session—Company Size: Segmentation analysis of session length does not vary significantly from the aggregate data set.
Source: Aberdeen Group, January 2004
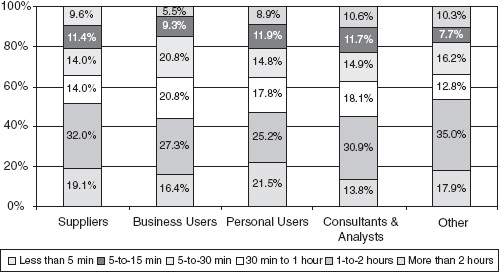
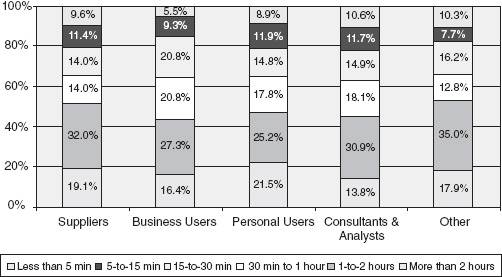
Figure A-6
Length of Session—Interest Croup: Segmentation analysis of session length does not vary significantly from the aggregate data set.
All Respondents
• Research Finding: 48% of respondents indicated that they use streaming or digital media for 15 minutes or less per session. Nearly 65% of respondents said that they spend 30 minutes or less per session. Only 19.4% will spend more than 1 hour per session (Figure A-4).
• Analysis: Users are currently conditioned to consume short-format audio and video over IP networks. It is not clear from the research whether this results from a chicken-and-the-egg problem: Do respondents use short-format because they prefer it or because that is all that is available?
• Impact: The impact here is somewhat uncertain. The current prevalence of short-format use indicates that the longer the audio or video content, the smaller the base of consumers who are willing to watch/listen to the entire program. Therefore, to reach the largest audience, business- and consumer-oriented companies should create content that is less than 15 minutes. Longer content may be able to reach the large audience if it is broken into discrete, sub-15-minute segments that can easily be stopped, restarted, and skipped. However, given that the analysis neither asked respondents how long they are willing to use digital media nor correlated availability with usage, the issue needs further research before any strong conclusions can be drawn.
Company Size and Interest Group
• Research Finding: In terms of session length, both company size analysis and interest group analysis echo closely the aggregate data set (Figures A-5 and A-6).
• Analysis: The lack of significant variation by company size or interest group contains the same ambiguity as the aggregate: Is there no variation because only short-form content is available or because users prefer shorter content? This is a question for future analysis.
• Impact: It would be premature to advise particular actions based on this data. However, content providers, enterprises, and suppliers can infer that most users are conditioned to consume content that is less than 30 minutes in length. This conditioning should be taken into account when designing new streaming or digital media services. Anything longer than 30 minutes may necessitate behavioral changes for the general user, which can increase the challenge to market acceptance and wide user adoption.
Media Players: Installed
The Aberdeen and Streamingmedia.com surveys both asked respondents the following question:
A9/SM11: |
Which of the following media players do you have installed on your desktop (check all that apply): |
|
|
a. |
Windows Media Player from Microsoft |
|
b. |
RealPlayer from RealNetworks |
|
c. |
QuickTime Player from Apple |
|
d. |
MPEG player |
|
e. |
Customized player |
|
f. |
Other |
Figure A-7 summarizes the responses to the surveys.

Source: Aberdeen Group and streamingmedia.com, January 2004
Figure A-7
Media Players Installed—All: Microsoft leads in installed players by a narrow margin.
All Respondents
• Findings: Microsoft has the highest installed penetration among respondents; nearly 95% reported that Windows Media Player is installed on their desktops. RealPlayer is close behind with an 87% installed base, and QuickTime has 83%. MPEG players are installed on nearly 39% of desktops, and customized players are installed on less than 13% of desktops (Figure A-7). Analysis: Most users have several media players installed.
• Impact: Aberdeen research shows that, behind the firewall, most companies choose one format and require their users to view content in that format. The high installed base of all three players, Microsoft, Real, and QuickTime, guarantees that choosing any one of these formats will address a broad base of users who already have the player available. Companies that want to please the largest number of current users and deliver content in the widest preferred format should offer their content in the Microsoft format.
All Respondents Finding and Analysis
Without multiple surveys conducted over several intervals, it is not possible to determine if any of the players’ installed bases are growing or shrinking. This analysis will be conducted in future studies.
This research does not correlate cost of delivery with format of delivery. Companies evaluating streaming media platforms should also evaluate the licensing and maintenance costs of all available options before selecting a specific media format. See Figure A-8.

Source: streamingmedia.com, January 2004.
Figure A-8
Media players installed, by company size: Mostly mirrors aggregate data set, with variances.
• Microsoft’s Windows Media Player remains the leader in all segments, with a low of 95.2% in the less than $50M segment and a high of 97.9% in the $1B-$5B segment.
• RealNetworks’ RealPlayer rises slightly over the aggregated data set in two segments, reaching a 90.3% installed base in the $250M-$1B segment and a 91.5% installed base in the $1B-$5B segment. RealNetworks falls slightly in two segments, dropping to an 83.2% installed base in the $50M-$250M segment and an 83.5% installed base in the more than $5B segment.
• Apple QuickTime reflects the aggregate for three segments (less than $50M: 84.5%; $250M-$1B: 82.3%; and $1B-$5B: 84.0%). Apple falls in the other segments, to 77.7% in the $50M-$250M segment and to 74.1% in the more than $5B segment.
• The MPEG player reflects the aggregate dataset except for a significant jump in the “$1B-$5B” segment, reaching 51.1%.
• The customized player and other categories see no significant difference from the aggregate data set. Impact: Enterprises should work with application developers to determine the most appropriate platform for their internal content and applications.
Company Size Finding and Analysis
• Microsoft’s Windows Media Player remains the leader in all interest group segments and does not vary significantly from the aggregate results (from 94.9% to 96.6%). See Figure A-9.

Source: streamingmedia.com, January 2004.
Figure A-9
Media players installed, by interest group: Mostly mirrors aggregate data set, with variances.
• RealNetworks’ RealOne Player remains steady for the supplier and business user segments (87.7% and 86.1%, respectively), but drops to 83.5% in the consultant/analyst segment and to 81.6% in the personal user segment.
• Apple QuickTime is steady, with a high of 84.4% in the supplier segment and a low of 79.4% in the consultant/analyst segment.
• The MPEG player is also steady, with a low of 37.6% of the personal users and a high of 47.6% among suppliers.
• The customized player and other categories see no significant difference from the aggregate data set.
Impact: The drop against the aggregated data set in installed base of RealPlayer and QuickTime in the personal segment indicates that, if enterprises or content providers want to reach the widest possible audience, they should use the Microsoft platform. Again, further research is required to determine the growth pattern of any of these installed base segments.
Additional analysis and impact studies of the installed base of media players are available upon request from Aberdeen.
Media Players: Preferred
The Aberdeen survey asked respondents the following question:
A10. |
If given a choice, which format do you prefer to use (check ONLY ONE): |
|
|
a. |
MPEG player |
|
b. |
QuickTime (Apple) |
|
c. |
RealMedia (RealNetworks) |
|
d. |
Windows Media (Microsoft) |
|
e. |
Other |
Figure A-10 summarizes the aggregated responses to the survey.
All Respondents
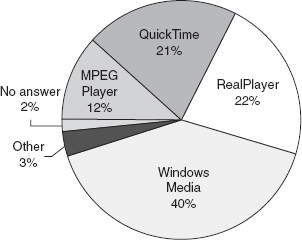
• Findings: Microsoft was selected as the preferred player by 40% of respondents. RealPlayer edged out QuickTime for second place, as these players finished with 22% and 21%, respectively. MPEG players garnered only 12% of player preference (Figure A-10).
Source: Aberdeen Group, January 2004
Figure A-10
Media Player Preferred, All: Microsoft has a significant lead. QuickTime and RealPlayer are practically equal.
• Analysis: Microsoft is clearly the player of choice and has the highest penetration rate. The near-even split between RealPlayer and QuickTime is interesting but only a starting point for further research: Tracking this question over time will provide better insight into whether Apple will overtake RealNetworks, or if format preferences have reached stabilization.
• Impact: When combined with the installed base results, this question reinforces the recommendation that enterprises and content providers that seek to reach the widest possible audience should use Windows Media format. RealPlayer and QuickTime are also important options, particularly for content providers trying to please the majority of the potential user base.
Company Size Findings and Analysis
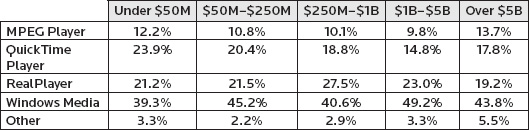
Microsoft’s Windows Media Player remains the preferred player in all segments. There is a significant jump over the aggregate data set in the $1B-$5B subsegment, with a preference of 49.2%, and less significant but still relevant bump in the $50M-$250M segment, to 45.2%. Refer to Figure A-11.
Source: Abedeen Group, January 2004.
Figure A-11
Media players preferred, company size. Mostly minor aggregate data set, with variances.
• Preference for RealPlayer reflects the aggregate data, with the exception of the $250M-$1B segment, where preference rises to 27.5%.
• Preference for QuickTime remains steady in most company segments, but drops to 14.8% in the largest segment.
• There is no significant difference based on company size in preference for MPEG player over the aggregated data set.
Impact: The sharp increase in preference for Microsoft in the top segment is significant, indicating that Microsoft has a controlling critical mass in this segment. Further study is required to determine the source of the jump and whether the difference will hold with a broader data set than the streamingmedia.com respondents.
Interest Group Data Set Findings
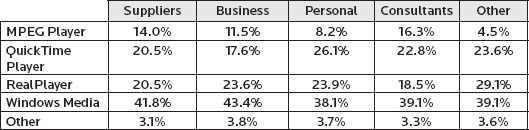
• Windows Media and RealPlayer preferences by interest group do not vary significantly from the aggregated data set. Refer to Figure A-12.
Source: Abedeen Group, January 2004.
Figure A-12
Media players preferred, by interest group: significant variations from the aggregate.
• Preference for QuickTime tracks the aggregate data set, except among personal users, where preference jumps to 26.1%. The shift is at the expense of MPEG players, which falls to 8.2%.
Analysis: The shift in the personal user subsegment from MPEG to QuickTime is not so significant as the numbers may indicate. Because QuickTime is built from the MPEG code base and the informed nature of the respondent base (see Chapter Two), respondents are likely to see both QuickTime and MPEG as two flavors of the same technology. This analysis also reflects other research that indicates that informed user groups see MPEG and QuickTime players as somewhat interchangeable.
Impact: The consistency of results for Microsoft and Real between the aggregate set and the interest group segments indicates that users have the same preferences, regardless of the type of user they are.