The basis for any investment market is just that—a market. Markets are locations (physical or virtual) where sellers and customers convene to exchange goods, or in our case, financial instruments. If you’ve ever watched business news on television, you’ve probably seen a shot of the New York Stock Exchange (NYSE)—often companies stage publicity events where a representative rings the bell to open the day’s trading before the cameras. In the NYSE, shares of stock in U.S.-listed companies are exchanged. Prices of each exchange are tracked to reveal trends in interest in those shares—rising prices indicate rising appeal (more buyers than sellers), while falling prices indicate the opposite.
Investors do not occupy the NYSE, or other exchanges, themselves. They transact their exchanges through intermediaries. Brokerage firms interface with end-buyers and end-sellers. Those brokers, in turn, trade with market makers, who facilitate the trades. At the NYSE, the market makers are called specialists and they are the only entities who transact business on the floor of the exchange. In some markets like the NASDAQ, there is no floor—all trading occurs electronically—and therefore no specialists.
Market Spreads
Most of the time there is a small difference between the price at which a buyer may purchase a stock, termed the bid price, and the price at which a seller will sell the stock, the ask price. At a given moment an instrument therefore has two prices: bid and ask. For example, IBM might be quoted as “$200.50 ask; $199.75 bid.” The difference between these two prices is known as the market spread, and represents the profit opportunity that induces brokerages and specialists to make the market—to connect sellers and buyers.
Markets with high trading volumes will attract more market makers, who will compete with each other based on the price they charge to handle a transaction—that is, based on the spread they charge. Highly liquid markets (with large trading volumes and numerous market makers) tend to have the smallest spreads. In fact, widening spreads can be an early indication of a market whose liquidity is freezing up, as occurred in the fixed income markets in the fall of 2008. Niche markets, such as instruments traded in frontier markets such as Myanmar or Kazakhstan, have low volumes and consequently wide market spreads.
Types of Order (Basic)
Investors enter buy and sell orders with their brokers for a certain number of shares (round lots are 100 shares). Each of these may be either “at the market” (a market order), where the broker simply accepts whatever price the market is offering; or a limit order, which sets a condition before the order can be executed. For example, a buy “limit order for 100 IBM at $200” instructs the broker to buy 100 IBM shares only if he can do so at a price of $200 per share or less. The equivalent limit order to sell instructs the broker to sell only if the price is $200 or higher.
Types of Order (Intermediate)
Although exchanges only accept and execute buy and sell orders in the exchanges order book (as described in the next section), other more complex orders can be established, with the added complexity handled by a broker. Two examples are selling short and stop orders.
Selling short is a bet that a stock’s price will fall. (The conventional bet, that a stock’s price will rise, is termed going long.) The investor borrows shares from a holder and sells them, earning the proceeds of the sale. At a later point, they buy the same number of shares and return them to their lender. If the shares fell in price from the earlier sale price, the investor pockets the difference. If it rises, they lose the difference. In addition, the investor who is shorting must pay interest to the owner of the shares borrowed—a fee known as the rebate—as well as any dividends to which the owner is entitled during the borrowing period.
Shorting, then, involves two transactions: “sell to open” (to open the short position) and “buy to close.” Their order in time is the reverse of that in a normal long transaction. Shorts are considered riskier than longs, on average, for several reasons. First, the long-term trend in stock prices is upward, so a short bet must be premised on the belief that the stock in question will move in a contrary direction. Second, the potential loss is unbounded. The maximum loss with a long position is 100 percent—the stock’s price can’t go below zero. But the theoretical maximum loss for a short is unlimited, since a stock’s price can rise without boundary. Finally, executives in companies being shorted do not take kindly to it. If the investor relies on access to the company (e.g., a brokerage firm’s analysts who cover the company), the company may retaliate by curtailing access by those analysts. Not surprisingly, few hedge funds are short-only, although many use shorts to hedge long positions. Shorts require exceptionally deep research to identify overvalued stocks, and an iron determination to be contrarian.
Stop orders are contingent orders, usually used for risk management. Stop loss orders are the most common type. An investor might instruct one’s broker to place a market order automatically if the price of the stock falls more than a specified threshold (e.g., 25 percent) below the purchase price. Trailing stops act equivalently, but make the condition the most recent high to preserve most of the gains for an asset whose price has risen since original purchase. Less commonly, investors may sell a portion of their position to preserve partial gains; a free ride, for example, specifies that the broker should sell half of a position when it has doubled in price from original purchase. That way the original capital is “taken of the table,” and only profits are at risk. Each of these more complex or contingent orders must be placed through a broker. Some investors believe that stop loss orders constitute important information that other market participants can exploit (as illustrated in a later section), so they advise keeping stop loss rules private (i.e., withholding from a broker until it is time to execute).
Matching Orders: The Order Book
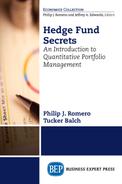
As investors place orders in the market, specialists (or the exchange computer system) tabulate an ever-changing order book. An example is shown in Figure 4.1.

Figure 4.1 Sample order book for XYZ stock
Orders are grouped as Buy or Sell; noting the number of shares being offered (ask) and requested (bid) at each possible price. The spread is the difference between the lowest ask price and the highest bid price—in this instance, 5 cents (0.05 dollars), or 0.5 percent of the midpoint between bid and ask. This very small spread is an indication of a very liquid market.
If a seller places a market order for 150 shares, it would be filled by combining buy orders that cumulate to that many shares, starting from the highest buy order (in this case, for 100 shares at $99.95) and adding additional buy orders until all 150 shares have been absorbed. In this instance, the next-highest buy order, for 50 shares at $99.90, would also be utilized. The seller’s average price per share would be $99.933. Economically, this sale has moved the equilibrium price of XYZ a short distance down the demand curve: The next buyer will only bid $99.85 for XYZ. A purchase will move in the opposite direction, up the demand curve. So if the preponderance of trades is sales, prices will fall, and if most are purchases, they will rise. Equal numbers of shares bought and sold should result in stable prices. In the example in Figure 4.1, there is a higher volume of XYZ shares on offer than there are bids for them, which suggests that XYZ’s share price will probably decline. As you can see, knowledge of the order book can provide useful information for predicting short-term price changes.
The Advantage of Milliseconds
Trades aren’t always cleared on exchanges. A brokerage firm that simultaneously holds overlapping buy and sell orders from different clients may clear them internally. This saves the firm exchange fees; further, the broker can earn the market maker’s spread. In the past decade, syndicates of brokerage firms have created “dark pools”—essentially informal exchanges among those firms. Market-making specialists may likewise clear trades before they are submitted to the formal exchange.
As the example in Figure 4.1 illustrates, discrepancies in the volume of sell versus buy orders can predict short-term price trends. So brokers and market makers possess important information on which they can trade. The key is speed, since orders change constantly and new orders will change the balance of trading volumes between sell and buy orders. For this reason, firms have invested heavily in automating trading systems (since computers can execute trades far faster than people can), and in minimizing the time it takes to communicate trade orders to their recipients. Time can be saved with better communications technology, such as replacing copper wire with fiber optic cable; or by locating the trading platforms closer to the receiving entities, such as co-locating the platform at the exchange itself. Competitive advantage can hinge on milliseconds. Several books have covered “high frequency trading” (HFT), including most recently Lewis’s Flash Boys.
Front running is one where a broker issues trades in advance of those of its clients, knowing the price movements that will probably occur when clients’ orders are executed. Its ethics are dubious when a broker is trading against its own clients, but fair game when the counterparty is another broker’s client. Reducing (through technology or colocation) the time to see an opportunity and execute a transaction is sanctioned front running. Processing large numbers of trades very quickly to exploit evident short-term price trends is at the core of trading-oriented hedge funds’ strategies, and provides ample opportunities for IT professionals.