Once a hypothesis regarding a trading strategy has been developed, prudent investors will wish to test it before committing funds to its execution. The most persuasive approach would be to forward test—make simulated or “paper trades” for some period of time into the future to appraise the strategy’s performance versus a benchmark. But such forward testing takes time, unavoidably. An alternative is to simulate use of the tested strategy over some past period; this is backtesting. Backtesting requires four main components:
• Historical data to provide the context in which the strategy will be executed in simulation
• A definition of the strategy that can be automated
• A market simulator that represents the simulated trades. Ideally, it should include transactions costs such as commissions, as well as market impact costs (the effect on a stock’s market price of increased trading volume caused by our strategy).
• An analysis engine that records the returns from the simulated trades and compares the strategy’s performance versus a benchmark
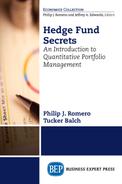
With these pieces, an analyst can step history forward a day at a time, see if conditions trigger buying or selling under the strategy being tested, and evaluate the strategy’s return and variability (risk). Figure 15.1 illustrates an analysis report by Lucena Research for an example strategy; the light gray line shows when the strategy sold or bought, and how its return and its risk compared with buying and holding the S&P 500 in dark line (usually considered the default reference strategy). In terms of cumulative return, this particular strategy outperformed the benchmark substantially for the evaluation period. You can see by the history graph that it was also much less volatile. These factors combine to provide a significantly improved Sharpe ratio of 0.50 versus 0.27 for the benchmark. It is also common for hedge funds to provide lower cumulative returns compared with a benchmark, but with significantly reduced volatility. This relative performance is common to the claims of many hedge funds: Their strategies have lower volatility and lower returns in rising markets, presumably because of the performance drag caused by hedges. But their risk-adjusted return—as measured by their Sharpe ratio or information ratio—is superior to unhedged long-only strategies.

Figure 15.1 Sample results of a backtest. The strategy performance is shown in light gray, and benchmark in dark
Source: Lucena Research.
Cautions about Backtesting
Any statistical method can be seductive—it is easy to overinterpret positive results when a strategy is evaluated. Arguably, several of the major hedge fund blowups have occurred because backtesting was accepted without skepticism. Here is a short list of common pitfalls.
• “Peeking” into the future: You know the actual history of financial markets, which a contemporary from your backtesting period would not. You can choose a strategy that is, at least unconsciously, designed for those conditions. It is important to make sure that the period from which you drew your inspiration in designing the tested strategy is not the same as the period from which your backtesting data come. Otherwise, you are simply confirming a tautology.
• Data mining: The “data mining fallacy” arises when an analyst tests many strategies and, inevitably, finds one that is very successful in the testing period but falls fat on its face in another testing period. The strategy was inadvertently optimized for unique circumstances or random noise. If you cannot identify any plausible theory to explain why a given strategy worked so well under a test, there is a good chance its success is a data mining anomaly—you “mined the data” until you found a spurious relationship.
• A changing market: Market conditions change—in fact, that is a central premise of the efficient market hypothesis: market actors continually adapt to other actors’ strategies, which drives this change. A strategy tested in a past period may reflect very different conditions from those you face today. If you backtested strategies with historical data from the late 1990s, for example, a leveraged long-only strategy heavily overweighted in Internet stocks would look like a huge winner. Unfortunately, after the dot-com bubble came the bust, and tech stocks have not performed nearly so well since.
A common protection from these common problems is to cross validate the tested strategy. Cross validation means testing the strategy on more than one subset of historical data to see if results are similar in each subset. You could test the strategy with two subsets of stocks, or two subsets of time periods. If you get strong results in only one of the subsets, it is likely that those results are not valid—they have happened because of one of these pitfalls.
Michael Steinhardt, Steinhardt Partners

Born: 1940
Firm: Steinhardt Partners
Founded: 1967, as Steinhardt, Fine, Berkowitz, & Co (1967 to 1979); Steinhardt Partners (1979 to 1995).
Style: Equity long/short, frequently heavily hedged (i.e., net short).
Differentiation: Early users of monetary data to predict stock market movements; “block trading” in opaque “third markets” (i.e., outside of exchanges) that provided institutions with needed liquidity in exchange for small discounts to market prices.
Steinhardt’s background: Son of Sol Steinhardt, a stolen jewelry “fence,” high-stakes gambler, and confederate of prominent Mafiosi (he dined with Albert Anastasia the night before he was gunned down). After attending Wharton, Steinhardt became a junior analyst at mutual fund Calvin Bullock, then at Loeb, Rhoades & Co. His initial stake came from envelopes of cash invested from his father’s gambling winnings. Founded the partnership in 1967 with early investments from William Salomon, founder of Salomon Brothers; and Jack Nash, founder of Odyssey Partners.
Annual return: 24.5 percent after fees. Fees were at or below industry norms: 1 percent of AUM, with performance fees at 15 percent of gains (realized or unrealized), later raised to 20 percent.
AUM (peak): $4.5 billion (1994)
Color: “He was short, barrel-chested, and prone to terrifying outbursts. He would let forth a blood-curdling torrent of abuse and then his temples would turn red . . . . If there was one quality that Steinhardt valued in people, it was the balls to take a position” (from More Money Than God).