


Functional verification of the network
The configuration should be tested on different layers. To verify that the interface and network settings are correct, use the nsdperf tool, ping, and the ib_*tools set from Mellanox OpenFabrics Enterprise Distribution (MOFED). To obtain a baseline for comparison, you should run a first cycle with TCP/IP only.
4.1 Quick test: ping
Try to ping from each interface to the other interface between two nodes, as shown in Example 4-1. Make sure that you include each local interface and remote IP address and loop over all of them. Also, ping with a larger packet size to check that the RDMA over Converged Ethernet (RoCE) packets with larger sizes can be transferred in the fabric.
Example 4-1 Pinging from each interface to the other interface between two nodes
#local
[root@ess5kio1]# ip -4 a | grep 10.0.12 | grep inet
inet 10.0.12.102/24 brd 10.0.12.255 scope global noprefixroute enp1s0f0
inet 10.0.12.112/24 brd 10.0.12.255 scope global noprefixroute enp1s0f1
inet 10.0.12.103/24 brd 10.0.12.255 scope global noprefixroute enP51p1s0f0
inet 10.0.12.113/24 brd 10.0.12.255 scope global noprefixroute enP51p1s0f1
[root@ess5kio1]#
# remote
[root@ess5kio2 ~]# ip -4 a | grep 10.0.12 | grep inet
inet 10.0.12.104/24 brd 10.0.12.255 scope global noprefixroute enp1s0f0
inet 10.0.12.114/24 brd 10.0.12.255 scope global noprefixroute enp1s0f1
inet 10.0.12.105/24 brd 10.0.12.255 scope global noprefixroute enP51p1s0f0
inet 10.0.12.115/24 brd 10.0.12.255 scope global noprefixroute enP51p1s0f1
[root@ess5kio2 ~]#
## loop
[root@ess5kio1 profile.d]# for LocalIP in `ip -4 a | grep 10.0.12 | grep inet | awk '{print $2}' | cut -d / -f 1`
> do
> for RemoteIP in `ssh root@ess5kio2 "ip -4 a | grep 10.0.12 | grep inet " | awk '{print $2}' | cut -d / -f 1`
> do
> ping $RemoteIP -I $LocalIP -c 1 -s 4096 | grep "4104 bytes from";
> done
> done
4104 bytes from 10.0.12.104: icmp_seq=1 ttl=64 time=0.060 ms
4104 bytes from 10.0.12.114: icmp_seq=1 ttl=64 time=0.062 ms
4104 bytes from 10.0.12.105: icmp_seq=1 ttl=64 time=0.073 ms
4104 bytes from 10.0.12.115: icmp_seq=1 ttl=64 time=0.063 ms
4104 bytes from 10.0.12.104: icmp_seq=1 ttl=64 time=0.050 ms
4104 bytes from 10.0.12.114: icmp_seq=1 ttl=64 time=0.047 ms
4104 bytes from 10.0.12.105: icmp_seq=1 ttl=64 time=0.059 ms
4104 bytes from 10.0.12.115: icmp_seq=1 ttl=64 time=0.065 ms
4104 bytes from 10.0.12.104: icmp_seq=1 ttl=64 time=0.059 ms
4104 bytes from 10.0.12.114: icmp_seq=1 ttl=64 time=0.062 ms
4104 bytes from 10.0.12.105: icmp_seq=1 ttl=64 time=0.081 ms
4104 bytes from 10.0.12.115: icmp_seq=1 ttl=64 time=0.065 ms
4104 bytes from 10.0.12.104: icmp_seq=1 ttl=64 time=0.048 ms
4104 bytes from 10.0.12.114: icmp_seq=1 ttl=64 time=0.054 ms
4104 bytes from 10.0.12.105: icmp_seq=1 ttl=64 time=0.085 ms
4104 bytes from 10.0.12.115: icmp_seq=1 ttl=64 time=0.056 ms
[root@ess5kio1 profile.d]#
4.2 Quick test: ib_read_bw
Use the ib_read_bw tool with the -R parameter for using the Connection Manager (CM). The ib_[read,write]_[bw,lat] toolset from MOFED can be used on only one interface at a time. However, it is an essential toolset for validating that the network is healthy. On one (server-) node, open a session and start the tool on that server mode, as shown in Example 4-2.
Example 4-2 The ib_read_bw -R toolset
[root@ess5kio1 profile.d]# ip -4 a | grep 10.0.12 | grep inet | awk '{print $2}' | cut -d /
-f 1
10.0.12.102
10.0.12.112
10.0.12.103
10.0.12.113
[root@ess5kio1 profile.d]# ib_read_bw -R
************************************
* Waiting for client to connect... *
************************************
Open a second terminal on the other node and connect to one of the IP addresses that are shown in Example 4-2. Make sure that no down verbs interfaces are available. If the machine has unused ports, specify the active port, as shown in Example 4-3. Repeat this step for each target connection.
Example 4-3 RDMA_Read BW Test
[root@ess5kio2 ~]# ip -4 a | grep 10.0.12 | grep inet
inet 10.0.12.104/24 brd 10.0.12.255 scope global noprefixroute enp1s0f0
inet 10.0.12.114/24 brd 10.0.12.255 scope global noprefixroute enp1s0f1
inet 10.0.12.105/24 brd 10.0.12.255 scope global noprefixroute enP51p1s0f0
inet 10.0.12.115/24 brd 10.0.12.255 scope global noprefixroute enP51p1s0f1
[root@ess5kio2 ~]# ib_read_bw -R 10.0.12.102
---------------------------------------------------------------------------------------
RDMA_Read BW Test
Dual-port : OFF Device : mlx5_1
Number of qps : 1 Transport type : IB
Connection type : RC Using SRQ : OFF
PCIe relax order: ON
TX depth : 128
CQ Moderation : 1
Mtu : 4096[B]
Link type : Ethernet
GID index : 4
Outstand reads : 16
rdma_cm QPs : ON
Data ex. method : rdma_cm
---------------------------------------------------------------------------------------
local address: LID 0000 QPN 0x013b PSN 0xf99618
GID: 00:00:00:00:00:00:00:00:00:00:255:255:10:00:12:104
remote address: LID 0000 QPN 0x0122 PSN 0x278238
GID: 00:00:00:00:00:00:00:00:00:00:255:255:10:00:12:102
---------------------------------------------------------------------------------------
#bytes #iterations BW peak[MB/sec] BW average[MB/sec] MsgRate[Mpps]
65536 1000 11675.02 11673.95 0.186783
---------------------------------------------------------------------------------------
[root@ess5kio2 ~]#
If you see results that are shown in Example 4-3 on page 25, then your network works as expected. The bandwidth of 1,167,395 MBps is a good value for a 100 GbE network. A value below 11 GBps indicates potential problems with the network. You can now redo the tests with other options and adapter combinations, as shown in Example 4-4. Start as before on node 1.
Example 4-4 Command-line output for ib_read_test
[root@ess5kio1 profile.d]# ibdev2netdev
mlx5_0 port 1 ==> enp1s0f0 (Up)
mlx5_1 port 1 ==> enp1s0f1 (Up)
mlx5_2 port 1 ==> enP51p1s0f0 (Up)
mlx5_3 port 1 ==> enP51p1s0f1 (Up)
[root@ess5kio1 profile.d]# ip -4 a | grep inet | grep enP51p1s0f0
inet 10.0.12.103/24 brd 10.0.12.255 scope global noprefixroute enP51p1s0f0
[root@ess5kio1 profile.d]# ib_read_bw -R --ib-dev=mlx5_2
************************************
* Waiting for client to connect... *
************************************
On the second node, pick one of the available RoCE adapters and run the ib_* command, as shown by ib_read_test (2/2) in Example 4-5.
Example 4-5 Command line for ib_read_test (2/2)
[root@ess5kio2 ~]# ibdev2netdev
mlx5_0 port 1 ==> enp1s0f0 (Up)
mlx5_1 port 1 ==> enp1s0f1 (Up)
mlx5_2 port 1 ==> enP51p1s0f0 (Up)
mlx5_3 port 1 ==> enP51p1s0f1 (Up)
[root@ess5kio2 ~]# ib_read_bw --ib-dev=mlx5_3 -R 10.0.12.103
[…]
---------------------------------------------------------------------------------------
#bytes #iterations BW peak[MB/sec] BW average[MB/sec] MsgRate[Mpps]
65536 1000 11679.30 11675.39 0.186806
---------------------------------------------------------------------------------------
[root@ess5kio2 ~]#
4.3 Nsdperf test with TCP
You can use the nsdperf tool to measure the network connection speed between multiple nodes all at once. The connection itself and the bandwidth capabilities of the network are checked.
Multiple enhancements are in nsdperf. The nsdperf tool has a version function, and you can check the version (the source is in /usr/lpp/mmfs/samples/net) by running the command that is shown in Example 4-6 on page 27.
Example 4-6 Checking the nsdperf version
[root@fscc-sr650-13 net]# ./nsdperf -s -d
nsdperf 1.29 server started
^C
[root@fscc-sr650-13 net]#
For multiple adapters to be used for RoCE, you need to be using Version 1.29 at a minimum. Create a command file that includes all the IBM Elastic Storage System (ESS) server nodes and clients, as shown in Example 4-7.
Example 4-7 Create a command file
[root@ess5-ems1 nsdperf]# cat nsdperf_commandfile
s ess5kio1
s ess5kio2
c ece-13.mmfsd.net
c ece-15.mmfsd.net
c ece-14.mmfsd.net
c ece-16.mmfsd.net
c ece-17.mmfsd.net
c ece-18.mmfsd.net
c ece-19.mmfsd.net
c ece-20.mmfsd.net
ttime 30
threads 12
buffsize 8388608
hist off
status
t w
t r
reset
quit
Start nsdperf in server mode on all nodes by running the following command:
mmdsh -N all "/usr/lpp/mmfs/samples/net/nsdperf -s"
Run the nsdperf command on the node, where the command file is in the file that is shown in our Example 4-7. The bold lines in Example 4-8 show the results. As you can see, multiple clients connecting to the two servers per Internet Protocol network produces bandwidth of ~ 24 GBps, which is nearly the line speed of the network.
Example 4-8 The nsdperf command results
[root@ess5-ems1 nsdperf]# /usr/lpp/mmfs/samples/net/nsdperf -i nsdperf_commandfile
Connected to ess5kio1
Connected to ess5kio2
Connected to ece-13.mmfsd.net
Connected to ece-15.mmfsd.net
Connected to ece-14.mmfsd.net
Connected to ece-16.mmfsd.net
Connected to ece-17.mmfsd.net
Connected to ece-18.mmfsd.net
Connected to ece-19.mmfsd.net
Connected to ece-20.mmfsd.net
Test time set to 30 seconds
Number of tester threads set to 12
Buffer size set to 8388608 bytes
Histogram printing is now off
test time: 30 sec
data buffer size: 8388608
TCP socket send/receive buffer size: 0
tester threads: 12
parallel connections: 1
RDMA enabled: no
clients:
ece-13.mmfsd.net (192.168.12.13)
ece-14.mmfsd.net (192.168.12.14)
ece-15.mmfsd.net (192.168.12.15)
ece-16.mmfsd.net (192.168.12.16)
ece-17.mmfsd.net (192.168.12.17)
ece-18.mmfsd.net (192.168.12.18)
ece-19.mmfsd.net (192.168.12.119)
ece-20.mmfsd.net (192.168.12.210)
servers:
ess5kio1 (192.168.12.102)
ess5kio2 (192.168.12.104)
8-2 write 24000 MB/sec (2860 msg/sec), cli 4% srv 11%, time 30, buff 8388608, th 12
8-2 read 24700 MB/sec (2950 msg/sec), cli 5% srv 10%, time 30, buff 8388608, th 12
[root@ess5-ems1 nsdperf]#
As you can see in Example 4-8 on page 27, the network bandwidth is what you would expect from a POWER8 processor-based ESS when you run with TCP traffic and use one interface per machine.
4.4 The nsdperf command with Remote Direct Memory Access
Use or create a command file that contains the two entries that are highlighted in bold in Example 4-9. The rdma (Remote Direct Memory Access (RDMA)) and usecm parameters enable nsdperf to use RoCE.
Example 4-9 Run nsdperf with the created command file
[root@ess5-ems1 nsdperf]# cat nsdperf_commandfile
s ess5kio1
s ess5kio2
c ece-13.mmfsd.net
c ece-15.mmfsd.net
c ece-14.mmfsd.net
c ece-16.mmfsd.net
c ece-17.mmfsd.net
c ece-18.mmfsd.net
c ece-19.mmfsd.net
c ece-20.mmfsd.net
ttime 30
threads 12
buffsize 8388608
hist off
status
rdma on
usecm on
t w
t r
reset
quit
[root@ess5-ems1 nsdperf]#
[root@ess5-ems1 nsdperf]# mmdsh -N all "/usr/lpp/mmfs/samples/net/nsdperf -r mlx5_0/1,mlx5_1/2,mlx5_2/1,mlx5_3/1 -s "
Start nsdperf in server mode on all machines, as shown in Example 4-10.
Example 4-10 Starting nsdperf in server mode on all machines
# Storage cluster
[root@ess5-ems1 nsdperf]# mmdsh -N all "pkill nsdperf"
[root@ess5-ems1 nsdperf]# mmdsh -N all "/usr/lpp/mmfs/samples/net/nsdperf -r
mlx5_0/1,mlx5_1/2,mlx5_2/1,mlx5_3/1 -s "
# client cluster
[root@fscc-sr650-13 hadoop2]# mmdsh -N all "pkill nsdperf"
[root@fscc-sr650-13 hadoop2]# mmdsh -N all "/usr/lpp/mmfs/samples/net/nsdperf -s -r mlx5_0/1"
[root@ess5-ems1 nsdperf]# /usr/lpp/mmfs/samples/net/nsdperf -i nsdperf_commandfile
Connected to ess5kio1
Connected to ess5kio2
Connected to ece-13.mmfsd.net
Connected to ece-15.mmfsd.net
Connected to ece-14.mmfsd.net
Connected to ece-16.mmfsd.net
Connected to ece-17.mmfsd.net
Connected to ece-18.mmfsd.net
Connected to ece-19.mmfsd.net
Connected to ece-20.mmfsd.net
Test time set to 30 seconds
Number of tester threads set to 12
Buffer size set to 8388608 bytes
Histogram printing is now off
test time: 30 sec
data buffer size: 8388608
TCP socket send/receive buffer size: 0
tester threads: 12
parallel connections: 1
RDMA enabled: no
clients:
ece-13.mmfsd.net (192.168.12.13)
mlx5_0:1 192.168.12.13/255.255.255.0 10.0.12.13/255.255.255.0 ba59:9fff:fe27:a404
ece-14.mmfsd.net (192.168.12.14)
mlx5_0:1 192.168.12.14/255.255.255.0 10.0.12.14/255.255.255.0 ba59:9fff:fe27:a488
ece-15.mmfsd.net (192.168.12.15)
mlx5_0:1 192.168.12.15/255.255.255.0 10.0.12.15/255.255.255.0 ba59:9fff:fe27:a580
ece-16.mmfsd.net (192.168.12.16)
mlx5_0:1 192.168.12.16/255.255.255.0 10.0.12.16/255.255.255.0 ba59:9fff:fe27:a470
ece-17.mmfsd.net (192.168.12.17)
mlx5_0:1 192.168.12.17/255.255.255.0 10.0.12.17/255.255.255.0 ba59:9fff:fe27:a400
ece-18.mmfsd.net (192.168.12.18)
mlx5_0:1 192.168.12.18/255.255.255.0 10.0.12.18/255.255.255.0 ba59:9fff:fe4c:6fdc
ece-19.mmfsd.net (192.168.12.119)
mlx5_0:1 192.168.12.119/255.255.255.0 10.0.12.119/255.255.255.0 ba59:9fff:fe27:a4d8
ece-20.mmfsd.net (192.168.12.210)
mlx5_0:1 192.168.12.210/255.255.255.0 10.0.12.210/255.255.255.0 ba59:9fff:fe4c:6f80
servers:
ess5kio1 (192.168.12.102)
mlx5_0:1 10.0.12.102/255.255.255.0 192.168.12.102/255.255.255.0 0e42:a1ff:fed7:1ae8
mlx5_2:1 10.0.12.103/255.255.255.0 0e42:a1ff:fed7:1bdc
mlx5_3:1 10.0.12.113/255.255.255.0 0e42:a1ff:fed7:1bdd
ess5kio2 (192.168.12.104)
mlx5_0:1 10.0.12.104/255.255.255.0 192.168.12.104/255.255.255.0 0e42:a1ff:feed:c108
mlx5_2:1 10.0.12.105/255.255.255.0 0e42:a1ff:feed:c104
mlx5_3:1 10.0.12.115/255.255.255.0 0e42:a1ff:feed:c105
RDMA is now on
Connection Manager is now enabled
8-2 write 72100 MB/sec (8600 msg/sec), cli 3% srv 1%, time 30, buff 8388608, th 12, RDMA
8-2 read 73500 MB/sec (8760 msg/sec), cli 2% srv 5%, time 30, buff 8388608, th 12, RDMA
[root@ess5-ems1 nsdperf]#
The results depend on the model that you use. The recent ESS 5000 models can run network traffic to saturate nearly four 100 GbE links. Future models might come with even higher bandwidth to operate efficiently in a 200 High Dynamic Range (HDR) network.
After the network shows acceptable results, you can proceed and configure IBM Spectrum Scale.
4.5 Debugging method for a network by using system on-board tools
This section describes what you can do if you do not see the expected bandwidth and you want to generate more measurements for further debugging. As an example, we have a node with a dual-port 100 Enhanced Data Rate (EDR) GbE connection and another node with four ports. The OpenFabrics Enterprise Distribution (OFED) standard tools cannot be used as is for running a workload with multiple ports, but we can run multiple instances to accomplish this task. If we use more than one adapter, understand that OFED tools like ib_read_bw and ib_write_bw are missing the feature to specify a specific adapter port to use for the test when initiating the ib_[read,write,send]_bw command. Therefore, the easiest way to accomplish our goal is to temporarily add IP aliases to the adapters. By using these temporary IP addresses in the test, a clear relationship to the port is ensured.
Our example has EMS NodeA (Example 4-11) and Server NodeB (Example 4-12 on page 31).
Example 4-11 EMS NodeA
[root@ems5000 ~]# ibdev2netdev
mlx5_0 port 1 ==> enp1s0f0 (Up)
mlx5_1 port 1 ==> enp1s0f1 (Up)
[root@ems5000 ~]#
[root@ems5000 ~]# ip a add 192.168.50.100/24 dev enp1s0f0
[root@ems5000 ~]# ip a add 192.168.51.100/24 dev enp1s0f1
[root@ems5000 ~]# ip -4 a | grep inet | grep 192
inet 192.168.50.100/24 scope global enp1s0f0
inet 192.168.51.100/24 scope global enp1s0f1
Example 4-12 Server NodeB
[root@ess5kio1 ~]# ibdev2netdev
mlx5_0 port 1 ==> enp1s0f0 (Up)
mlx5_1 port 1 ==> enp1s0f1 (Up)
[...]
[root@ess5kio1 ~]# ip a add 192.168.50.101/24 dev enp1s0f0
[root@ess5kio1 ~]# ip a add 192.168.51.101/24 dev enp1s0f1
[root@ess5kio1 ~]#
Open a session on each adapter of the “server” node but with a different port:
SCREEN 1: [root@ess5kio1 ~]# ib_read_bw -d mlx5_0 -R --run_infinitely
SCREEN 2: [root@ess5kio1 ~]# ib_read_bw -d mlx5_1 -R -p 10000 --run_infinitely
Open two sessions on Node A:
[root@ems5000 ~]# ib_read_bw -d mlx5_0 -R 192.168.50.101 --run_infinitely
[root@ems5000 ~]# ib_read_bw -d mlx5_1 -R 192.168.51.101 -p 10000 –run_infinitely
Run the test so that your window looks like the example that is shown in Figure 4-1.
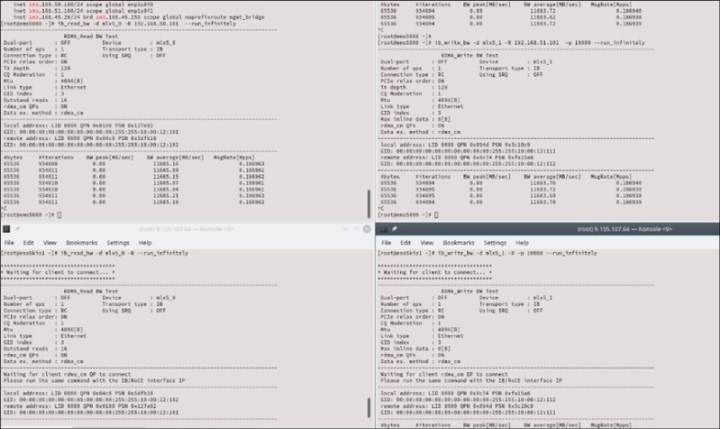
Figure 4-1 Command-line example: Parallel OFED tool test
You should get output from both connections simultaneously. Remember to remove the temporary IP address from the adapters after you are done.
..................Content has been hidden....................
You can't read the all page of ebook, please click here login for view all page.