

Practical performance management
This chapter describes the tools, data, and activities that are available for supporting the DS8000 performance management processes by using IBM Storage Insights and IBM Spectrum Control.
This chapter includes the following topics:
7.1 Introduction to practical performance management
Performance management processes go along with inputs, actors, and roles. Performance management processes include operational processes, such as data collection and alerting, tactical processes, such as performance problem determination and analysis, and strategic processes, such as long-term trending. This chapter defines the tools, metrics, and processes that are required to support the operational, tactical, and strategic performance management processes by using IBM Spectrum Control, IBM Storage Insights and IBM Storage Insights Pro. These tools do very similar functions with the following differences. IBM Spectrum Control is installed on premises, IBM Storage Insights is available free of charge to all IBM block storage customers with a subset of the full functionality in the paid version of IBM Storage Insights Pro. Both of these are in the IBM cloud with a data collector installed inside the data center. With a license for IBM Spectrum Control the user is entitled to IBM Storage Insights Pro.
7.2 Performance management tools
Tools for collecting, monitoring, and reporting on DS8000 performance are critical to the performance management processes. The tools provide support for the DS8000 performance management processes with the following features, which are briefly described in Table 7-1. Furthermore, this chapter describes some of the most important Tactical/Strategic items.
Table 7-1 IBM Spectrum Control and Storage Insights supported activities for performance processes
|
Process
|
Activities
|
Feature
|
|
Operational
|
Performance data collection for ports, arrays, volumes, pools, nodes (formerly called controllers), and host connections. Switch performance metrics can also be collected.
|
Performance monitor jobs.
|
|
Operational
|
Alerting.
|
Alerts and threshold violations.
|
|
Tactical/
Strategic |
Performance reporting of ports, pools, array, volumes, nodes, host connections, and switches.
|
Web-based GUI, IBM Cognos® (including predefined reports), and TPCTOOL.
|
|
Tactical
|
Performance analysis and tuning.
|
Tool facilitates thorough data collection and reporting.
|
|
Tactical
|
Short-term reporting.
|
GUI charting with the option to export data to analytical tools.
|
|
Tactical
|
Advanced Analytics in IBM Spectrum Control.
|
Tiering and Balancing Analysis.
|
|
Strategic
|
Long-term reporting.
|
GUI charting with the option to export data to analytical tools.
|
Additional performance management processes that complement IBM Spectrum Control are shown in Table 7-2 on page 141.
Table 7-2 Additional tools
|
Process
|
Activity
|
Alternative
|
|
Strategic
|
Sizing
|
Storage Modeler and general rules (see Chapter 6, “Performance planning tools” on page 125)
|
|
Strategic
|
Planning
|
Logical configuration performance considerations (see Chapter 4, “Logical configuration performance considerations” on page 59).
|
|
Operational
|
Host data collection performance and alerting
|
Native host tools.
|
|
Tactical
|
Host performance analysis and tuning
|
Native host tools.
|
|
Operational
|
Monitoring performance of SAN switches
|
Native switch tools.
|
7.2.1 IBM Spectrum Control and IBM Storage Insights Pro overview
IBM Spectrum Control and IBM Storage Insights Pro reduce the complexity of managing SAN storage devices by allowing administrators to configure, manage, and monitor storage devices and switches from a single console. Most of the examples that will be used in this chapter will focus on IBM Storage Insights Pro. Just remember that you have the ability to see as much or more in IBM Spectrum Control and a subset for a shorter period of time in IBM Storage Insights.
IBM Storage Insights
IBM Storage Insights provides a level of visibility across your storage environment to help you manage complex storage infrastructures including IBM block storage systems as well as SAN fabric devices. Is is a cloud-based service that enables you to deploy quickly and save storage administration time while optimizing your storage. It allows you to monitor the basic health, status and performance of your storage systems. It also helps automate aspects of the support process to enable faster resolution of issues by allowing you to open tickets directly from the web browser interface, upload data to support and monitor your tickets. Storage Insights requires a data collector to be installed in the data center to gather capacity and performance statistics that get uploaded to the IBM Cloud®. The user is able to view all of the information available in Storage Insights for 24 hours.
IBM Storage Insights Pro
IBM Storage Insights Pro is based on a capacity based subscription. It includes all of the features found in the basic version plus a more comprehensive view of performance, capacity and health. There are additional reporting features available and the data collected can be viewed for up to two years.
IBM Spectrum Control
IBM Spectrum Control is installed on a server in the data center and includes all the capabilities of Storage Insights/Pro however it does not send data to IBM. It can maintain the data at the user’s specified time frame, it collects data from the monitored systems as a more frequent rate, and has the ability to integrate with system’s management applications (such as LDAP). If the user is licensed for IBM Spectrum Control they can also use Storage Insights Pro at no additional cost.
For a full list of the features that are provided in IBM Spectrum Control and Storage Insights, go to the following IBM websites:
For more information about the configuration and deployment of storage by using IBM Spectrum Control, see these publications:
•IBM Spectrum Family: IBM Spectrum Control Standard Edition, SG24-8321
•Regain Control of your Environment with IBM Storage Insights, REDP-5231
The table in Figure 7-1 on page 142 provides a side by side comparison of these very powerful options.

Figure 7-1 Capabilities for IBM Storage Insights, Storage Insights Pro and Spectrum Control
On the IBM Spectrum Control and IBM Storage Insights Pro Overview window of a selected DS8000 storage system, performance statistics for that device are displayed. Figure 7-2 on page 143 is an example of IBM Spectrum Control. While IBM Storage Insights Pro has a slightly different look and feel, the same information can be seen when selecting the storage system, as shown in Figure 7-3.

Figure 7-2 Overview window of a DS8000 storage system in IBM Spectrum Control

Figure 7-3 IBM Storage Insights Pro Overview
In the left navigation section of IBM Spectrum Control, you can select the aggregated status of internal or related resources. The Actions dropdown menu allows you do view performance, capacity as well as additional functions supported in IBM Spectrum Control. The dropdown list next to the system name allows you to select any one of the systems being monitored. This is shown in Figure 7-4 on page 144.

Figure 7-4 IBM Spectrum Control resources and actions
To view similar items in IBM Storage Insights Pro simply click on the down arrow under the category or one of the tabs as shown in Figure 7-5 on page 144.

Figure 7-5 Finding resources in IBM Storage Insights.
7.2.2 IBM Spectrum Control measurement of DS8000 components
IBM Spectrum Control and Storage Insights/Pro can gather information about the component levels, as shown in Figure 7-6, for the DS8000 storage system. Displaying a metric depends on the ability of the storage system and its mechanisms to provide the performance data and related information, such as the usage of its components. Figure 7-6 drills down from the top-level subsystem view to give you a better understanding of how and what data is displayed.
Both IBM Spectrum Control and Storage Insights Pro monitor metrics for the following internal resources:
•Volumes
•Pools
•Arrays
•Nodes
•Fibre Channel Ports
•Host Connections
Additional monitoring is available for servers, fabrics and switches.

Figure 7-6 Physical view compared to IBM Spectrum Control Performance Report Items
|
Metrics: A metric is a numerical value that is derived from the information that is provided by a device. It is the raw data and a calculated value. For example, the raw data is the transferred bytes, but the metric uses this value and the interval to show the bytes/second.
|
For the DS8000 storage system, the native application programming interface (NAPI) is used to collect performance data, in contrast to the SMI-S Standard that is used for third-party devices.
The DS8000 storage system interacts with the NAPI in the following ways:
•Access method used: Enterprise Storage Server® Network Interface (ESSNI)
•Failover:
– For the communication with a DS8000 storage system, IBM Spectrum Control and Storage Insights use the ESSNI client. This library is basically the same library that is included in any DS8000 command-line interface (DSCLI). Because this component has built-in capabilities to fail over from one Hardware Management Console (HMC) to another HMC, a good approach is to specify the secondary HMC IP address of your DS8000 storage system.
– During failover the query job may fail, but the next command that is sent to the device will use the redundant connection.
•Network: No special network considerations exist. IBM Spectrum Control and Storage Insights need to be able to connect to the HMC.
Subsystem
On the subsystem level, metrics are aggregated from multiple records to a single value per metric to give the performance of a storage subsystem from a high-level view, based on the metrics of other components. This aggregation is done by adding values, or calculating average values, depending on the metric.
Cache
The cache in Figure 7-6 plays a crucial role in the performance of any storage subsystem.
Metrics, such as disk-to-cache operations, show the number of data transfer operations from drives to cache. The number of data transfer operations from drives to cache is called staging for a specific volume. Disk-to-cache operations are directly linked to read activity from hosts. When data is not found in the DS8000 cache, the data is first staged from back-end drives into the cache of the DS8000 storage system and then transferred to the host.
Read hits occur when all the data that is requested for a read data access is in cache. The DS8000 storage system improves the performance of read caching by using Sequential Prefetching in Adaptive Replacement Cache (SARC) staging algorithms. For more information about the SARC algorithm, see 1.2.2, “Advanced caching algorithms” on page 9. The SARC algorithm seeks to store those data tracks that have the greatest probability of being accessed by a read operation in cache.
The cache-to-disk operation shows the number of data transfer operations from cache to drives, which is called destaging for a specific volume. Cache-to-disk operations are directly linked to write activity from hosts to this volume. Data that is written is first stored in the persistent memory (also known as nonvolatile storage (NVS)) at the DS8000 storage system and then destaged to the back-end drive. The DS8000 destaging is enhanced automatically by striping the volume across all the drives in one or several ranks (depending on your configuration). This striping, or volume management that is done by Easy Tier, provides automatic load balancing across DDMs in ranks and an elimination of the hot spots.
The Write-cache Delay I/O Rate or Write-cache Delay Percentage because of persistent memory allocation gives you information about the cache usage for write activities. The DS8000 storage system stores data in the persistent memory before sending an acknowledgment to the host. If the persistent memory is full of data (no space available), the host receives a retry for its write request. In parallel, the subsystem must destage the data that is stored in its persistent memory to the back-end drive before accepting new write operations from any host.
If a volume experiences delays in the write operations due to persistent memory constraint, consider moving, consider moving the volume to a less busy rank or spread this volume on multiple ranks (increase the number of DDMs used). If this solution does not fix the persistent memory constraint problem, consider adding cache capacity to your DS8000 storage system.
As shown in Figure 7-7 on page 147 and Figure 7-8, you can use IBM Spectrum Control and Storage Insights Pro to monitor the cache metrics easily.

Figure 7-7 Available cache metrics in IBM Spectrum Control

Figure 7-8 Cache Metrics in Storage Insights Pro
Controller/Nodes
The DS8000 processor complexes are referred to as Nodes. A DS8000 storage system has two processor complexes, and each processor complex independently provides major functions for the storage system. Examples include directing host adapters (HAs) for data transfer to and from host processors, managing cache resources, and directing lower device interfaces for data transfer to and from the flash media. To analyze performance data, you must know that most volumes can be assigned/used by only one controller at a time.
Node metrics can be selected in IBM Storage Insights Pro from the Nodes view and Edit Table Metrics, as shown in Figure 7-9 on page 148.

Figure 7-9 Select node metrics in IBM Storage Insights Pro
You can view the performance of the volumes (all or a subset) by selecting Volumes in the Internal Resources section and then selecting the Performance tab, as shown in Example 7-10.

Figure 7-10 View volume performance in IBM Storage Insights Pro
You also can see which volumes are assigned to which node in the volumes window by selecting Node from the available columns in the table, as shown in Figure 7-11 on page 149. There are many other points that can be selected to view in the table.

Figure 7-11 Column selections
Ports
The fiber channel port information reflects the performance metrics for the front-end DS8000 ports that connect the DS8000 storage system to the SAN switches or hosts. Additionally, port error rate metrics, such as Error Frame Rate, are also available. The DS8000 HA card has four or eight ports. The WebUI does not reflect this aggregation, but if necessary, custom reports can be created with native SQL statements to show port performance data that is grouped by the HA to which they belong. Monitoring and analyzing the ports that belong to the same card are beneficial because the aggregated throughput is less than the sum of the stated bandwidth of the individual ports.
For more information about the DS8000 port cards, see Chapter 2.3, “Host adapters” on page 21.
.
|
Port metrics: IBM Spectrum Control and Storage Insights Pro report on many port metrics, so the ports on the DS8000 storage system are the front-end part of the storage device.
|
Array
The array name that is shown in the WebUI, as shown in Figure 7-12, directly refers to the array on the DS8000 storage system as listed in the DS GUI or DSCLI.

Figure 7-12 Viewing RAID Arrays in IBM Storage Insights Pro
When you click the Performance tab, the top five performing arrays are displayed with their corresponding graphs, as shown in Figure 7-13 on page 150.

Figure 7-13 Top 5 RAID arrays’ performance
Volumes on the DS8000 storage systems are primarily associated with a pool, and a pool relates to a set of ranks. To associate quickly all arrays with their related ranks and pools, use the output of the DSCLI lsarray -l and lsrank -l commands, as shown in Example 7-1.
Example 7-1 DS8000 array site, array, and rank association
dscli> showrank r23
ID R23
SN -
Group 1
State Normal
datastate Normal
Array A15
RAIDtype 6
extpoolID P5
extpoolnam rd6_fb_1
volumes 1100,1101,1102,1103,1104,1105
stgtype fb
exts 12922
usedexts 174
widearrays 0
nararrays 1
trksize 128
strpsize 384
strpesize 0
extsize 16384
encryptgrp -
migrating(in) 0
migrating(out) 0
dscli> lsrank -l R23
ID Group State datastate Array RAIDtype extpoolID extpoolnam stgtype exts usedexts
=====================================================================================
R23 1 Normal Normal A15 6 P5 rd6_fb_1 fb 12922 174
dscli> lsarray -l A15
Array State Data RAIDtype arsite Rank DA Pair DDMcap (10^9B) diskclass encrypt
==========================================================================================
A15 Assigned Normal 6 (5+P+Q+S) S16 R23 2 3000.0 NL unsupported
dscli> lsarraysite S16
arsite DA Pair dkcap (10^9B) State Array
===========================================
S16 2 3000.0 Assigned A15
A DS8000 array is defined on an array site with a specific RAID type. A rank is a logical construct to which an array is assigned. A rank provides a number of extents that are used to create one or several volumes. A volume can use the DS8000 extents from one or several ranks but all within the same pool. For more information, see Chapter 3.1, “Logical Configuration” on page 32, and Chapter 3.2.4, “Easy Tier considerations” on page 55.
|
Associations: On a configured DS8000 storage system, there is a 1:1 relationship between an array site, an array, and a rank. However, the numbering sequence can differ for arrays, ranks, and array sites, for example, array site S16 = array A15 = rank R23.
In most common logical configurations, users typically sequence them in order, for example, Array Site = S1 = Array A0 = Rank R0. If they are not in order, you must understand on which array the analysis is performed.
|
Example 7-1 on page 151 shows the relationships among a DS8000 rank, an array, and an array site with a typical divergent numbering scheme by using DSCLI commands. Use the showrank command to show which volumes have extents on the specified rank.
In the Array performance chart, you can include both front-end and back-end metrics. The back-end metrics can be selected on the Disk Metrics Tab. They provide metrics from the perspective of the controller to the back-end array sites. The front-end metrics relate to the activity between the server and the controller.
There is a relationship between array operations, cache hit ratio, and percentage of read requests:
•When the cache hit ratio is low, the DS8000 storage system has frequent transfers from drives to cache (staging).
•When the percentage of read requests is high and the cache hit ratio is also high, most of the I/O requests can be satisfied without accessing the drives because of the cache management prefetching algorithm.
•When there is heavy write activity, it leads to frequent transfers from cache to drives (destaging).
Comparing the performance of different arrays shows whether the global workload is equally spread on the drives of your DS8000 storage system. Spreading data across multiple arrays increases the number of drives that is used and optimizes the overall performance.
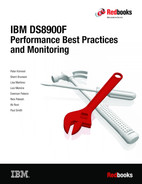
Volumes
The volumes, called LUNs, are shown in Figure 7-14 on page 153. The host server sees the volumes as physical drives and treats them as physical drives.
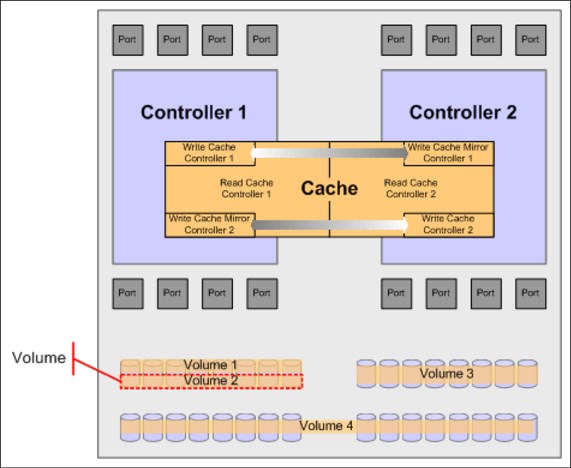
Figure 7-14 DS8000 volume
Analysis of volume data facilitates the understanding of the I/O workload distribution among volumes, and workload characteristics (random or sequential and cache hit ratios). A DS8000 volume can belong to one or several ranks, as shown in Figure 7-14 on page 153 (for more information, see Chapter 3.2, “Data placement on ranks and extent pools” on page 50). Especially in managed multi-rank extent pools with Easy Tier automatic data relocation enabled, the distribution of a certain volume across the ranks in the extent pool can change over time.
With IBM Spectrum Control and Storage Insights Pro, you can see the Easy Tier, Easy Tier Status, and the capacity values for pools, shown in Figure 7-15 on page 153, and volumes, shown in Figure 7-16.

Figure 7-15 Easy Tier pool information in IBM Storage Insights Pro

Figure 7-16 Volume Easy Tier information in IBM Storage Insights Pro
The analysis of volume metrics shows the activity of the volumes on your DS8000 storage system and can help you perform these tasks:
•Determine where the most accessed data is and what performance you get from the volume.
•Understand the type of workload that your application generates (sequential or random and the read or write operation ratio).
•Determine the cache benefits for the read operation (cache management prefetching algorithm SARC).
•Determine cache bottlenecks for write operations.
•Compare the I/O response observed on the DS8000 storage system with the I/O response time observed on the host.
The relationship of certain RAID arrays and ranks to the DS8000 pools can be derived from the RAID array list window, which is shown in Figure 7-12.
From there, you can easily see the volumes that belong to a certain pool by right-clicking a pool, selecting View Properties, and clicking the Volumes tab.
Figure 7-17 on page 154 shows the relationship of the raid array, pools, and volumes for a raid array.

Figure 7-17 Volumes view within Pool Properties
In addition, to associate quickly the DS8000 arrays to array sites and ranks, you might use the output of the DSCLI commands lsrank -l and lsarray -l, as shown in Example 7-1 on page 151.
7.2.3 General IBM Spectrum Control and IBM Storage Insights Pro measurement considerations
To understand the IBM Spectrum Control and IBM Storage Insights Pro measurements of the DS8000 components, it is helpful to understand the context for the measurement. The measurement facilitates insight into the behavior of the DS8000 storage system and its ability to service I/O requests. The DS8000 storage system handles various types of I/O requests differently. Table 7-3 shows the behavior of the DS8000 storage system for various I/O types.
Table 7-3 DS8000 I/O types and behavior
|
I/O type
|
DS8000 high-level behavior
|
|
Sequential read
|
Pre-stage reads in cache to increase cache hit ratio.
|
|
Random read
|
Attempt to find data in cache. If not present in cache, read from back end.
|
|
Sequential write
|
Write data to the NVS of the processor complex owning volume and send a copy of the data to cache in the other processor complex. Upon back-end destaging, perform prefetching of read data and parity into cache to reduce the number of disk operations on the back end.
|
|
Random write
|
Write data to NVS of the processor complex owning volume and send a copy of the data to cache in the other processor complex. Destage modified data from NVS to disk as determined by Licensed Internal Code.
|
Understanding writes to a DS8000 storage system
When the DS8000 storage system accepts a write request, it processes it without physically writing to the drives. The data is written into both the processor complex to which the volume belongs and the persistent memory of the second processor complex in the DS8000 storage system. Later, the DS8000 storage system asynchronously destages the modified data out to the drives. In cases where back-end resources are constrained, NVS delays might occur. IBM Spectrum Control and Storage Insights report on these conditions with the following front-end metrics: Write Cache Delay I/O Rate and Write Cache Delay I/O Percentage.
Understanding reads on a DS8000 storage system
If the DS8000 storage system cannot satisfy the read I/O requests within the cache, it transfers data from the drives. The DS8000 storage system suspends the I/O request until it reads the data. This situation is called cache-miss. If an I/O request is cache-miss, the response time includes the data transfer time between host and cache, and also the time that it takes to read the data from drives to cache before sending it to the host. The various read hit ratio metrics show how efficiently cache works on the DS8000 storage system.
The read hit ratio depends on the characteristics of data on your DS8000 storage system and applications that use the data. If you have a database and it has a high locality of reference, it shows a high cache hit ratio because most of the data that is referenced can remain in the cache. If your database has a low locality of reference, but it has the appropriate sets of indexes, it might also have a high cache hit ratio because the entire index can remain in the cache.
A database can be cache-unfriendly by nature. An example of a cache-unfriendly workload is a workload that consists of large sequential reads to a highly fragmented file system. If an application reads this file, the cache hit ratio is low because the application never reads the same data because of the nature of sequential access. In this case, defragmentation of the file system improves the performance. You cannot determine whether increasing the size of cache improves the I/O performance without knowing the characteristics of the data on your DS8000 storage system.
Monitor the read hit ratio over an extended period:
•If the cache hit ratio is historically low, it is most likely because of the nature of the data access patterns. Defragmenting the file system and making indexes if none exist might help more than adding cache.
•If you have a high cache hit ratio initially and it decreases as the workload increases, adding cache or moving part of the data to volumes that are associated with the other processor complex might help.
Interpreting the read-to-write ratio
The read-to-write ratio depends on how the application programs issue I/O requests. In general, the overall average read-to-write ratio is in the range of 75% - 80% reads.
For a logical volume that has sequential files, you must understand the application types that access those sequential files. Normally, these sequential files are used for either read only or write only at the time of their use. The DS8000 cache management prefetching algorithm (SARC) determines whether the data access pattern is sequential. If the access is sequential, contiguous data is prefetched into cache in anticipation of the next read request.
IBM Storage Insights Pro report the reads and writes through various metrics. For a description of these metrics in greater detail, see 7.3, “IBM Storage Insights Pro data collection considerations” on page 156.
7.3 IBM Storage Insights Pro data collection considerations
This section describes the performance data collection considerations, such as time stamps, durations, and intervals.
7.3.1 Time stamps
IBM Storage Insights Pro uses the time stamp of the source devices when it inserts data into the database. If the server clock is not synchronized with the rest of your environment, it does not include any additional offset because you might need to compare the performance data of the DS8000 storage system with the data gathered on a server or other connected SAN devices, such as FlashSystem or switch metrics.
The data is collected at the indicated resource time stamp in the server time zone. It receives the time zone information from the devices (or the NAPIs) and uses this information to adjust the time in the reports to the local time. Certain devices might convert the time into Coordinate Universal Time time stamps and not provide any time zone information.
This complexity is necessary to compare the information from two subsystems in different time zones from a single administration point. This administration point is the GUI. If you open the GUI in different time zones, a performance diagram might show a distinct peak at different times, depending on its local time zone.
When using IBM Storage Insights Pro to compare data from a server (for example, iostat data) with the data of the storage subsystem, it is important to know the time stamp of the storage subsystem. The time zone of the device is shown in the DS8000 Properties window.
To ensure that the time stamps on the DS8000 storage system are synchronized with the other infrastructure components, the DS8000 storage system provides features for configuring a Network Time Protocol (NTP) server. To modify the time and configure the HMC to use an NTP server, see the following publications:
•IBM DS8870 Architecture and Implementation (Release 7.5), SG24-8085
•IBM DS8880 Architecture and Implementation (Release 8), SG24-8323
•IBM DS8900F Architecture and Implementation (Release 9.2), SG24-8456
As IBM Storage Insights Pro can synchronize multiple performance charts that are opened in the WebUI to display the metrics at the same time, use an NTP server for all components in the SAN environment.
7.3.2 Duration
IBM Storage Insights Pro collects data continuously. From a performance management perspective, collecting data continuously means that performance data exists to facilitate reactive, proactive, and even predictive processes, as described in Chapter 7, “Practical performance management” on page 139.
7.3.3 Intervals
In IBM Storage Insights Pro, the data collection interval is referred to as the sample interval. The sample interval for the DS8000 performance data collection tasks is 5- 60 minutes. A shorter sample interval results in a more granular view of performance data at the expense of requiring additional database space. The appropriate sample interval depends on the objective of the data collection. Table 7-4 on page 157 displays example data collection objectives and reasonable values for a sample interval.
Table 7-4 Sample interval examples
|
Objective
|
Sample interval
|
|
Probe of the entire system
|
once a day
|
|
Performance
|
5 minutes
|
Changes in the logical configuration of a system will result in a non-scheduled probe in both IBM Storage Insights Pro and IBM Spectrum Control.
In support of ongoing performance management, a reasonable sample interval is 5 minutes. An interval of 5 minutes provides enough granularity to facilitate reactive performance management. In certain cases, the level of granularity that is required to identify the performance issue is less than 5 minutes. In these cases, you can reduce the sample interval to a 1-minute interval in IBM Spectrum Control only. IBM Spectrum Control also provides reporting at higher intervals, including hourly and daily. It provides these views automatically.
|
Attention: Although the 1-minute interval collection is the default for some devices, the 5-minute interval is considered a good average for reviewing data and is the only option in IBM Storage Insights. However, some issues can occur within this time interval resulting in peaks being averaged out, which might not be as apparent as they are with 1-minute interval collection. In such situations, the 1-minute interval is most appropriate for offering a more granular view that results in a more effective analysis. However, a 1-minute interval results in copious amount of data being collected, resulting in a fast growing database. Therefore, it should be used only for troubleshooting purposes and is only available in IBM Spectrum Control.
|
7.4 IBM Storage Insights Pro performance metrics
IBM Storage Insights Pro has many metrics available for reporting the health and performance of the DS8000 storage system.
For a list of available performance metrics for the DS8000 storage system, see the IBM Storage Insights Pro in IBM Documentation Center:
7.4.1 DS8000 key performance indicator thresholds
This section provides some additional information about a subset of critical metrics. It provides suggested threshold values as general recommendations for alerting for various DS8000 components, as described in 7.4.2, “Alerts and thresholds” on page 159. As with any recommendation, you must adjust them for the performance requirements of your environment.
|
Note: IBM Storage Insights Pro and IBM Spectrum Control also have other metrics that can be adjusted and configured for your specific environment to suit customer demands.
|
Colors are used to distinguish the components that are shown in Table 7-5.
Table 7-5 DS8000 key performance indicator thresholds
|
Component
|
Tab
|
Metric
|
Threshold
|
Comment
|
|
Node
|
Volume Metrics
|
Cache Holding Time
|
< 200
|
Indicates high cache track turnover and possibly cache constraint.
|
|
Node
|
Volume Metrics
|
Write Cache Delay Percentage
|
> 1%
|
Indicates writes delayed because of insufficient memory resources.
|
|
Array
|
Drive Metrics
|
Utilization Percentage
|
> 70%
|
Indicates drive saturation. For
IBM Storage Insights Pro, the default value on this threshold is 50%. |
|
Array
|
Drive Metrics
|
Overall Response Time
|
> 35
|
Indicates busy drives.
|
|
Array
|
Drive Metrics
|
Write Response Time
|
> 35
|
Indicates busy drives.
|
|
Array
|
Drive Metrics
|
Read Response Time
|
> 35
|
Indicates busy drives.
|
|
Port
|
Port Metrics
|
Total Port I/O Rate
|
Depends
|
Indicates transaction intensive load. The configuration depends on the HBA, switch, and other components.
|
|
Port
|
Port Metrics
|
Total Port Data Rate
|
Depends
|
If the port data rate is close to the bandwidth, this rate indicates saturation. The configuration depends on the HBA, switch, and other components.
|
|
Port
|
Port Metrics
|
Port Send Response Time
|
> 2
|
Indicates contention on I/O path from the DS8000 storage system to the host.
|
|
Port
|
Port Metrics
|
Port Receive Response Time
|
> 2
|
Indicates a potential issue on the I/O path or the DS8000 storage system back end.
|
|
Port
|
Port Metrics
|
Total Port Response Time
|
> 2
|
Indicates a potential issue on the I/O path or the DS8000 storage system back end.
|
7.4.2 Alerts and thresholds
IBM Storage Insights Pro uses the term data collector for the process that is set up to gather data from a subsystem. This is shown under the Configuration > Data Collection window. The data collector collects information at 5 minute intervals and stores the data in an IBM cloud database. The performance data is retained for 1 year and is available for analysis by using several methods that are described in 7.5, “IBM Storage Insights Pro reporting options” on page 162.
You can use IBM Storage Insights Pro to define performance-related alerts that can trigger an event when the defined thresholds are reached. Even though it works in a similar manner to a monitor without user intervention, the actions are still performed at specified intervals of the data collection job.
With Storage Insights Pro you can create alert policies to manage the alert conditions for multiple resources. You can create a new policy or copy an existing policy to modify the alerts definitions and to add resources to monitor. To create a new policy for DS8000 complete the following steps:
1. From the dashboard select Configuration > Alert Policies as shown in Figure 7-18 on page 159. You can copy and modify an existing policy or create a new policy.

Figure 7-18 Configuring Alert policies
2. To create a new policy, select Create Policy. Enter a Name and select the type of resource from the list, for example block storage. Select the type of storage system you want to monitor for example DS8000. A list of DS8000 names managed by Storage Insights Pro will be displayed. You can choose any or all DS8000 to add to this policy click create as shown in Figure 7-19. Notice that if a system already has a policy associated with it, that will be displayed under “Current Policy”.

Figure 7-19 Create a new Policy
Next define alerts for the category of the attributes that you want to alert on:
3. General: Attributes for the key properties of a resource, such as status, data collection status and firmware.
4. Capacity: Attributes for capacity statistics of a resource, such as available capacity, used capacity, drive capacity, Safeguarded capacity, and more. Total of 26 alerts can be set as shown in Figure 7-20 on page 160.

Figure 7-20 Defining Alerts for Capacity categories
5. Performance: You can define alerts that are triggered when the performance of a resource falls outside a specified threshold. You:
a. Click Add Metric.
b. Select the check box for the metric for which you want to set the threshold for Volume, Drive or Port.
c. Click save.
6. Once the performance metrics are selected you can specify the conditions for generating an alert as shown in Figure 7-21 on page 161:
a. Select >= or <=.
b. Enter a threshold value.
c. Select a severity for the alert.
d. Click save.

Figure 7-21 Setting Performance Alerts
|
Reference: For more information about setting Thresholds and Alert suppressions in IBM Storage Insights Pro, see IBM Documentation Storage Insights at:
|
You should configure the thresholds that are most important and most relevant to the environmental needs to assist with good planning.
IBM Storage Insights Pro provides recommended values for threshold values that do not vary much between environments. However, for metrics that measure throughput and response times, thresholds can vary because of workload, model of hardware, amount of cache memory, and other factors. In these cases, there are no recommended values. To help determine threshold values for a resource, collect performance data over time to establish a baseline of the normal and expected performance behavior for that resource.
After you determine a set of baseline values, define alerts to trigger if the measured performance behavior falls outside of the normally expected range.
The alerts for a DS8000 storage system can be seen, filtered, removed, acknowledged, or exported in the storage system Alert window, as shown in Figure 7-22.

Figure 7-22 Viewing alerts for a system
Limitations to alert definitions
There are a few limitations to alert levels:
•Thresholds are always active. They cannot be set to exclude specific periods. This setting can be mitigated by using alert suppression settings.
•Detailed knowledge of the workload is required to use thresholds effectively.
|
False positive alerts: Configuring thresholds too conservatively can lead to an excessive number of false positive alerts.
|
7.5 IBM Storage Insights Pro reporting options
IBM Storage Insights Pro can easily create inventory reports, capacity and performance reports, and reports about storage consumption. This section provides an overview of the various options and their appropriate usage in ongoing performance management of a DS8000 storage system and all the monitored resources.
In Storage Insights Pro you can create a number of reports that you can schedule and send by email:
•Predefined capacity reports that you can configure and refine the information that is included in the report. Create a predefined report about storage systems, pools, or tiered pools.
•Custom reports that you can create to include asset, capacity, configuration, or health status or performance information about your storage resources. You can specify a relative time range for the capacity information in the report, such as the last hour, 6 hours, 12 hours, day, week, month, 6 months, or year. Depending on the time range that you specify, the aggregated values for the performance information are shown in the report.
•Consumer reports that you can create to help plan capacity purchases and make your organization aware of the cost and the amount of the storage that is used by storage consumers, create chargeback and consumer reports.
For the available tutorials related to creating reports see the IBM Storage Insights Pro in IBM Documentation Center at:
|
Note: You must have an Administrator role to create, edit, or delete custom, predefined capacity and inventory reports, and chargeback and storage consumption reports. Users with a Monitor role can run and view the reports that are shown on the Reports page, but they can't edit or delete reports.
|
Additional reporting
In IBM Storage Insights Pro, export options are available. To export the data that is used in the performance chart, use the export function, which is found in the upper right of the chart as shown in Figure 7-23 on page 163, or under the Actions menu in other views.

Figure 7-23 Performance export functions
To export the summary table underneath the chart, click Action → More → Export, and select the desired format.
Charts are automatically generated for most of the predefined reports. Depending on the type of resource, the charts show statistics for space usage, workload activity, bandwidth percentage, and other statistics. You can schedule reports and specify the report output as HTML, PDF, and CSV formats. You can also configure reports to save the report output to your local file system, and to send reports as mail attachments.
7.6 Insights
IBM Storage Insights Pro provides additional functions to gain insights into the performance of the resources that are monitored in your storage environment. You can view the recommendations that help you address issues in your storage environment and gain insights into storage reclamation and performance.
These functions are not included in the entitled version of IBM Storage Insights.
7.6.1 Advisor
To display the Advisor page Click Insights > Advisor, shown in Figure 7-24 on page 164. You can view, evaluate, and manage events that include a recommended action. For each event that includes recommended actions, you can view details such as the severity, the time it occurred, the device, and the internal resource on which it occurred. You can acknowledge recommended actions, and create reports about them. You can also use the filter tags on the upper part of the dashboard to quickly filter your recommended actions. You can also customize the view by selecting the columns you want to see, just below the filter box.

Figure 7-24 Advisor page
Click the recommendation detail from the Action list to view the details of a recommended action; an example of this is shown in Figure 7-25 on page 164. You can also export the table that displays the recommended actions to a file.

Figure 7-25 Viewing recommended actions
7.6.2 Performance
You can use performance metrics for volumes, drives, or ports to help you measure, identify, and troubleshoot performance issues and bottlenecks in storage systems.
To display the performance page, click Insights > Performance as shown in Figure 7-26. Up to 10 storage systems with the highest overall total I/O rate over a 12-hour period are displayed in the chart. These storage systems are listed under Resources on the left and are highlighted at the top of the performance chart legend, which is sorted by the Total I/O Rate - overall (ops/s) column. Switch between the chart and table views by selecting the toggle bottom on the to right top section of performance page as shown in Figure 7-26. View the specific details about a system by selecting just that system. Also view over different intervals, from six hours up to a year in IBM Storage Insights Pro (longer periods are available in IBM Spectrum Control). The Performance chart legend at the bottom section of the performance view is a table that shows more information about the storage systems.

Figure 7-26 Performance page
To view performance trends, select metrics for volumes, drives, ports, or node and specify a time range.
For more information about Insights to performance see the IBM Documentation center for Insights Pro at:
7.6.3 Reclamation
Use the recommendations on the reclamation page to determine if you can reclaim capacity before planning new capacity purchases. Click Insights > Reclamation to see how much capacity can be reclaimed as shown in Figure 7-27. See the savings that can be made by reclaiming capacity for tiered and non-tiered storage and a list of the reclaimable volumes. To identify the volumes that are not being used, the storage resources that you add for monitoring are regularly analyzed. A list of the volumes that are not being used is generated. You can decide in accordance with the internal procedures of your organization which of the volumes in the list can be decommissioned.

Figure 7-27 Reclamation view
Before you delete or reclaim space that was identified by IBM Storage Insights Pro, keep in mind for the volumes on IBM Spectrum Accelerate and CKD volumes on DS8000, the volumes are identified as reclaimable based on I/O activity, because information about the assignment of volumes to servers is not available. To exclude volumes in the reclamation analysis, right-click the volumes and click Exclude from Analysis. Additional actions can be performed on the volumes in the recommended reclamation list such as add to an application or general group.
For more information about reclamation with IBM Insights Pro see IBM Documentation center for Insights Pro at:
7.7 Using IBM Storage Insights Pro network functions
All SAN switch and director vendors provide management software that includes performance monitoring capabilities. The real-time SAN statistics, such as port utilization and throughput information available from SAN management software, can be used to complement the performance information that is provided by host servers or storage subsystems.
For more information about monitoring performance through a SAN switch or director point product, see the following websites:
Most SAN management software includes options to create SNMP alerts based on performance criteria, and to create historical reports for trend analysis. Certain SAN vendors offer advanced performance monitoring capabilities, such as measuring I/O traffic between specific pairs of source and destination ports, and measuring I/O traffic for specific LUNs.
In addition to the vendor point products, IBM Storage Insights Pro can be used as a monitoring and reporting tool for switch and fabric environments. It collects and reports on data for a one hour (15 minute increments) up to 1 year at 24 hour intervals for performance analysis.
IBM Storage Insights Pro provides facilities to report on fabric topology, configurations and switches, and port performance and errors. In addition, you can use IBM Storage Insights Pro to configure alerts or thresholds for port congestion. send and receive bandwidth and others. Configuration options allow the creation of events to be triggered if thresholds are exceeded. Seamless ticket management from opening and automatically uploading diagnostic information to updating and tracking tickets:
•Ability to store performance data from multiple switch vendors in a common database
•Advanced reporting and correlation between host data and switch data through custom reports
•Centralized management and reporting
•Aggregation of port performance data for the entire switch
In general, you need to analyze SAN statistics for these reasons:
•Ensure that there are no SAN bottlenecks that limit the DS8000 I/O traffic, for example, analyze any link utilization over 80%.
•Confirm that multipathing/load balancing software operates as expected.
•Isolate the I/O activity contributed by adapters on different host servers that share storage subsystem I/O ports.
•Isolate the I/O activity contributed by different storage subsystems accessed by the same host server.
For more information about IBM Storage Insights Pro functions and how to work with them, refer to:
7.8 End-to-end analysis of I/O performance problems
To support tactical performance management processes, problem determination skills and processes must exist. This section explains the logical steps that are required to perform successful problem determination for I/O performance issues. The process of I/O performance problem determination consists of the following steps:
•Define the problem.
•Classify the problem.
•Identify the I/O bottleneck.
•Implement changes to remove the I/O bottleneck.
•Validate that the changes that were made resolved the issue.
Perceived or actual I/O bottlenecks can result from hardware failures on the I/O path, contention on the server, contention on the SAN Fabric, contention on the DS8000 front-end ports, or contention on the back-end device adapters or arrays. This section provides a process for diagnosing these scenarios by using IBM Storage Insights Pro. This process was developed for identifying specific types of problems and is not a substitute for common sense, knowledge of the environment, and experience. Figure 7-28 on page 168 shows the high-level process flow.

Figure 7-28 I/O performance analysis process
I/O bottlenecks that are referenced in this section relate to one or more components on the I/O path that reached a saturation point and can no longer achieve the I/O performance requirements. I/O performance requirements are typically throughput-oriented or transaction-oriented. Heavy sequential workloads, such as tape backups or data warehouse environments, might require maximum bandwidth and use large sequential transfers. However, they might not have stringent response time requirements. Transaction-oriented workloads, such as online banking systems, might have stringent response time requirements, but have no requirements for throughput.
If a server processor or memory resource shortage is identified, it is important to take the necessary remedial actions. These actions might include but are not limited to adding additional processors, optimizing processes or applications, or adding additional memory. If there are not any resources that are constrained on the server but the end-to-end I/O response time is higher than expected for the DS8000 storage system, a resource constraint likely exists in one or more of the SAN components.
To troubleshoot performance problems, IBM Storage Insights Pro data must be augmented with host performance and configuration data. Figure 7-29 on page 169 shows a logical end-to-end view from a measurement perspective.

Figure 7-29 End-to-end measurement
Although IBM Insights Pro does not provide host performance, configuration, or error data, IBM Insights Pro provides performance data from host connections, SAN switches, and the DS8000 storage system, and configuration information and error logs from SAN switches and the DS8000 storage system.
You can create and update support tickets and automatically upload logs directly in the IBM Storage Insights interface. You can also give IBM Support permission to collect and upload log packages for storage systems without contacting you every time.
|
Tip: Performance analysis and troubleshooting must always start top-down, starting with the application (for example, database design and layout), then the operating system, server hardware, SAN, and then storage. The tuning potential is greater at the higher levels. The best I/O tuning is never carried out because server caching or a better database design eliminated the need for it.
|
Process assumptions
This process assumes that the following conditions exist:
•The server is connected to the DS8000 storage system natively.
•Tools exist to collect the necessary performance and configuration data for each component along the I/O path (server disk, SAN fabric, and the DS8000 arrays, ports, and volumes).
•Skills exist to use the tools, extract data, and analyze data.
•Data is collected in a continuous fashion to facilitate performance management.
Process flow
The order in which you conduct the analysis is important. Use the following process:
1. Define the problem. The goal is to assist you in determining the problem background and understand how the performance requirements are not being met.
|
Changes: Before proceeding any further, ensure that an adequate investigation is carried out to identify any changes that were made in the environment. Experience has proven that a correlation exists between changes made to the environment and sudden “unexpected” performance issues.
|
2. Consider checking the application level first. Has all potential tuning on the database level been performed? Does the layout adhere to the vendor recommendations, and is the server adequately sized (RAM, processor, and buses) and configured?
3. Correctly classify the problem by identifying hardware or configuration issues. Hardware failures often manifest themselves as performance issues because I/O is degraded on one or more paths. If a hardware issue is identified, all problem determination efforts must focus on identifying the root cause of the hardware errors:
a. Gather any errors on any of the host paths.
|
Physical component: If you notice significant errors when querying the path and the errors increase, there is most likely a problem with a physical component on the I/O path.
|
b. Gather the host error report and look for Small Computer System Interface (SCSI) or Fibre errors.
|
Hardware: Often a hardware error that relates to a component on the I/O path shows as a TEMP error. A TEMP error does not exclude a hardware failure. You must perform diagnostic tests on all hardware components in the I/O path, including the host bus adapter (HBA), SAN switch ports, and the DS8000 HBA ports.
|
c. Gather the SAN switch configuration and errors. Every switch vendor provides different management software. All of the SAN switch software provides error monitoring and a way to identify whether there is a hardware failure with a port or application-specific integrated circuit (ASIC). For more information about identifying hardware failures, see your vendor-specific manuals or contact vendor support.
|
Patterns: As you move from the host to external resources, remember any patterns. A common error pattern that you see involves errors that affect only those paths on the same HBA. If both paths on the same HBA experience errors, the errors are a result of a common component. The common component is likely to be the host HBA, the cable from the host HBA to the SAN switch, or the SAN switch port. Ensure that all of these components are thoroughly reviewed before proceeding.
|
d. If errors exist on one or more of the host paths, determine whether there are any DS8000 hardware errors. Log on to the HMC as "customer" and look to ensure that there are no hardware alerts. Figure 7-30 on page 171 provides a sample of a healthy DS8000 storage system. If there are any errors, you might need to open a hardware case with DS8000 hardware support.

Figure 7-30 DS8000 storage system - healthy HMC
4. After validating that no hardware failures exist, analyze server performance data and identify any disk bottlenecks. The fundamental premise of this methodology is that I/O performance degradation that relates to SAN component contention can be observed at the server through analysis of the key server-based I/O metrics.
Degraded end-to-end I/O response time is the strongest indication of I/O path contention. Typically, server physical disk response times measure the time that a physical I/O request takes from the moment that the request was initiated by the device driver until the device driver receives an interrupt from the controller that the I/O completed. The measurements are displayed as either service time or response time. They are averaged over the measurement interval. Typically, server wait or queue metrics refer to time spent waiting at the HBA, which is usually an indication of HBA saturation. In general, you need to interpret the service times as response times because they include potential queuing at various storage subsystem components, for example:
– Switch
– Storage HBA
– Storage cache
– Storage back-end drive controller
– Storage back-end paths
– Drives
|
Important: Subsystem-specific load-balancing software usually does not add any performance impact and can be viewed as a pass-through layer.
|
In addition to the drive response time and queuing data, gather the drive activity rates, including read I/Os, write I/Os, and total I/Os because they show which drives are active:
a. Gather performance data, as shown in Table 7-6.
Table 7-6 Native tools and key metrics
|
OS
|
Native tool
|
Command/Object
|
Metric/Counter
|
|
AIX
|
iostat, filemon
|
iostat -D, filemon -o /tmp/fmon.log -O all
|
read time(ms)
write time(ms)
reads, writes
queue length
|
|
HP-UX
|
sar
|
sar -d
|
avserv(ms)
avque
blks/s
|
|
Linux
|
iostat
|
iostat -d
|
svctm(ms)
avgqu-sz
tps
|
|
Solaris
|
iostat
|
iostat -xn
|
svc_t(ms)
Avque
blks/s
|
|
Microsoft Windows Server
|
perfmon
|
Physical disk
|
Avg Disk Sec/Read
Avg Disk Sec/Write
Read Disk Queue Length
Write Disk Queue Length
Disk Reads/sec
Disk Writes/sec
|
|
IBM z
|
Resource Measurement Facility (RMF)/System Management Facilities (SMF)
|
N/A
|
|
I/O-intensive disks: The number of total I/Os per second indicates the relative activity of the device. This relative activity provides a metric to prioritize the analysis. Those devices with high response times and high activity are more important to understand than devices with high response time and infrequent access. If analyzing the data in a spreadsheet, consider creating a combined metric of Average I/Os × Average Response Time to provide a method for identifying the most I/O-intensive disks. You can obtain additional detail about OS-specific server analysis in the OS-specific chapters.
|
b. Gather configuration data from the default multipathing software for distributed systems. In addition to the multipathing configuration data, you must collect configuration information for the host and DS8000 HBAs, which includes the bandwidth of each adapter.
|
Multipathing: Ensure that multipathing works as designed. For example, if there are two paths that are zoned per HBA to the DS8000 storage system, there must be four active paths per LUN. The default MPIO should be configured to use an active/active configuration of multipathing, which means that traffic flows across all the traffic fairly evenly. For native DS8000 connections, the absence of activity on one or more paths indicates a problem with the multipathing.
|
c. Format the data and correlate the host LUNs with their associated DS8000 resources. Formatting the data is not required for analysis, but it is easier to analyze formatted data in a spreadsheet.
The following steps represent the logical steps that are required to format the data and do not represent literal steps. You can codify these steps in scripts:
i. Read the configuration file.
ii. Build a hdisk hash with key = hdisk and value = LUN SN.
iii. Read I/O response time data.
iv. Create hashes for each of the following values with hdisk as the key: Date, Start time, Physical Volume, Reads, Avg Read Time, Avg Read Size, Writes, Avg Write Time, and Avg Write Size.
v. Print the data to a file with headers and commas to separate the fields.
vi. Iterate through the hdisk hash and use the common hdisk key to index into the other hashes and print those hashes that have values.
d. Analyze the host performance data:
i. Determine whether I/O bottlenecks exist by summarizing the data and analyzing key performance metrics for values in excess of the thresholds. Identify those vpaths/LUNs with poor response time. Hardware errors and multipathing configuration issues must already be excluded. The hot LUNs must already be identified. Proceed to step 5 on page 173 to determine the root cause of the performance issue.
ii. If no degraded disk response times exist, the issue is likely not internal to the server.
5. If there are drive constraints that are identified, continue the identification of the root cause by collecting and analyzing the DS8000 configuration and performance data:
a. Gather the configuration information. IBM Storage Insights Pro can also be used to gather configuration data through the Properties window, as shown in Figure 7-31 on page 174.

Figure 7-31 DS8000 Properties window in IBM Storage Insights Pro
|
Analyze the DS8000 performance data first: Check for Alerts (2) and errors (3) in the left navigation. Then, look at the performance data of the internal resources (4). Analysis of the SAN fabric and the DS8000 performance data can be completed in either order. However, SAN bottlenecks occur less frequently than drive bottlenecks, so it can be more efficient to analyze the DS8000 performance data first.
|
b. Use IBM Storage Insights Pro to gather the DS8000 performance data for fiber channel ports, pools, arrays, volumes, nodes, and host connections. Compare the key performance indicators from Table 7-5 on page 158 with the performance data. To analyze the performance, complete the following steps:
i. For those server LUNs that show poor response time, analyze the associated volumes during the same period. If the problem is on the DS8000 storage system, a correlation exists between the high response times observed on the host and the volume response times observed on the DS8000 storage system.
|
Compare the same period: Meaningful correlation with the host performance measurement and the previously identified hot LUNs requires analysis of the DS8000 performance data for the same period that the host data was collected. The synchronize time function of IBM Storage Insights Pro can help you with this task (see Figure 7-32 on page 175 (1)). For more information, see IBM Documentation: https://www.ibm.com/docs/en/storage-insights. For more information about time stamps, see 7.3.1, “Time stamps” on page 156.
|
ii. Correlate the hot LUNs with their associated arrays. When using the IBM Storage Insights Pro, the relationships are provided automatically in the drill-down feature, as shown in Figure 7-32 on page 175 (2).

Figure 7-32 Drill-down function of IBM Storage Insights Pro
If you use export reports, shown in Figure 7-32 on page 175 (3), and want to correlate the volume data to the rank data, you can correlate the volume data to the rank data manually or by using the script. If multiple ranks per extent pool and storage pool striping, or Easy Tier managed pools are used, one volume can exist on multiple ranks. Easy Tier can help alleviate any hot spots with automatic rebalancing.
Analyze storage subsystem ports for the ports associated with the server in question.
6. Continue the identification of the root cause by collecting and analyzing SAN fabric configuration and performance data:
a. Gather the connectivity information and establish a visual diagram of the environment.
|
Visualize the environment: Sophisticated tools are not necessary for creating this type of view; however, the configuration, zoning, and connectivity information must be available to create a logical visual representation of the environment.
|
b. Gather the SAN performance data. Each vendor provides SAN management applications that provide the alerting capability and some level of performance management. Often, the performance management software is limited to real-time monitoring, and historical data collection features require additional licenses. In addition to the vendor-provided solutions, IBM Storage Insights Pro can collect further metrics, which are shown in Table 7-5 on page 158.
c. Consider graphing the Overall Port Response Time, Port Bandwidth Percentage, and Total Port Data Rate metrics to determine whether any of the ports along the I/O path are saturated during the time when the response time is degraded. If the Total Port Data Rate is close to the maximum expected throughput for the link or the bandwidth percentages that exceed their thresholds, this situation is likely a contention point. You can add additional bandwidth to mitigate this type of issue either by adding additional links or by adding faster links. Adding links might require upgrades of the server HBAs and the DS8000 HAs to take advantage of the additional switch link capacity.
d. Create a Ticket (Case) and automatically upload logs directly in IBM Storage Insights Pro. Click Dashboards > Operations then select the storage system you want to create a case for and click Get Support as shown in Figure 7-33 on page 176. You can view updates and add logs to a ticket: Click the Tickets tab, select the ticket, then click Add Log Package to Ticket.

Figure 7-33 Get Support in IBM Storage Insights Pro
|
Note: If you are eligible for Premium Support, it's recommended that you call IBM Support or open a support case at https://www.ibm.com/mysupport/ to access that service for your issue. Ensure that you have your Direct Access Code (DAC) number ready so IBM can best assist you.
|
7.9 Performance analysis examples
This section provides sample performance data, analysis, and recommendations for the following performance scenarios by using the process that is described in 7.8, “End-to-end analysis of I/O performance problems” on page 167. The examples highlight the key performance data that is appropriate for each problem type. It provides the host configuration or errors only in the cases where that information is critical to determine the outcome.
7.9.1 Example 1: Array bottleneck
The most common type of performance problem is an array bottleneck. Similar to other types of I/O performance problems, an array bottleneck usually manifests itself in high response time on the host. In many cases, the write response times are excellent because of cache hits, but reads often require immediate disk access.
Defining the problem
The application owner complains of poor response time for transactions during certain times of the day.
Classifying the problem
There are no hardware errors, configuration issues, or host performance constraints.
Identifying the root cause
Figure 7-34 shows the average read response time for a Windows Server that performs a random workload in which the response time increases steadily over time.
Figure 7-34 Windows Server perfmon - Average Physical Disk Read Response Time
At approximately 18:39 hours, the average read response time jumps from approximately 15 ms to 25 ms. Further investigation of the host reveals that the increase in response time correlates with an increase in load, as shown in Figure 7-35 on page 178.

Figure 7-35 Windows Server perfmon - Average Disk Reads/sec
As described in 7.8, “End-to-end analysis of I/O performance problems” on page 167, there are several possibilities for high average disk read response time:
•DS8000 array contention
•DS8000 port contention
•SAN fabric contention
•Host HBA saturation
Because the most probable reason for the elevated response times is the drive utilization on the array, gather and analyze this metric first. Figure 7-36 on page 178 shows the drive utilization on the DS8000 storage system.

Figure 7-36 IBM Storage Insights Pro array drive utilization
Implementing changes to resolve the problem
Add volumes on additional drives. For environments where host striping is configured, you might need to re-create or migrate the host volumes to spread the I/O from an existing workload across the new volumes.
Validating the problem resolution
Gather performance data to determine whether the issue is resolved.
7.9.2 Example 2: Hardware connectivity part 1
Infrequent connectivity issues occur as a result of broken or damaged components in the I/O path. The following example illustrates the required steps to identify and resolve these types of issues.
Problem definition
The online transactions for a Windows Server SQL server appear to take longer than normal and time out in certain cases.
Problem classification
After reviewing the hardware configuration and the error reports for all hardware components, we determined that there are errors on the paths associated with one of the host HBAs, as shown in Figure 7-37 on page 179. This output shows the errors on path 0 and path 1, which are both on the same HBA (SCSI port 1). For a Windows Server that runs MPIO, additional information about the HAs is available. The command that you use to identify errors depends on the multipathing software installation.
Figure 7-37 Example of information available
Identifying the root cause
A further review of the switch software revealed significant errors on the switch port associated with the paths in question. A visual inspection of the environment revealed a kink in the cable from the host to the switch.
Implementing changes to resolve the problem
Replace the cable.
Validating the problem resolution
After you implement the change, the error counts do not increase and the nightly backups complete within the backup window.
7.9.3 Example 3: Hardware connectivity part 2
Infrequent connectivity issues occur as a result of broken or damaged components in the I/O path. The following example illustrates the required steps to identify and resolve these types of issues.
Defining the problem
Users report that the data warehouse application on an AIX server does not complete jobs in a reasonable amount of time. Online transactions also time out.
Classifying the problem
A review of the host error log shows a significant number of hardware errors. An example of the errors is shown in Figure 7-38 on page 180. 
Figure 7-38 AIX error log
Identifying the root cause
The IBM Service Support Representative (SSR) ran IBM diagnostic tests on the host HBA, and the card did not pass the diagnostic tests.
|
Disabling a path: In cases where there is a path with significant errors, you can disable the path with the multipathing software, which allows the non-working paths to be disabled without causing performance degradation to the working paths.
|
Implementing changes to resolve the problem
Replace the card.
Validating the problem resolution
The errors did not persist after the card is replaced and the paths are brought online.
7.9.4 Example 4: Port bottleneck
DS8000 port bottlenecks do not occur often, but they are a component that is typically oversubscribed.
Defining the problem
The production server batch runs exceed their batch window.
Classifying the problem
There are no hardware errors, configuration issues, or host performance constraints.
Identifying the root cause
The production server throughput diminishes at approximately 18:30 hours daily. Concurrently, development workloads that run on the same DS8000 ports increase. Figure 7-39 on page 181 and Figure 7-40 on page 182 demonstrate the overall workload from both the production server and the development server.

Figure 7-39 Production throughput compared to development throughput
The DS8000 port data reveals a peak throughput of around 300 MBps per 4-Gbps port.
|
Note: The HA ports speed might differ from DS8000 models, so it is a value that depends on the hardware configuration of the system and the SAN environment.
|

Figure 7-40 Total port data rate << image reference missing in text >>
Implementing changes to resolve the problem
Rezone ports for production servers and development servers so that they do not use the same DS8000 ports. Add additional ports so that each server HBA is zoned to two DS8000 ports.
Validating the problem resolution
After implementing the new zoning that separates the production server and the development server, the storage ports are no longer the bottleneck.
7.10 IBM Storage Insights Pro in mixed environments
A benefit of IBM Storage Insights Pro is its capability to analyze both distributed fixed block (FB) and mainframe Count Key Data (CKD) workloads. When the DS8000 storage system is attached to multiple hosts that run on different platforms, distributed hosts might affect your mainframe workload, and the mainframe workload might affect the distributed workloads. If you use a mixed environment, looking at the RMF reports is insufficient. You also need the information about the Open Systems hosts. IBM Storage Insights Pro informs you about the cache and I/O activity.
Before beginning the diagnostic process, you must understand your workload and your physical configuration. You must know how your system resources are allocated, and understand your path and channel configuration for all attached servers.
Assume that you have an environment with a DS8000 storage system attached to a z/OS host, an AIX on IBM Power Systems host, and several Windows Server hosts. You noticed that your z/OS online users experience a performance degradation 07:30 - 08:00 hours each morning.
You might notice that there are 3390 volumes that indicate high disconnect times, or high device busy delay time for several volumes in the RMF device activity reports. Unlike UNIX or Windows Server, you might notice the response time and its breakdown to connect, disconnect, pending, and IOS queuing.
Disconnect time is an indication of cache-miss activity or destage wait (because of persistent memory high utilization) for logical drives behind the DS8000 storage systems.
Device busy delay is an indication that another system locks up a volume, and an extent conflict occurs among z/OS hosts or applications in the same host when using Parallel Access Volumes (PAVs). The DS8000 multiple allegiance or PAVs capability allows it to process multiple I/Os against the same volume at the same time. However, if a read or write request against an extent is pending while another I/O is writing to the extent, or if a write request against an extent is pending while another I/O is reading or writing data from the extent, the DS8000 storage system delays the I/O by queuing. This condition is referred as extent conflict. Queuing time because of extent conflict is accumulated to device busy (DB) delay time. An extent is a sphere of access; the unit of increment is a track. Usually, I/O drivers or system routines decide and declare the sphere.
To determine the possible cause of high disconnect times, check the read cache hit ratios, read-to-write ratios, and bypass I/Os for those volumes. If you see that the cache hit ratio is lower than usual and you did not add other workloads to your IBM z environment, I/Os against FB volumes might be the cause of the problem. It is possible that FB volumes which are defined on the same server have a cache-unfriendly workload, thus affecting your IBM z volumes hit ratio.
To get more information about cache usage, you can check the cache statistics of the FB volumes that belong to the same server. You might be able to identify the FB volumes that have a low read hit ratio and short cache holding time. Moving the workload of the FB logical disks, or the CKD volumes, that you are concerned about to the other side of the cluster improves the situation by concentrating cache-friendly I/O workload across both clusters. If you cannot or if the condition does not improve after this move, consider balancing the I/O distribution on more ranks. Balancing the I/O distribution on more ranks optimizes the staging and destaging operation.
The scenarios that use IBM Storage Insights Pro as described in this chapter might not cover all the possible situations that can be encountered. You might need to include more information, such as application and host operating system-based performance statistics or other data collections to analyze and solve a specific performance problem.
..................Content has been hidden....................
You can't read the all page of ebook, please click here login for view all page.