


IBM Netcool Operations Insight overview
In this chapter, we describe at a high level the features of the IBM Netcool Operations Insight (Netcool Operations Insight) solution.
This chapter includes the following topics:
1.1 Netcool Operations Insight at-a-glance
IBM Netcool Operations Insight uses real-time alarm and alert analytics, which are combined with broader historic data analytics. Netcool Operations Insight is powered by the fault management capabilities of IBM Tivoli Netcool/OMNIbus and IBM’s leading big data technologies within IBM Operations Analytics - Log Analysis, which provides powerful event search and historical analysis in a single solution.
Netcool Operations Insight consists of a base solution for managing and analyzing application monitoring environments and an optional extension that is called Networks for Operations Insight, which widens the scope to include network discovery, visualization, event correlation, topology-based root-cause analysis, and configuration and compliance management. The Networks for Operations Insight capability is provided through the Network Manager and Netcool Configuration Manager products.
In addition, you can set up IBM Network Performance Insight as part of your Netcool Operations Insight solution to monitor network traffic performance. You also can integrate with other solutions, such as IBM Alert Notification and IBM Runbook Automation.
Netcool Operations Insight integrates infrastructure and operations management into a single coherent structure across business applications, virtualized servers, network devices and protocols, internet protocols, and security and storage devices.
Netcool Operations Insight includes the following capabilities:
•Event search
Event search applies the search and analysis capabilities of Operations Analytics - Log Analysis to events that are monitored, recorded, and managed by Tivoli Netcool/OMNIbus. Events are transferred from the ObjectServer through the Gateway for Message Bus to Operations Analytics - Log Analysis, where they are brought into a data source and indexed for searching. After the events are indexed, you can search every occurrence of real-time and historical events.
The Tivoli Netcool/OMNIbus Insight Pack is installed into Operations Analytics - Log Analysis and provides custom applications that search the events based on various criteria. The custom applications can generate dashboards that present event information to show how your monitoring environment is performing over time. Keyword searches and dynamic drill-down functions allow you to go deeper into the event data for detailed analysis. The applications can be run from the Operations Analytics - Log Analysis.
Tooling can be installed into the web GUI that starts the applications from the right-click menus of the Event Viewer and the Active Event List. An “event reduction wizard” is also supplied that includes information and applications that can help you analyze and reduce volumes of events and minimize the “noise” in your monitored environment.
•Event analytics
Event Analytics performs statistical analysis of Tivoli Netcool/OMNIbus historical event data. It can identify seasonal patterns, such as when and how frequently events occur. Seasonality analyses detects seasonal pattern in your events and shows them in reports and graphs. For example, an event that periodically occurs at an unscheduled specific time is highlighted. You can use the information from the seasonality reports to create suppression rules for network equipment or devices to reduce the number of events.
It can determine which events have a statistical tendency to occur together and output the results on a scheduled basis as event groups. You can deploy valid event groups as Netcool/Impact correlation rules. The rules act on the event data and show a single parent event from the event group, with all other events in the group as children. This ability reduces the number of events that are presented to operators.
Event Analytics is installed as two separate packages. One is installed into Netcool/Impact and the other is installed into the Netcool/OMNIbus web GUI. Both are required for Event Analytics to work.
•Networks for Operations Insight
Networks for Operations Insight is an optional feature that can be added to a deployment of the base Netcool Operations Insight solution to provide service assurance in dynamic network infrastructures. The capabilities of Networks for Operations Insight include network discovery, visualization, event correlation, root-cause analysis, and configuration and compliance management. It contributes to overall operational insight into application and network performance management. The Networks for Operations Insight capability is provided through the Network Manager and Netcool Configuration Manager products.
•Topology search
The topology search capability is an extension of the Networks for Operations Insight feature. It applies the search and analysis capabilities of Operations Analytics - Log Analysis to give insight into network performance. Events that were enriched with network data are analyzed by the Network Manager Insight Pack and are used to calculate the lowest-cost routes between two endpoints on the network topology over time. The events that occurred along the routes over the specified period are identified and shown by severity. The topology search requires the Networks for Operations Insight feature to be installed and configured.
•IBM Connections integration
Netcool/Impact enables social collaboration through IBM Connections by automatically providing updates to key stake holders. It provides integration to IBM Connections by using a Netcool/Impact IBM Connections action function. The IBM Connections action function allows users to query forums and topics lists, create a forum or topic, and update topics.
IBM Connections is a leading social software platform that can help your organization to engage the right people, accelerate innovation, and deliver results. This integrated, security-rich platform helps people engage with networks of experts in the context of critical business processes. Now, everyone can act with confidence and anticipate and respond to emerging opportunities.
•Network performance monitoring
Network Performance Insight is a flow-based network traffic performance monitoring system. It provides comprehensive and scalable visibility on network traffic with visualization and reporting of network performance data for complex, multivendor, multi-technology networks.
•IBM Alert Notification
IBM Alert Notification provides instant notification of alerts for any critical IT issues across multiple monitoring tools. It gives IT staff instant notification of alerts for any issues in your IT operations environment.
•IBM Runbook Automation
IBM Runbook Automation empowers IT operations teams to resolve detected problems in a more efficient and effective way. Operators can focus their attention where it is needed and receive guidance about the best resolution with recommended actions and pre-filled context. With Runbook Automation, you can perform the following tasks:
– Investigate and delegate problems faster and more efficiently.
– Diagnose and fix problems faster and build operational knowledge.
– Easily create, publish, and manage runbooks and automations.
– Keep score to track achievements and find opportunities for improvement.
|
Note: For more information about IBM Alert Notification and IBM Runbook Automation, see Delivering Consistency and Automation with Operational Runbooks, REDP-5347.
|
1.2 Netcool Operations Insight in IT Service Management context
Netcool Operations Insight provides end-to-end insight for smarter business decision and simplifies operations and reduces cost of operations. Netcool Operations Insight also provides services management personnel with improved visibility by introducing Network Health Dashboard, Network discovery, visualization, monitoring, and event correlation and root-cause analysis, which reduces mean-time to repair.
Netcool Operations Insight give IT Service Management personnel agile operations by providing the following features (see Figure 1-1 on page 7):
•Consolidated management:
– Provide off-the-shelf integrations for rapid deployment
– Correlate, enrich, and consolidate events into a single view
– Scale from the smallest to largest environments
•Analytics:
– Provide data-driven actionable insight from high-volume operations data
– Identify frequent events
– Recognize patterns
– Recommend grouping and suppression
•Automation:
– Streamline operations
– Eliminate manual steps by automating actions
– Automate routine processes
– Take immediate action
•Built-in expertise:
– Decades of IBM experience across thousands of customers
– Reduction in actionable events ready for use

Figure 1-1 Netcool Operations Insight in IT Service Management context
1.3 Netcool Operations Insight Dashboards Services Hub
Netcool Operations Insight combines Netcool OMNIbus and Netcool Impact With the power of analytics and modern mobile dashboards to increase the effectiveness, efficiency, and reliability of Operations Management. It also simplifies or removes administrative tasks, which improves time to value and total cost of ownership.
IBM Dashboard Application Services Hub (DASH) service is a common web portal for IBM Netcool suite. When you log in to the DASH, you can access the Content Page, OMNIBus, Web GUI, Network Manager topology views, discovery configuration, and other integrations.
1.3.1 Navigation bar
By using the navigation bar, you can access the Search, Favorites, and Product pages navigation tools (see Figure 1-2 on page 8). Product pages provide access to DASH pages for each integrated product.
Figure 1-2 DASH Navigation bar
Click any folder’s icon (a folder is a logical grouping for related pages and you can assign any icon to it) to browse to its content pages. We start by clicking the Default folder icon to see its contents. The folder comes empty, but as shown in Figure 1-3, it shows our custom sample page that named “austin map” under it.

Figure 1-3 Austin map
As shown in Figure 1-4, opening the Austin map page shows you a map for Austin that uses the Map Widget that is configured to use OpenStreetMap (OSM) service that is provided by a free tile server. (This feature requires internet connectivity if you do not have a replica for the server on-premises).

Figure 1-4 Map widget
This feature is helpful in visualizing topology over maps. Figure 1-5 shows devices that are laid over Google maps. For more information, see Chapter 3, “Geographic Discovery and Mapping” on page 67.

Figure 1-5 Topology visualization over map
1.3.2 Administration folder
The Administration folder contains the Netcool OMNIBus WebGUI and Network Manager administration GUI. Use the GUI in this folder to create OMNIBus filters, views, tool, menus, and Network Manager polling policies, as shown in Figure 1-6.

Figure 1-6 Administration folder.
1.3.3 Discovery folder
The Discovery folder opens links to the Network Discovery Status and Network Discovery Configuration pages, as shown in Figure 1-7.

Figure 1-7 Network Discovery status and configuration pages
Starting in version V1.4, some enhancements were added, such as the discovery of Cisco WiFi Access Point, which performs modeling for layer 2/3, SSID, 802.11 spec, channels, dependencies on DHCP. See Figure 1-8.

Figure 1-8 Cisco WiFi discovery
1.3.4 Incident folder
Clicking the Incident folder opens OMNIbus WebGUI-related views and Network views. You can browse the Event Dashboard, Event List, AEL, and work with OMNIBus events. You also can browse the Network views, Hop view, Health view, Fault-Finding view, SNMP MIB Browser, and real-time graphing, as shown in Figure 1-9 on page 13.

Figure 1-9 Events and Network Availability views
1.3.5 Network Health Dashboard
The Network Health Dashboard is a new feature in this release. As shown in Figure 1-10 on page 14, this feature answers the following questions at a glance:
•What devices or interfaces have been down longer than 1 hour, 24 hours?
•How is the availability level trending over the last 24 hours?
•What are the worst performers?
•Did any configuration changes coincide with this incident?
•What events are active?

Figure 1-10 Network Health Dashboard
Unavailable Resources and Percentage Availability widgets
The Unavailable Resources and Percentage Availability widgets give more information about your network availability status in real time. They also gives you information about device pingability and SNMP polling failures, interface link state, and pingability.
You use the Network View bookmark to segment your network; for example, if you want to see router availability only, click the All Routers bookmark, as shown in Figure 1-11 on page 15.

Figure 1-11 Selecting All Routers bookmark
1.3.6 Insights folder
Click the Insights folder to open the following analytics-related pages:
•Seasonal Events
•Related Events
Both pages are empty after installation and must be configured. It is in this folder where statistical analysis of Tivoli Netcool/OMNIbus historical events data is done. It can identify seasonal patterns, such as when and how frequently events occur, as shown in Figure 1-12.

Figure 1-12 Netcool Operations Insight Analytics
Seasonality analyses are output in reports and graphs so that you can find reoccurring event patterns, as shown in Figure 1-13.

Figure 1-13 Seasonality analysis in Netcool Operations Insight
1.3.7 Reporting folder
Click the Reporting folder to start browsing through the out-of-box reports that are installed and included with Netcool Operations Insight components. Reports are built on top of IBM Tivoli Common Reporting engine (see Figure 1-14).

Figure 1-14 Reporting link
You get OMNIBus historical reports as part of OMNIBus installation, which is used by the analytics engine. You get approximately 55 reports for Tivoli Network Manager if you install the product. For Tivoli Netcool Configuration Manager, you get 15 different reports about compliance and security. Moreover, a customized report is also possible by using the Report Studio tool.
The installed package reports are shown in Figure 1-15.

Figure 1-15 Out-of-box reporting
1.3.8 Configurations folder
Click the Configurations folder icon to open Netcool Configuration Manager ITNCM base and compliance GUI, as shown in Figure 1-16. The JNLP application is started when you click any one of those applications.

Figure 1-16 Netcool Configuration Manager client launch
Click the Console Integrations icon to open any integrated product. Based on your installation, you might have Netcool Impact only, or have Netcool Impact and NPI (see Figure 1-17).

Figure 1-17 Console Integrations
Click Impact to open the Netcool Impact GUI, as shown in Figure 1-18. Impact is a core component for Netcool Operations Insight and all enrichments and event analytics depends on it.

Figure 1-18 Impact GUI
1.4 Our environment for the scenarios
Most of the scenarios that are described in this publication were implemented by using the environment that is described in this section. This environment is the same environment that we created for IBM Netcool Operations Insight Version 1.4 Deployment Guide, SG24-8365. This environment is a typical Netcool Operations Insight environment that is configured for high availability (HA).
We used a separate environment for some of the scenarios. Those environments were similar to the one that is used here, but with different host names. For more information, see “Scenario Topology” section of each scenario.
1.4.1 High-level architecture
Figure 1-19 shows the high-level architecture that was used to deploy a multi-tiered Netcool Operations Insight environment with HA. The following Netcool Operations Insight components are shown in Figure 1-19:
•IBM Tivoli Netcool/OMNIbus (OMNI)
•IBM Jazz™ for Service Management (JazzSM)
•IBM DB2®
•IBM Tivoli Netcool Impact (NCI)
•IBM Tivoli Network Manager (NM)
•IBM Tivoli Netcool Configuration Manager (NCM)
•IBM Operations Analytics Log Analysis (IOALA)
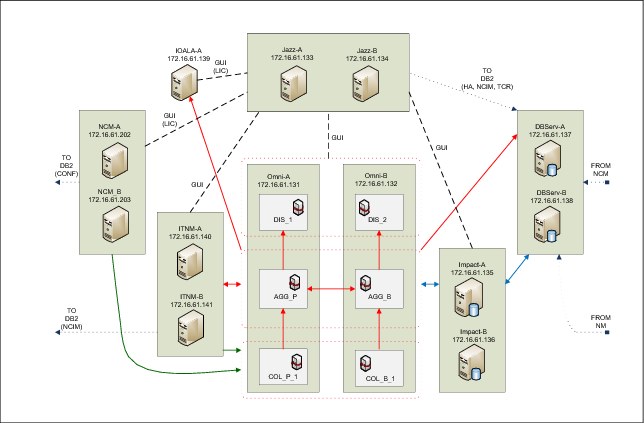
Figure 1-19 High-level architecture
As shown in Figure 1-19, JazzSM is deployed with HA and it is collecting data from Network Manager servers, Netcool Configuration Manager, Netcool Impact, DB2, IBM Operations Analytics - Log Analysis, and Netcool/OMNIbus.
|
Note: For more information about installing Netcool Operations Insight, see IBM Netcool Operations Insight Version 1.4 Deployment Guide, SG24-8365.
|
1.4.2 Environment database and connections
Figure 1-20 shows the Netcool Operations Insight environment from a database perspective. More specifically, it shows the relationships of each Netcool Operations Insight component and the DB2 instance to which they are connected.

Figure 1-20 Database connection in Netcool Operations Insight
1.4.3 Ports used
The main ports that are needed during the Netcool Operations Insight deployment are listed in Table 1-1.
Table 1-1 Main ports that are used for Netcool Operations Insight
|
Netcool Operations Insight component
|
Port used
|
|
Omnibus - Aggregation Layer
|
4100
|
|
Omnibus - Collection Layer
|
4101
|
|
Omnibus - Display Layer
|
4102
|
|
JazzSM
|
16310 - 16316
|
|
Impact
|
16311
|
|
Log Analysis
|
9987
|
|
Network Manager
|
7968
|
The ports that are used in our environment for the connections between all the Netcool Operations Insight components are shown in Figure 1-21.

Figure 1-21 Ports that are used to connect the Netcool Operations Insight components
1.5 Summary
Netcool Operations Insight integrates across all IBM and non-IBM Management Solutions for a total IT solution serves enterprises demand. It combines all data by using web dashboards, mobile dashboards, and simple data integration solutions to extend Operations Analytics for prediction and search.
..................Content has been hidden....................
You can't read the all page of ebook, please click here login for view all page.