
CHAPTER 9
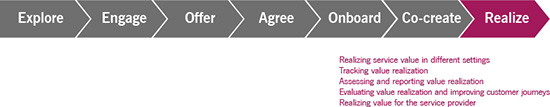
STEP 7: REALIZE
9 Step 7: Realize
Stakeholder value must be driven and tracked based on the planning of co-creating value, and improvements must be applied to continuously maintain and optimize the service value.

Key message
Value is the perceived benefits, usefulness, and importance of something.
Valuable services enable the optimal balance between supported outcomes, positive experiences, costs removed, risks removed and affected outcomes, negative experiences, costs introduced, and risks introduced.
The purpose of this step is to track, assess, and evaluate whether the value that the stakeholders expected and planned for is realized throughout all steps of the journey and to continually identify improvements to the journey and the services.
Tracking and realizing value ensures that services contribute to the desired outcomes for all stakeholders and that related costs and risks are managed effectively. This is shown in Table 9.1.
Table 9.1 The purpose of value capturing and customer journey improvement
Realize |
For the service consumer |
For the service provider |
Facilitate outcome and experience |
To realize the planned value To enable confirmation of value realization To establish effective communication with the service provider for providing feedback on service quality |
To realize value for the service provider (e.g. earn money, capability elevation, etc.) To enhance feedback from the customer To increase customer’s involvement in service operations and improvement |
Optimize risk and compliance |
To detect deviations from the desired state in order to reallocate resources if needed |
To detect deviations from the desired state before the customer satisfaction decreases To demonstrate realized value, such as reduced risk of customer dissatisfaction |
Optimize resources and minimize cost |
To avoid inefficient allocation of resources To increase awareness of how value is created and what the alternatives are |
To avoid inefficient allocation of resources To ensure cost covering |
To track, assess, and evaluate service value realization, it is important to know the baseline and the target in the form of a value proposition, acceptance criteria, benefit realization plan, etc. The baseline and the target should be agreed at the agree step.
Tracking, assessing, and evaluating value co-creation immediately after goods are transferred, after access to a resource has been provided, or after service actions have taken place is rare. Usually, there is a time delay after service delivery and before value is created and perceived. Tracked outcomes may also decrease for a period before they reach the desired level. Therefore, it is important that the parties involved in value co-creation planning agree on when value realization will be assessed and evaluated.
Another decision point is where to track value realization. To do this, the main beneficiary of the service must be identified. Traditionally, IT services have mostly supported and enabled internal business processes. For this type of service, outcome and experience should be tracked at the point where the user benefits from the service in the business process. Gradually, IT services are transforming into external consumer services, usually called digital services.
Key message
It is important to remember that service value can never be thoroughly defined by a sophisticated set of metrics. Service value is always perceived value, which makes it difficult to track and evaluate as it is based on individual expectations and preferences. This is why tracking customer experience and satisfaction is just as important as tracking outputs and outcomes.
Tracking, assessing, and evaluating value realization can be costly and the effort and cost should be balanced with possible benefits. In contrast, tracking value, like any other service management activity, is subject to continual, iterative improvement. By incrementally improving value realization tracking, and reporting the results, value can be significantly increased, which improves the capacity to improve the tracking.
9.1 Realizing service value in different settings
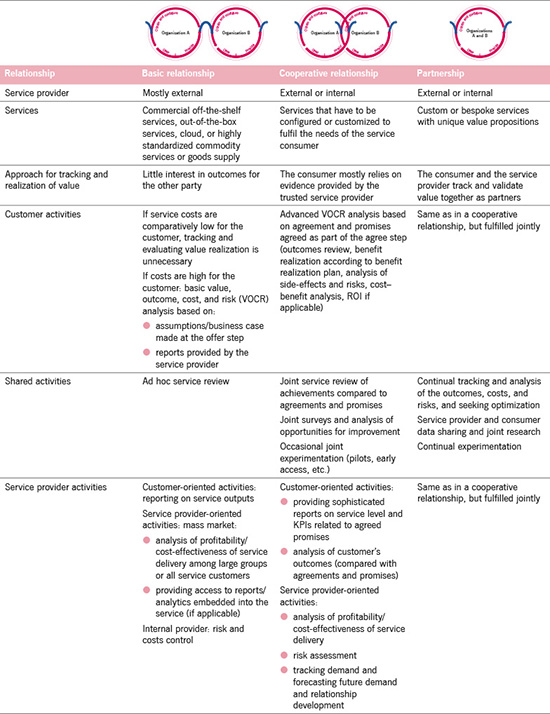
The nature of the service relationship influences how value is tracked, assessed, and evaluated. This is shown in Table 9.2.
In a close service relationship, such as a partnership, tracking, assessing, and evaluating service value may partly become a joint activity. In a more distant relationship, such as one with an out-of-the-box service, the service provider typically provides access to standard reports as part of the service and there is no further communication between the service provider and the customer regarding value realization. However, if costs, risks, or impacts are significant enough, the customer may still choose to apply extensive and sophisticated value realization tracking and assessing mechanisms to control value realization.
Table 9.2 Tracking, assessing, and evaluating value realization in different types of service relationships
9.2 Tracking value realization
A requirement for assessing and evaluating value realization is tracking and measuring service value indicators.
A service value indicator is a measure that either directly or indirectly indicates the situation or level of a specific aspect of service value. Indicators reflect the achievement of an objective. In this case, the objective is the desired or agreed service value.
Indicators are reinforced by one or more metrics. A metric is an important characteristic of value that can be expressed in quantifiable units based on data collected by a procedure or technical means. Metrics can be defined for customer journeys, services, products, practices, and resources of all four dimensions of service management. The hierarchy from purpose to metrics is described in the ITIL planning and evaluation model, which is shown in Figure 9.1. More details about the ITIL planning and evaluation model can be found in ITIL ® 4: Direct, Plan and Improve and the measurement and reporting practice guide.
Tracking value realization includes the following activities:
• identifying the direct and indirect indicators of service value and the links between them
• defining and measuring the underpinning metrics
• capturing measurement data.
The following examples give a general idea of a range of practical approaches to track value realization:
• In simple standardized environments, it may be sufficient to track value realization using standard out-of-thebox monitoring tools and pre-defined templates for reporting.
• In more complicated environments, monitoring and reporting tools with semi-standardized configurations are usually not enough. Also, there is a need to obtain service data from various sources, such as financial data, marketing data, and business goals and to use sophisticated mapping and correlation tools in order to track service value realization. There is also a need for frequent service reviews.
• In complex and unpredictable environments, the best approach for tracking value is intensive communication between the customer and the service provider (if there are service relations), collaborating and promoting visibility, and gathering fast feedback. (The ITIL guiding principles of collaborate and promote visibility and progress iteratively with feedback address this issue.) Monitoring data from any other source can also be used as input. Key stakeholders’ participation is crucial because only they can provide dynamic information for tracking value realization.
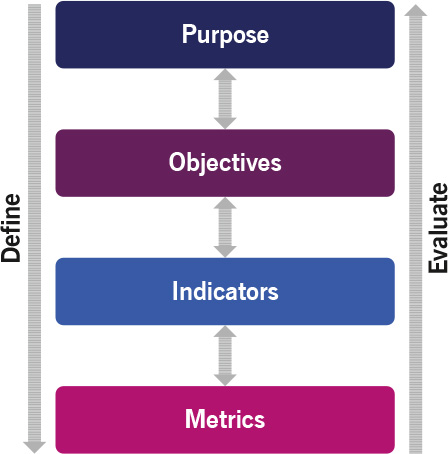
Figure 9.1 ITIL planning and evaluation model
9.2.1 Tracking performance, output, and outcome
It is often harder to identify direct outcome indicators than indirect outcome indicators, such as output and performance indicators. If clear links can be established between outcome indicators and output and performance indicators, the latter can be used to indirectly track service outcome.
One way of linking performance and output indicators to outcomes is to use the value driver framework model as a basis, considering the lower layers as value drivers for the higher layers (see Figure 1.11 for an example).
The performance of the combined and individual resources, practices, and products drives service performance, service consumer performance, and eventually achievement of the service consumer’s objectives and purposes. Table 9.3 provides examples of how the model may be applied.
Another useful model for linking performance and output indicators to service outcome is the service profit chain proposed by Heskett (Heskett et al., 1994). According to the service profit chain model, profit and growth are stimulated primarily by customer loyalty. Loyalty is a direct result of customer satisfaction, which is largely influenced by the value of services provided to customers. Value is created by satisfied, loyal, and productive employees. Employee satisfaction results from high-quality support services and policies that enable employees to deliver a good service. This is shown in Figure 9.2.

Figure 9.2 The service profit chain
Table 9.3 Levels of value realization tracking
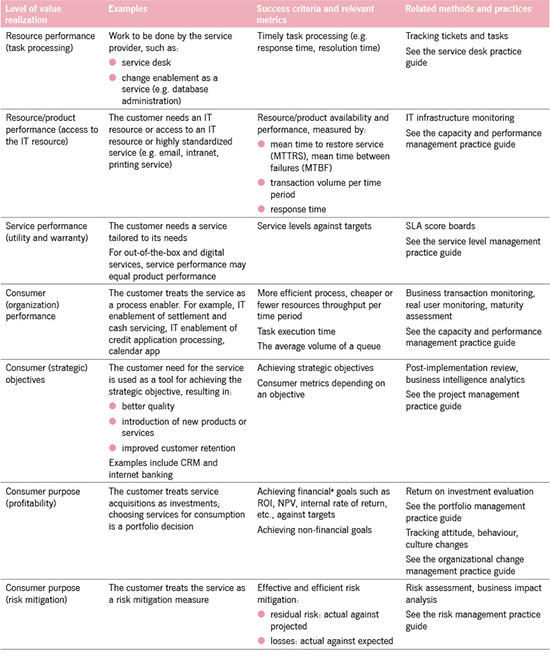
a All relevant data (staff reductions or efficiency improvements, improvements in business performance, quality measurements, etc.) should be converted to monetary values and then compared to service costs.
Inspiration may also be found in the various models for linking output and outcomes to business objectives used in programme and project management, such as a benefits dependency network, benefits dependency map, results chain, and success map. However, they primarily focus on business change, not ongoing services, and should therefore be used with that reservation in mind.
In many cases, a service or product has unexpected and unplanned side-effects. These side-effects should be identified, tracked, assessed, and incorporated into the development of the service. They represent some value that should be noted.
There are many outcomes that cannot be measured quantitatively, but which still impact the overall value realization significantly. For example, outcomes are required to meet specific customer preferences, achieve a certain level of capability, etc. Essentially, measurement reduces uncertainty; and qualitative measurement methods may be just as useful for reducing uncertainty as quantitative measurement techniques. Some examples are:
• Knowledge and capability Accumulated knowledge may lead to improved capabilities and improved capabilities may lead to faster, better, and cheaper task completion. A qualitative method, such as value stream mapping, is a good way to complete this.
• Attitude, behaviour, and culture Assessment of an organization’s culture and behavioural patterns can be made using narrative-based techniques that combine qualitative and quantitative methods.
More details about methods of quantitative and qualitative measurements can be found in the measurement and reporting practice guide.
9.2.2 Tracking experience and satisfaction
In order to ensure that the customer and users are satisfied with the service, and the whole customer journey, the service provider should measure and track customer experience, perform customer satisfaction surveys, and request and process feedback from service consumers. Table 9.4 outlines these recommendations further.
Table 9.4 Tracking service experience and satisfaction
Experience criteria |
Experience characteristic |
Metrics |
Functional experience How does the service work? |
Uninterrupted completion of user actions |
Number and frequency of user errors Frequency of returns to the previous stage (‘back-button usage’) Number and frequency of dropped (unfinished) service actions |
Emotional experience How does the service feel? |
Clear and convenient interface Effortlessness and speed of service actions completion |
Number and percentage of transactions where users used the interface help Average handling time (the average duration of one transaction from the customer’s call to ticket resolution) Customer effort score measures customer satisfaction (how much effort customers have to put into getting their issues solved using the service) First response rate (the average time it takes for a support agent to respond to a customer) Average and minimum rating given by users about service interface |
Satisfaction To what degree does the service fulfil needs? |
The reflection of functional and emotional experiences that indicates the level of satisfaction while using the service and loyalty to the service provider |
Average and minimum rating given by users to the service Number and percentage of users who cancel subscription after a trial period Customer churn rate (percentage of customers that stopped using the service during a timeframe) Net promoter score measures customer loyalty (percentage of customers who are promoters of an organization or service) |
Customer experience and user experience are the sums of functional and emotional interactions with a service and service provider as perceived by a customer or user. In order to completely understand customer experience and user experience, there are three questions to consider from the customer perspective:
• How does the service work? (Functional experience)
• How does the service feel? (Emotional experience)
• To what degree does the service fulfil my needs? (Satisfaction)
The service provider should consider using the following methods to monitor customer experience:
• gathering instant feedback after service interactions
• monitoring social media
• creating periodic questionnaires and customer surveys
• gathering customer feedback from service review meetings
• feedback from post-implementation reviews conducted as part of a change enablement process on major changes, releases, and new or changed services
• conducting telephone perception surveys
• handing out satisfaction surveys
• analysing complaints and compliments
• A/B testing using focus groups.
Service providers should correlate experience data with the measurable technical characteristics of the service. The customer satisfaction index is a good place to track and assess customer experience. However, without supporting metrics, it may be hard to perform further analyses of root causes: for example, in the case of a declining customer satisfaction level.
Service level metrics can be a great help for this analysis. The combined set of experience and satisfaction metrics and service level and resource performance metrics gives an opportunity for service providers to investigate deviations and enable continual improvement.
In some cases, these metrics can be part of service level or experience-based agreements and included in SLA scorecard and service reporting. In other cases, the service provider does not disclose this information and uses it for service marketing.
A very effective alternative to measuring service experience directly is through user panels that are used to gather feedback where the service provider is allowed only to observe. Users provide free-form comments and share their thoughts on service experience and ideas on how the service may be improved (Gianotten, 2017).
Service metering and service usage analytics are a way to track, map, and understand customer and user behaviour. This contributes to the understanding of how and when value is realized.
Services are designed to enable customer activities, which in turn enable the achievement of customer outcomes. Every time a customer activity is performed, it generates demand for services. Customer assets such as people, processes, and applications all perform activities. Because of the way these assets are organized or the tasks they are completing, this activity will tend to be performed in patterns. These patterns of business activity (PBA) represent the dynamics of the business and include service interactions with customers, suppliers, partners, and other stakeholders.
Different levels of service usage demand different levels of IT resource utilization. The service provider must be able to anticipate the business activity and ensure enough service capacity to cope with changing demand. These activities are the part of the capacity and performance management ITIL practice.
Patterns of business activity also facilitate an understanding of the differences in service usage by different user groups and can be used to identify user profiles or personas. User profiles communicate information on the roles, responsibilities, interactions, schedules, work environments, and social contexts of related users that can be used to tailor and improve the service and customer journey.
9.3 Assessing and reporting value realization
Assessing and reporting value realization is about consolidating data from various data sources, correlating the consolidated data, interpreting and assessing the information, and presenting it in a form that is appropriate for making decisions. It may include formal service reviews or informal meetings between the service provider and the customer.
Key message
The customer may seek evidence on service outcomes achievement from the service provider at different levels, such as ROI, achieving strategic objectives, process performance, satisfaction measures, service levels, and more.
However, as we have seen, these levels are all connected. Even in cases where the customer asks only for service availability, capacity, and performance:
• the service provider should try to map service performance metrics to consumer process performance indicators, strategic objectives, and consumer purpose in order to understand the customer properly
• the customer should link service level with its strategic objectives and, at least qualitatively, analyse how well the service contributes to a service consumer purpose.
As part of the assessment, the captured experience, performance, and output data should be correlated with outcomes, risks, and costs and the overall service contribution to the customer objectives and purposes should be assessed. Table 9.5 outlines the two levels of assessing and reporting on value realization.
Once the data is consolidated, the results should be analysed and the following questions should be considered:
• Are the targets being met?
• What are the dynamics?
• Are there any clear trends?
• Are the trends positive or negative?
• Are there underlying structural problems?
• Are improvements required?
• Are there unforeseen patterns or unexpected and unplanned outcomes that should be fed back to design and improvement?
• Is there new information about the products, services, customer journey, or context (market)?
Table 9.5 Two levels of assessing and reporting on value realization
Assessing and reporting on experience, performance, and output data |
Assessing and reporting outcomes, risks, and costs | |
Procedure |
Relate the captured experience, performance and output data to agreement targets (if applicable) Combine data using proper techniques Build reports using agreed report templates or dashboards |
Correlate experience, performance, and output data with service outcomes, risks, and costs Link service experience, outcome, risks, and costs with service consumer objectives and purposes using mapping tools |
Data aggregation and correlation techniques |
IT component to scorecard hierarchy |
Organizational improvement cascade or similar |
Assessment and reporting methods |
SLA scorecard Service level reports and dashboards Service reviews |
Return on investment evaluation Cost–benefit analysis (including outcomes, costs, and risks) Post-implementation review, retrospectives, audits, and more Benchmarking |
Relevant ITIL practices |
Capacity and performance management Measurement and reporting Risk management (provides risk data) Service financial management (provides cost data) Service level management |
Portfolio management Relationship management Risk management (provides risk data) Service financial management (provides cost data) |
If applicable, assessment techniques, such as post-implementation reviews, audits, and cost–benefit analyses should be used.
Further reading
See the measurement and reporting practice guide for:
• how to refine data and process it into information using sorting, ordering (e.g. according to time series), normalization, mapping, labelling, grouping, correlation, etc.
• how to use aggregation techniques, cascades, and hierarchies for building balanced scorecards which can be effectively used for assessment.
The target audience should be considered. Many organizations take raw data and report it to everyone; they do not process or analyse it. This leads to a situation where managers at all levels receive too many emails. Practical experience has shown that dysfunctional organizations often report more than effective organizations do.

Tip
A report on its own can create awareness, but a report with an action plan can enable results.
The ITIL story: Step 7 – Realize
|
Mariana: Our original target for eCampus Car Share was to make a fleet of cars available for sharing, and for those cars to be utilized for 85% of a monthly measurement period. We based this on my original PhD research. By making 20 cars available in a fleet, I estimated that we could reduce the number of cars on the road by 100. I also wanted to free up space that was being used for parking on campus, and reduce the number of car parking spaces on campus by 10. After being in operation for 12 months, we are set to achieve our targets. |
|
Henri: We are not there yet, though! We have learned the importance of continually capturing and measuring. We started with a smaller fleet of only 10 cars, but the rapid uptake of our subscriptions meant that we have now rapidly grown to 22 cars. |
|
Mariana: In the beginning, the demand was quite high, but with the introduction of other options the demand has now plateaued. Because we limited our car share service to electric vehicles, it put a natural limit on the length of trips our customers could take. We realized that instead of our competition being traditional car hire, we were competing with city-based services such as scooter hire and bike hire. We needed to consider new and different service offerings to entice our customers. |
|
Katrina: My experience with eCampus Car Share has been great. The whole process, from initial booking to return of the car was smooth, swift, and hassle-free. When I returned the car, I completed a short survey about my experience and any issues I had had. I also posted on Instagram about my trip, and will definitely be using this service again soon. |
9.4 Evaluating value realization and improving customer journeys
Evaluating value realization and improving customer journeys refer to Steps 6 and 7 of the continual improvement model. If these steps are skipped, it is difficult to verify whether the desired or agreed outcomes are achieved and lessons from this iteration may be lost (ITIL Foundation, section 4.6.1.6). It is also important to ensure that the improvements and changed behaviours are not at risk of reversion: see ITIL Foundation, section 4.6.1.7, and the organizational change management practice guide.
Moreover, as long as service providers and service consumers are subject to a constant state of flux (rapidly changing economics), there is a continuous need for improvement in those areas, as they are most likely to return the greatest stakeholder benefits.
Evaluating value realization not only verifies that the individual services have created the desired value, but also that the desired customer experience has been achieved (single-loop learning). With double-loop learning, evaluation involves checking that the original value proposition is still valid, and that the SVS is fit for purpose, as shown in Table 9.6.
Did you know?
In the 1970s, Chris Argyris and Donald Schon introduced the concept of single- and double-loop learning as a part of their organizational learning theory (Argyris, 1991):
• Single-loop learning describes the type of learning that takes place when the objective is to fix problems within the present organizational structure so that the system will function better. It does not attempt to alter the structure of the system.
• Double-loop learning, also known as reframing, questions the purpose and function of work being done within an organization and does not take existing organizational structures for granted. Double-loop learning is concerned with understanding the basis for the tasks being completed, rather than a more efficient process for completing them.
Table 9.6 Evaluating and improving services and customer journeys
Single-loop learning |
Double-loop learning | |
Service perspective |
Do the services create the intended value? |
Is the original value proposition still valid? |
The customer journey |
Has the desired customer experience been achieved? |
Is the SVS fit for purpose? |
9.4.1 Evaluation and verification
In simple standardized environments, the evaluation of value realization may be partly pre-defined. If service level targets are well defined, automated service performance reports and SLA score boards may indicate whether the value realization meets the agreed targets. The customer only reacts in case of deviations.
In more complicated environments, the evaluation process cannot be completely formalized. It may be difficult for the service provider to entirely understand the outcomes that the consumer wants to achieve. Frequent service reviews in the form of face-to-face meetings may be a fruitful way to evaluate value realization in this case.
In some environments, value realization may require the continual evaluation and negotiation of changes to the targets as well as the realized value. The service provider and the customer may form shared teams to do this. Alternatively, the negotiation of targets and evaluation of value realization may be partly automated through cognitive technologies, such as dynamic negotiation networks, where controllers of different domains negotiate with each other for the service level parameters of a specific service request.
Evaluation is a chance to challenge initial assumptions. To solve a customer’s problem, the following questions should be considered in order to re-evaluate the assumptions:
• Is there still a real problem that needs to be solved?
• Is a service still the best way to solve the problem?
• Is the service still fit for purpose and fit for use?
As conditions always change, the customer should keep the service provider informed about changes that may affect service outcomes, experience, risks, and costs.
Evaluation of value realization provides vital input for the continual improvement of products, services, and all components of the SVS. Other sources for improvement are:
• service usage analytics
• incident, complaint, and problem analysis
• analysis of service request patterns
• analysis of self-service patterns and usage of knowledge articles
• change requests and improvement requests
• user feedback and feedback from user communities
• customer feedback and customer satisfaction surveys
• changes in service demand.
These sources provide information about ongoing service provision and consumption, enabling capacity and availability predictions, exploration of new opportunities, identification of new service value streams, etc.
Capturing feedback and processing information is enabled by the following ITIL practices:
• continual improvement
• incident management
• knowledge management
• monitoring and event management
• service catalogue management
• service desk
• service request management.
Integrating these practices within the relevant service value streams helps to capture triggers for improvement, analyse these inputs, and initiate improvements to products and services, as well as practices, service value streams, service agreements, and other components represented by the SVS.
Continual improvement is described in detail in the continual improvement practice guide and in ITIL ® 4: Direct, Plan and Improve.
The ITIL story: Evaluating value realization and improving customer journeys
|
Solmaz: We constantly monitor and evaluate how our customers perceive the actual value of the service we offer. In order to do this, we analyse feedback forms filled in by customers after their journeys. We investigate and learn lessons from complaints and incidents and we link these to data we collect about routes and use patterns. Based on this, we initiate improvements in service offerings, agreements, and technical solutions. |
|
Mariana: One discovery we made was that the electric cars were used for longer journeys than we anticipated, which meant that availability was more limited, and customers took to social media to complain. We responded by introducing special rates for shorter weekday hires. This helped to ensure that supply met demand, and customers were not left stranded. |
|
Radhika: We have evaluated and assessed what our customers have said about their memberships and booking. One pattern we noticed was that the card readers issued to our members to unlock cars were often misplaced or malfunctioned due to damage. The single-loop approach was to reset or post a new card to the members in the event of a card being lost or malfunctioning, but that took time for the card to be coded, issued, and received. |
|
Solmaz: It also created administrative overhead to cancel, track, and re-issue cards. |
|
Radhika: The double-loop approach was to automate unlocking of the car, which meant that we have been able to phase out card readers altogether. |
|
Mariana: Our initial trial was a great success, and demonstrated the benefit of evaluating value realization throughout the customer journey. It enabled us to realize that value was being compromised by delays to car access. |
9.5 Realizing value for the service provider
Although the service provider’s perspective may be different from the customer’s, the activities, methods, and techniques for tracking the realization of value for the customer introduced in the previous chapters remain applicable for the service provider.
9.5.1 Tracking, assessing, and evaluating outcomes
An internal service provider is usually subject to the shared strategic goals of the legal entity to which it belongs. First and foremost, the service provider exists to facilitate value for the customers and users, not to pursue its own business goals. Tracking, assessing, and evaluating the outcomes should therefore ideally be incorporated in the tracking, assessment, and reporting of customer outcomes, although the service provider may have its own branch in the ITIL organizational improvement cascade or balanced scorecard.
On the other hand, an external service provider pursues its own business goals, although it serves its customers and helps them achieve their goals as a means to achieve its own. These goals are not only financial but may also include brand recognition, market share, capability elevation, resource utilization, and more. Therefore, the service provider not only needs to track customer value realization but also its own value realization.
Key message
The methods and techniques introduced above for tracking, assessing, and evaluating value realization are as valid for the service provider as they are for the service consumer.
9.5.2 Tracking, assessing, and evaluating costs
Tracking, assessing, and evaluating service costs is a part of service financial management routines; the service financial management practice guide addresses this issue. The service provider should completely understand the service cost structure in order to optimize resource allocation and cover costs. The cost structure and allocation should be revisited regularly to ensure they fit the organizational goals and the portfolio of products and services.
In general, service costs usually include:
• Hardware costs including equipment spending in the form of depreciation. Tracking this type of cost requires asset management.
• Software and licence costs including software development costs and spending on licences. Tracking this type of cost requires software asset management and logging information about use of licences.
• Contract payment (to suppliers).
• Staff costs including paying staff on service delivery and operation. Tracking this type of cost requires task tracking, time sheeting, etc.
In order to calculate service costs, there is a need for a service-based cost model that provides information about the relationship between service components and configuration items, as well as information about the consumption of goods and services. Configuration models as a part of service configuration management are widely used as a basis for service cost models.
9.5.3 Tracking, assessing, and evaluating risks and compliance
Tracking, assessing, and evaluating service risks is as important as tracking costs; without understanding service risks, the service provider or the customer cannot identify the potential impacts of service failures.
From the value realization perspective, risks can be viewed as possible harms.
The primary sources of information for service risk identification and assessment are:
• service incidents and complaints
• security incidents and other non-compliances
• monitoring of service quality
• tracking of service value and experience
• changes to demand and capacity
• changes to resources, products, and service offerings
• changes to legal and regulatory requirements, contracts, and agreements.
Quite often, major service risks are identified for the customer in service reviews and risk mitigation is done as part of continual improvement. For detailed guidance on service risk identification, assessment, and mitigation see the risk management practice guide.
Part of the service provider’s value realization is profit, or at least cost recovery. The amount customers will be charged for a service depends on the charging policies. Several options exist for this:
• Cost recovery or break-even In this case, the service provider will only seek to recover its costs. It will not make a profit or loss.
• Recovery with an additional margin In this case, the service provider will seek to recover more than its actual costs. It is important to note that the margin is not a profit. The additional funding may be placed in a separate account, set aside for refreshing technology or covering the costs of unanticipated projects, or used to offset the costs of new investments.
• Cross-subsidization In this case, a subset of services is charged with an additional margin, which is then applied to offset the cost of another subset of services. This policy is often used to fund services to internal customers that have run out of budget, or whose business performance is lower than expected. The risk here is that temporary subsidies often become permanent.
• Profit In this case, the service provider aims at making a profit for its owners or for reinvestment in the business.
When the service provider and the customer belong to the same legal entity, the service price for the customer is usually based on the service costs. These service costs are often allocated to the internal customer through an enterprise cost allocation model to reduce the overheads of charging. However, estimated charging and other cost-based charging models, such as service-based and activity-based models, are also common to encourage cost awareness and behaviour.
The concept of a chargeable item is very helpful. Chargeable items are similar to cost units in that they are the lowest level at which a cost or charge is measured. The main difference is that cost units are measured from an IT point of view, and chargeable items are measured from a customer point of view. The reason for having two different categories (cost units and chargeable items) is that the cost of the item may be different from its price. When making decisions on chargeable items, the following principles should be considered:
• The drivers of service use need to be understood. For example, the chargeable items should be clearly connected to the way the service is delivered and consumed.
• The service provider and/or the customer should be able to measure chargeable items objectively based on data.
• Chargeable items have to be items which can be perceived and controlled by the customer. The service provider should be able to stimulate sustainable consumer behaviour that will ideally result in cost reduction to the minimum needed for supporting consumer operations at the required level. The customer can then manage its budget by controlling its demand for these items.
Often, business deliverables are not suitable as chargeable items because they require a detailed measurement of the resources consumed (sales analysis). In such cases, a structure may have to be established in which the service is charged for as a whole. Another issue is that business deliverables cannot be easily attributed to single processes or applications, which requires establishing sophisticated cost allocation models (see the service financial management practice guide). Generally, the more tailored services are and the more freedom the customer has to define its own service, the more detailed the charging structure is.
Some examples of how service usage can be measured are:
• processor utilization, memory utilization, file storage utilization (cloud/infrastructure services)
• number of business transactions (application as a service)
• number of application log-ons and concurrent users (application as a service)
• number of requests processed in case of differential charging (such as reports generated).
Although charging refers to the process of recovering money for services directly from the customer, billing is the process of producing and presenting an invoice for services and goods to a customer. The invoice is an important touchpoint on the customer journey; it may over-influence the customer experience because it is presented at the end of the journey, which can have a strong negative impact.
There are four main options for billing:
• No billing In this case, the service provider decides not to produce an invoice. This is normally the case if costs are covered through enterprise cost allocation.
• Informational billing or show-back In this case, the service provider produces an invoice but does not actually collect the money. Informational billing is used to create awareness of the true cost or to prepare the customer for the situation when real charging is implemented.
• Internal billing or chargeback In this case, an internal customer receives a bill (or ‘cross-charge’) for the costs that are directly associated with the customer’s service usage.
• Billing and collection This type of billing requires a dedicated financial information system that can handle invoicing, collection, debtors, and creditors.
Portfolio management plays an important role in tracking and realizing value for a service provider. It not only identifies the investments with the highest payoff, but also analyses and tracks investments based on the value of services to the service provider and its customers.
Portfolio management provides approaches and templates to oversee and control service value realization. Formal value realization assessment reports may be produced and provide a snapshot of the current state of investment for service stakeholders.
Portfolio management enables single-loop as well as double-loop learning. These areas may result in:
• exception reports that need to be escalated
• service resource allocation updates
• service portfolio updates.
For detailed guidance on portfolio management, see the portfolio management practice guide.
9.6 Summary
Stakeholder value is not realized on its own. Value must be driven, tracked, assessed, and evaluated based on the value co-creation planning, and improvements must be applied to continually maintain and increase the service value.