
CHAPTER 13. The Many Uses for Configuration Information
The most significant reason for instituting a configuration management service within your organization is to be able to use the data produced by the service. If you didn’t need to use the data in any way, you wouldn’t need to do configuration management at all. But as indicated in the opening words of this book, the key reason for configuration management is to enable better information technology (IT) decisions, and using the data gathered in the Configuration Management Database (CMDB) is how those decisions get better.
Of course, the primary way that data is used is by producing reports. This chapter explores the various kinds of reports that you might want to produce from your configuration management data. We’ll examine standard reports that get produced on a regular basis, and then we’ll explore four of the different ways that ad hoc reporting might be useful. Of course, we could have explored dozens of different uses for ad hoc data, but the ones chosen here are most representative of the ways most organizations use their newly created configuration data.
The intent of this chapter is not to be an exhaustive catalog of all the ways you can produce reports or use configuration management data. Instead, the chapter will spur your thinking as you consider the best possible approaches for your own implementation and use of configuration management.
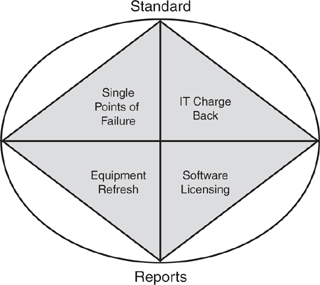
As usual, the first figure (Figure 13.1) provides the visual outline for the rest of this chapter.
Figure 13.1 There are many different uses for configuration management data.
Standard Reports
Reporting begins with creating a set of standard reports. By standard, I mean that these reports run on a periodic basis with minimal changes. The reports may be posted on a web page or distributed via a standard email distribution list.
There are two types of standard reports for configuration management, as shown in Figure 13.2. The first type deals with configuration items (CIs) and the relationships between them. These reports generally reflect the configuration of some piece of the environment at a point in time. The other type of report provides measurement data about the configuration management service and process. These are most likely reports about events and processes that change or use the configuration data in some way. Both types of reports are considered in this section.
Figure 13.2 Standard reports fall into two categories.

Reports about Configurations
The first reports most people think of producing are what I’ll call allocation reports. Any reports that break down CIs to parts of the business fall into this category. On the technical side, this probably includes a report of all CIs by responsible party, to indicate who supports each individual piece of your configuration. If you capture the appropriate data, you can also produce a report of CIs by user community, which can be extremely useful when determining the impact of a particular incident.
For the business side, the most common standard report is a listing of CIs by financial responsibility. We’ll talk more about this report later, but the general idea is that each department or business owner can get a listing of the items they are paying for within the IT world. Clearly this report can then be rolled up to higher levels to produce line-of-business or division-level reports. Given the right data, you might also want to produce business benefit reports to show which business units are served by each IT component regardless of who is paying for that component.
Even the most simple allocation report will lead you to understand the amount of data that your CMDB contains. Seeing the huge mountain of data should lead you to start thinking about the next category of reports, which I’ll call exception reports. These reports provide data about the completeness of your database.
The first exceptions to consider are the very technical ones. For example, if you are tracking servers and also tracking operating systems as two separate types of CI, you can produce an exception report showing all servers that do not have a relationship to at least one operating system. A server without an operating system clearly would be an error. Depending on how you provision servers, a server with multiple relationships to operating systems (indicating more than one operating system (OS) per server) might be an error as well.
With a bit of brainstorming, you should be able to produce a wide variety of exception reports specific to the scope, granularity, and span of your database. Some reports will be very technical, such as a router without attached LAN segments. Others will be oriented toward the business to find things like desktop PCs without a departmental owner. Each exception report will help you improve the accuracy of your CMDB and also give the organization confidence that configuration management is truly under control.
The third class of reports could be called environment reports. These are specific reports that describe a complete IT environment from top to bottom. Normally, they start with a business application, or perhaps even a business process which is related to multiple business applications. The report then proceeds to walk through the relationships for that application to specify the complete environment. Depending on what structure you’ve chosen for the CMDB, this might include components of an application, the servers that each component runs on, the databases used, the middleware components used, and down through the logical and physical network that supports the environment.
Seeing a complete environment report for the first time can be an eye-opening experience for business application owners. Perhaps they have a vague idea that the application is complex, but a report can highlight that complexity in a whole new way. In many cases, a single environment report can help to define which changes will and will not be approved for a given environment. It can also be a lifesaver when debugging a particularly thorny incident in a complex environment.
Some of the more advanced configuration management tools today are beginning to offer graphical views of an environment report. It shouldn’t be far in the future when you can point to a specific CI and get a single page drawing of the environment in which that CI operates. This is the ultimate goal of the environment report.
Reports about Configuration Management
We’ve seen that there are many examples of reports which contain either CIs or relationships—the core of the CMDB. But there is another entire class of reports that doesn’t contain data about configurations, but instead report on the health of the configuration management process.
By now you should understand that the configuration management process is best viewed in relation to other IT Infrastructure Library (ITIL) process areas. So, it should be no surprise that the best way to understand the health of configuration management is to understand its impact in other areas. This section provides examples of standard reports that can be created to assess the effectiveness of configuration management.
In your planning, you defined a relationship between configuration management and change management. For most organizations, the goal of that relationship is to reduce the number of changes that fail. Logic dictates that the more you know about an environment before starting the change, the less likely the change will fail due to unexpected discoveries. Given this goal, it is fairly simple to imagine a report showing the number of failed changes as a percentage of total changes attempted. You might even go so far as to create a new code in your change management tool to allow people to give a reason for failed changes, and then you could report on changes that failed due to poor configuration data. That would allow you another objective measure of the maturity of the configuration management service.
One way to assess the completeness of your CMDB would be to create a report of changes that don’t refer to at least one CI. In most circumstances, a change that doesn’t affect any CIs would be considered a mistake, so such a report would show one of two things. Either the correct CI wasn’t in the CMDB to be referenced, or the person recording the request for change didn’t know how to find the appropriate CI. Both say something about the effectiveness of your configuration management service.
Of course, change management isn’t the only process related to configuration management. You can also look at incident management to help assess the effectiveness of configuration management. Incidents without associated CIs can provide as good a measurement as changes without CIs do. If an incident occurs and nowhere can someone indicate which CI is broken, people clearly don’t understand the appropriate use of the CMDB as an incident resolution tool.
In incident management, the time taken to resolve the incident is the ultimate measurement, so it would make perfect sense to track whether the configuration management service is improving resolution times for your incidents. One way to get this kind of report would be to track incident resolution times before configuration management, and then after it is implemented. This measurement could either be done as a combined average or broken out into by teams to better understand which teams are benefiting the most.
You could also create reports in other ITIL process areas that might help you better understand configuration management. A useful report might show the CIs that are not part of a business continuity plan. Another report could be produced to show excess capacity by CI type, allowing capacity planners to know when they have underutilized resources. There are many examples of reports that can help highlight the effectiveness of configuration management by tracking the impact of configuration data on other ITIL processes.
But you don’t need to stop your reporting efforts at ITIL processes. Most organizations will need compliance reports from the CMDB. For example, you might have an IT standard that says you use only certain versions of an operating system. A standard report might be one that shows all installed operating systems that don’t meet that standard. Similarly, you can produce reports of hardware older than its specified refresh cycle, PCs that have a restricted encryption program, or even business applications that must meet Sarbannes-Oxley standards. Many internal standards, industry regulations, or legislative mandates can be considered using standard reports from the configuration management database.
Analyzing Single Points of Failure
Standard reports can be used for a wide variety of things, but they represent only half the power of configuration management data. Rather than waiting for monthly reports to be produced, many people are going to have more specific queries they will want to run on demand. The ad hoc queries can be used for a variety of purposes, and the rest of this chapter explores some of those purposes.
One very common use for ad hoc queries against the CMDB is to analyze environments for single points of failure. Essentially, this is an attempt to proactively identify the risk of failure in a given environment so those risks can be avoided.
A single point of failure analysis begins with an environment report, as described earlier. This report can be very broad, focusing on a very large part of the IT environment, or very narrow, focusing on just a few CIs. The scope of the analysis will dictate the breadth of the report needed.
After the needed configuration information is available, the analysis can begin. Basically, you look at every CI on the report and consider the possible failures that could affect that component. Start by simply brainstorming what could possibly go wrong. What happens if the power goes out? What would happen if a virus were introduced? How about a denial-of-service attack against the network? What if a wide area network circuit suddenly met a backhoe? The more IT experience your team has, the more failures you’re likely to have experienced, and thus the better your analysis can be.
For each failure that has a nontrivial chance of happening, prepare a risk statement. The risk statement should include your estimate of the likelihood of this particular failure, and some statement of what the impact of the failure would be. You may have a very detailed risk management process that calculates the likelihood and impact based on many factors. On the other hand, you may want to simply indicate high, medium, or low for each risk and leave the risk statement there. Your organization’s policy will dictate how you go about actually assessing the risk.
After all risk statements have been created and reviewed, you can formulate an action plan. The action items should address those risks that are most likely or will have the most impact. In some cases, a single action might address multiple risks, whereas other risks might each need their own action to be addressed. Each action should include an estimate of the cost of implementing that action in terms of both money and time. The analysis concludes by making recommendations to indicate which risks are worth avoiding, which should simply be known, and which can be ignored. Combine information on the current environment, the potential failures, the risk statements, potential action items, and recommended action items into a single package. That package becomes your single point of failure analysis.
In order to make this analysis more real, let’s take a real-life example from one of the customers I’ve worked with. Imagine an architectural and engineering firm whose primary output is drawings. Of course, they have a fairly sophisticated CAD environment, including a storage area network for holding the files, redundant application servers, a web server for quickly displaying the files for customers, various middleware products, engineering workstations, and the CAD program itself. The environment report as it might appear graphically can be found in Figure 13.3.
Figure 13.3 Even a simple CAD environment can have many points of failure.

Even in this simple environment, we can imagine a whole series of things that might go wrong. Any individual piece of hardware might break down, including the storage device, a workstation, a server, or even the network hub. In addition to a complete failure, any one of these devices might run short on capacity—perhaps with too many users trying to view the web server at the same time, or a single drawing being too big for the memory on one of the workstations. Any of the various pieces of software might contain a bug that will stop it from being used. Depending on the granularity of analysis desired, we might separately consider the failure of smaller components, such has hard disk drives, network interface cards, or system memory. The list of potential failures in this very small environment could easily grow to more than a hundred possibilities.
The next step is to prepare a risk statement for each identified failure. For example, we might assess the risk of the storage device losing a hard drive as high, but the impact of such a failure as low because it is running as a redundant array of inexpensive disks (RAID). We might assess the likelihood of a network hub failure as relatively low, but realize that such a failure would have the highest possible risk on our users’ ability to make and view drawings.
We can dig deeper into the configuration management data for some risk assessments. For example, the likelihood of an operating system having a bug will be higher if the OS is relatively new to the marketplace or if maintenance hasn’t been applied as regularly as it should. The risk of software problems with the CAD application might be assessed by looking at the vendor’s web site to find errors other installations have reported. Ultimately, we can develop a good set of risks around the total environment.
After the risks have been assessed, we can formulate actions that will correct each of them. One such action might be to build out a second RAID array to eliminate the possibility of a single storage failure making all drawings disappear. Another action might be to implement a second network hub along with a second network interface to all servers to protect against a simple network failure. Assessing each of these actions would show that the additional storage is a very expensive option which protects a risk that has a very low likelihood of occurring. Implementing the redundant network, however, is relatively inexpensive and protects against multiple failures that each have a moderate chance of happening.
Hopefully this simple example has given you a better appreciation for the power of having configuration information available. Although you could certainly have started your single point of failure analysis by doing a physical inventory of the environment, it is much simpler if you can simply query the CMDB when you need information about the configuration of devices and their relationship to one another. This makes it much more likely that you will actually do such analyses and significantly less expensive to do them.
Enabling IT Chargeback
Analyzing an environment for single points of failure is an inherently technical task, and you would probably imagine configuration management data would be well suited to technical tasks. In this section, we consider a more business-oriented task—charging within the organization for IT services.
Although financial functions generally are the responsibility of the asset management service, configuration management can play a significant role, as we’ll see. This section is written from the perspective of an organization that either doesn’t have asset management data or doesn’t trust it enough to base their chargeback system on it. We’ll see how configuration management data can be stretched to serve a financial purpose.
The first piece of enabling chargeback is to establish an IT service catalog. Creating and using a service catalog is a very broad topic which is described in Chapter 14, “Measuring and Improving CMDB Accuracy.” For this section, what I mean by a service catalog is simply a list of the things that you will charge for, and the rate charged for each of them.
For example, you might want to charge for access to network printers. In order to set up the service in the services catalog, you need to answer a number of fundamental questions. First, you must define exactly what is being charged for. Will you charge simply for access to a printer, or attempt to have a charge for actual printing? Will you charge per page, or per megabyte sent to the printer? If a user has access to both a color printer and a network printer, is that two different access charges? The answers to all these simple questions need to be provided in order to establish the printer service in the service catalog.
After you establish the unit for charging, you need to be sure that unit can be linked to configuration data or some event that can actually be measured. Let’s say you want to have a specific charge for each page printed regardless of how many network printers are available. To do so, you need to know how to track each printed page back to a user or a specific workstation. If you want to charge an access charge for each accessed printer, different data needs to be acquired. The charge itself dictates the data you need to acquire in order to allocate the charges.
Notice that much of the data you need can be tracked through a combination of configuration management and the other service support processes. Incident data, change data, problem data, capacity data, and release management data can all be great sources of information to help you measure the utilization of the services and thus allocate charges for them.
Going back to our printer example, if you’re already doing capacity management of the network printers, you probably already know how many pages are being printed. Now you just need to combine that information with the network name of the device sending the print to get the full picture. Fortunately, that network name is most likely already contained in your CMDB if you’re tracking workstations. Using the two together enables you to allocate specific numbers of pages to specific workstations, and thus to users.
When the end of the billing cycle comes around, all you need to do is use the organizational information associated with your CMDB to allocate charges back to the correct organizations. So now that you know which workstations sent how many pages to each printer, you can find the relationships of those workstations to departments to prepare the monthly billing report of printer usage by department. Look into the services catalog to get the cost for printing a page, and you have a complete charge ready to be sent out to the department or to your internal financial organization.
The best practice for IT chargeback is to start small. Rather than defining hundreds of individual services, start with a few simple ones such as an office telephone, a workstation, file storage on the local area network, and printing service. After those services are clearly understood and the basic mechanism for chargeback is in place, you can begin getting more elaborate and offering sets of differentiated services, such as international telephone service or color printing. It isn’t that you withhold services; it’s just that you don’t charge for every service at the beginning so you don’t end up with mountains of data and no comfort that the charges are equitable.
The general flow of IT chargeback and its relationship to the CMDB is depicted in Figure 13.4.
Figure 13.4 Charging for IT costs consists of the interplay between a service catalog and the CMDB.

Planning Equipment Refresh
Another use for configuration management data is planning for the refresh of your IT equipment. Everyone understands the pace of technology—there is always a better widget available for sale. The decision of when to move to that better widget can be made more intelligently if you have solid configuration management data. This section describes different approaches you can use to decide when to retire your old equipment and replace it with new technology.
Fixed Refresh Cycles
The simplest way to establish dates for refreshing equipment is to create a fixed cycle. This is by far the most common method, especially for people who don’t trust their configuration information. The fixed cycle simply says that you’ll replace equipment based on its age.
One approach to a fixed cycle is to simply choose a period for all equipment refreshes across your company. You could establish a policy, for example, that says all equipment is refreshed every three years. The CMDB can help you here because it can record the date any piece of equipment went into service, and it will be easy to produce a simple report of all equipment that went into service more than three years ago.
The downside of this simple approach is that it doesn’t recognize that different kinds of technology advance at different speeds. A three-year-old disk storage unit might barely be broken in, but a three-year-old cell phone is practically a relic.
Many organizations choose a different fixed cycle for each category of equipment. This is where the CMDB starts to be genuinely helpful because you’ve already categorized your equipment when you defined the scope of the CMDB. Leveraging those categories should allow you to create a standard report to show when equipment in each category is due for replacement.
Variable Refresh Cycles
But age is not the only criteria that can be used to determine when to refresh equipment. Some machines get used harder than other machines, and just like with any other purchase, it is always possible to get a “lemon” that never seems to be working correctly.
Basing the refresh decision on factors other than age is possible only when you begin to combine configuration management data with data from other operational processes. You can achieve a variable cycle, meaning that equipment is refreshed based on factors that will change from machine to machine. Here we’ll consider just two of the ways you can create a variable equipment refresh cycle.
One obvious approach is to look at the number of incidents that occur for any given piece of equipment and establish a threshold value to indicate refresh is necessary. For instance, you could create a policy which dictates that any server with more than 100 incidents should be replaced. The threshold can be different for different types of equipment; using the data from the incident management process, you could distinguish between the primary or only CI involved in an incident and secondary CIs.
You can extend this kind of refresh logic by including information from the change management process. Factoring in the number of times a piece of equipment has been changed will help eliminate incidents caused by human error and focus on just those that actually indicate hardware failures. You can also analyze the length of changes and the success rate of changes to get a good estimate of how expensive a piece of equipment is to maintain. Putting together incident data with change management data will give you a very clear picture of which pieces of hardware should be refreshed, and will even help you decide when your refresh program should include switching to a different manufacturer to get more reliable equipment. This is a very powerful use of configuration management data to make important IT decisions.
Although incident and change data help you assess the historic reliability of equipment, you can do even better by using configuration data to predict the future. Combining capacity monitoring data with configuration data enables you to understand how much each machine actually is used. Viewing this utilization information with statistics on the mean time to failure (MTTF) rating of the equipment will help you predict when your IT components are likely to fail.
For example, you might find from doing root cause analyses across a group of problems that disk drives from a particular manufacturer are failing at an unacceptable rate. Spotting a trend like this is part of the problem management discipline; but after the trend is spotted, your configuration management data will be invaluable in quickly determining which other equipment have these disks, and what the cost would be to proactively replace all of them.
Being able to predict failure will give you the option of replacing equipment before failures happen, making your refresh program a contributor to the quality of your IT environment instead of just an expense that must be incurred. This is one of the examples of how the configuration management data can be used to improve the business value of IT.
Leverage capacity monitoring data to determine how much equipment is used, and that can help assign a criticality. This technique can be used in combination with single point of failure analyses. A summary of different ways to approach equipment refresh is shown in Figure 13.5.
Figure 13.5 Equipment can be refreshed based on either fixed or variable cycles.

Understanding Software License Compliance
As we learned in Chapter 5, “Planning for Data Population,” software license management may or may not be done using configuration management data. As you’ll recall, to fully understand whether you are in compliance with software licenses requires three different pieces of data, which often come from three different sources. You need to know which licenses and which type of licenses were purchased, and this information is best gained from you asset management database. If at least some of your licenses are concurrent or usage based, as often happens with server-based software, you need to know what software is actually executing on which processors at any given point in time. This information is usually obtained from a dedicated software metering solution. Finally, for almost any other kind of license (the norm for desktop software) you need to know which computers have which software installed. That is the domain of configuration management, and specifically the relationships between software packages and processors. This section describes how configuration management can be used along with other types of data to determine whether you are in compliance with software licensing policies.
As stated above, the CMDB is useful only for managing those kinds of licenses that are based on installation of the software. If your license agreement is not concerned with where the software is installed, but only with how many times it executes, you will be better off using a software metering tool that includes an agent running on each system to tell you when each software product is actually executing on that machine. The rest of this section assumes that you want to manage installation-based licenses.
We’ll also assume that you chose a complex model for holding software data in the CMDB. Under this model, you will have a CI for each installed software package and a CI for each license you’ve purchased. A simple relationship will be used to indicate when a license is in use by an installation. A license CI without any relationships is available, whereas a license with multiple relationships might indicate a license violation.
Using this kind of scheme allows a very simple lifecycle to be tracked for each software license. When you make a purchase, new CIs are created to reflect the licenses you have acquired. These new CIs have a creation date, and can have other attributes to track the information you want to know about your software licenses. When licenses expire or are abandoned, you can mark the status of these CIs to indicate that the licenses are no longer active.
When software is installed on a PC, the installer can look in the CMDB for available licenses, and make the association between the newly installed package and the license it will consume. This kind of discipline among all of your software installers will ensure that you never use more licenses than you’ve purchased. You can also run reports to show numbers of unused licenses by product to know when it is time to purchase additional licenses.
When a machine is retired or a software package is no longer needed, the relationship with the license is removed, thus making that license available for another machine to use. This complete lifecycle is enabled by using the CMDB cleverly to track software packages and the licenses that enable you to install those packages.
As we’ve seen in this chapter, there are many different ways to leverage configuration management data to improve your overall IT services. As your CMDB gets more mature and your organization grows to rely on configuration information more, you will find entirely new ways to use the data. The value of the CMDB grows with age as long as the data stays current and accurate.