Chapter 12. A Worked Example
At this point, you’ve learned a lot about SLO-based approaches to reliability. Assuming you’ve read all of Part I, you now have an understanding of how the entire process works and the various components of the Reliability Stack. If you’ve explored other parts of Part II, you’ve also potentially learned about getting buy-in, how to actually measure things and use them for alerting and monitoring, some of the statistics and probabilities you can use to pick good SLI measurements and SLO targets, how to architect your services with SLOs in mind from the start, and why data reliability is a special case that requires different conversations.
While the other chapters in this part of the book have given you lots of detailed insight into specific aspects of an SLO-based approach to reliability, and Part I outlined and defined all of the concepts you need to get started, what we really haven’t talked about yet is how all this might actually work for a multicomponent service—or how it might apply to an entire company or organization. Consider this chapter as a way to put a lot of these concepts to work.
This chapter describes an example company and walks through defining SLIs and SLOs for various parts of its infrastructure. Looking at a concrete example can be useful when learning how to apply concepts that may have just been abstract in your reading so far. We’ll be covering everything from a customer-facing web page to services that interact with vendors, internal applications, and independent services with few dependencies or dependees. But before we begin that journey, let’s start with a story about a startup company, how it came to be, and how it grew into what it is today.
Dogs Deserve Clothes
A few years ago Jordan adopted a rescue Dachshund. Jordan immediately fell in love with their dog, and their dog fell in love with them as well. Dachshunds are also known as wiener dogs due to their shape—they look rather like sausages with legs, as you can see in Figure 12-1.

Figure 12-1. Wiener dog body shape (illustration by Denise Yu)
After a few months, as winter was approaching, Jordan started noticing their dog was starting to shiver a lot and was clearly cold on walks. So they did what any reasonable dog parent would do, and went online to try and find some clothing—a sweater, a jacket; anything that would help keep their dog warm on their long winter walks.
But no matter what Jordan ordered, none of it fit. If the coat was long enough, it was too large around; if it was the right fit around the body, it was too short. After trying several brands, Jordan gave up and decided to make their own jacket instead. After one long weekend, the prototype was ready, and Jordan’s dog was comfy and warm on its subsequent walks (Figure 12-2).
Because of this experience, Jordan realized that other people must be in the same predicament—and not just with wiener dogs! There are pit bull mixes with chests too big for the rest of their bodies and mastiffs that exceed the size of clothing anyone makes and bulldogs whose dimensions can sometimes defy the laws of physics. Jordan knew what was needed: a dog clothing company that paid attention to all body shapes and sizes. So, The Wiener Shirt-zel Clothing Company was created.
Figure 12-2. Wiener dog all comfy and warm (illustration by Denise Yu)
How a Service Grows
The Wiener Shirt-zel Clothing Company was born on a single programmer’s laptop. Jordan had an idea and just started working on it, and that laptop is where it lived for the first few iterations. It’s how things grew from there that can be seen as fairly remarkable.
The next step was to add some sort of data storage service behind the prototype web service. Then the service itself was moved off the laptop and into a container, and from there to a rented server in a data center. With the prototype complete, as the service started to take real traffic, it needed to be scaled up. Now it was a distributed service, which meant some kind of load-balancing solution was needed, which required even more hardware running in the data center. As the distributed service took on more traffic, it turned out that the database did as well, so it was scaled out to be distributed as well.
The Wiener Shirt-zel Clothing Company is a web-facing product, so the next thing that had to happen was the introduction of a content delivery network. A CDN is a service that helps you route traffic and can hold cached assets for you in order to serve them to your users in a more efficient manner and protect you from attacks.
The company continued to grow, and as more engineers were hired, some of them pointed out that keeping all the logic in a single service isn’t the best idea—so new features were added on as microservices instead of additions to the customer-facing application. And now that there were more services, those need their own databases. And now that the databases had more traffic, they needed a caching layer to help with performance. And then it was realized that handling transactions is a complicated business, so a new microservice was introduced that pulled this logic out of the customer-facing application. And then the business aspect of the company needed more data to make the marketing department more efficient, so a reporting pipeline was introduced. On and on it went. Services can become complex and deep very quickly. Let’s take a look at what The Wiener Shirt-zel Clothing Company looks like after a year of growth.
The Design of a Service
The Wiener Shirt-zel Clothing Company has done well. It sells doggie shirts, coats, and more to people all over the planet. It’s gone from a handful of customers to hundreds of thousands of visitors every day, resulting in thousands of sales. Figure 12-3 shows what the architecture now looks like.

Figure 12-3. An example of a retail website architecture
Here you can see a whole ton of components in a reasonably architected service. It may not be perfectly architected, but as you’ll remember, nothing ever is.
The primary flow of traffic starts with humans on the internet visiting the web app that powers the service. Most of this traffic goes through the CDN, but not everything does, since it’s pretty difficult to capture every edge case. From here the traffic flows into the web app, where most of the important logic is performed.
Below this you’ll see a DB that stores assets needed to serve the site. This includes things like the images and text descriptions of various items for sale on the site. Next to this you’ll also find a cache—content that’s served often and doesn’t often change shouldn’t require a full database lookup. This includes things like the currently featured clothing articles.
Next to the primary web app you’ll see three microservices. These are smaller components of the overall service that serve very specific needs. Microservice A manages financial transactions involving customer payments. Microservice B, in the middle, is the inventory system. These two both rely on a database that contains data on product availability, quantity, price, etc. Microservice C tracks users’ selections and where they spend the most time on the site. This data is sent to a database for further business trend analysis.
Data from this database is analyzed and converted into data that is more useful to humans in the marketing department via a data processing pipeline, which outputs the data into a new database. Finally, the processed data in this database is accessed via a business app that connects via Microservice D, which acts as a smarter API to the database. This data allows the marketing department at the company to make better decisions in terms of what kinds of new products should be developed.
Additionally, as The Wiener Shirt-zel Clothing Company grew, it needed places for employees to document things and keep track of priorities, so it now runs some open source issue tracking and wiki services to help with this. It has also implemented its own code repository and deployment pipeline.
Finally, at the bottom of the stack, you’ll see that it has both a compute and a hardware layer. While perhaps a bit unconventional for a startup today, due to various concerns the company has decided to not live in the cloud, so it runs its own container platform setup on its own hardware in a data center.
SLIs and SLOs as User Journeys
As Chapter 3 discussed, different functions in your company may already have much more alignment about what users need than you initially realize. Good SLIs for engineering teams are often very similar to the user journeys product teams want to define, which are often very similar to what your business teams are looking to as KPIs. In the rest of this chapter we’re going to explore various aspects of The Wiener Shirt-zel Clothing Company, primarily focused around three different groups of users: its external customers, services as users, and internal users (employees at the company).
We’ll start our discussion about how you might define SLIs and SLOs for the various aspects of The Wiener Shirt-zel Clothing Company by considering what the customers actually need, and see how you can set SLOs keeping that in mind. Then we’ll move on to what internal users, both humans and other services, might need and develop some example SLOs to cover that.
Customers: Finding and Browsing Products
The Wiener Shirt-zel Clothing Company is one that looks to make money, so it needs customers. And the needs of these customers (and their dogs) are its utmost priority.
Let’s discuss an example of a user journey that customers of The Wiener Shirt-zel Clothing Company need to be reliable. We won’t be covering every possible SLI or SLO that could be developed for the company’s architecture, as that would get repetitive and take up too much space; rather, we’ll look at a few representative examples of SLIs and SLOs for user interactions.
The primary focus of The Wiener Shirt-zel Clothing Company is to sell dog clothing to customers. In order for that to happen, customers will have to be able to browse and search through the products offered. The parts of the architecture involved here are emphasized in Figure 12-4.

Figure 12-4. The components involved with finding and browsing products
The first thing you might notice is that a fair number of components are involved. This is a great example of the mantra from Chapter 3: you can measure many things by measuring only a few. By knowing whether a user can successfully search for a product, the company knows that the product catalog database and/or cache are operating well enough and that the inventory microservice is behaving. Additionally, it knows that its primary web app, the web asset database, and the network components at play are all performing reliably.
At The Wiener Shirt-zel Clothing Company, each component is owned by a different team, and they have defined SLOs for every one of those components. However, they also want to be sure that they’re capturing the higher-level human interactions. This is because they need data not only to have discussions about how individual teams may prioritize their work, but also to have discussions about how the entire organization might prioritize its work. So, while each component has an SLO set, such as the web server being able to serve the front page in under 2 seconds, they also have SLOs set for multicomponent journeys like the user being able to successfully search for a product.
Note
We could imagine different teams being responsible for each of these services. In that case you’d certainly need SLOs defined at every step along the way, so you can set error budgets that can help each of these teams prioritize their own future work. The counterexample would be that one team is responsible for every component involved, in which case perhaps SLOs may only need to be set at the highest of levels. The point, as always, is that you’re gathering data you can use to have discussions about what parts of your infrastructure require attention to keep your users happy.
Let’s talk about the actual customers and what they as users of this service need. I’ve already mentioned that they need to be able to browse and search for products on the site, but that could actually mean many things. Let’s drill down and talk about two very specific aspects of this user journey.
SLO: Front page loads and latency
The users of The Wiener Shirt-zel Clothing Company website are human customers. This means that they’re actually fairly patient in a world of computer services where we often measure things on the order of milliseconds. As discussed in Chapter 3, humans are totally fine with a web page taking a few seconds to completely render in their browser.
A bit more important to people are error rates. If a website loads in 2 seconds 99% of the time, they’re probably fine if it takes 5 seconds just 1% of the time. This is probably not a rate at which they’ll abandon you for a competitor. But if a page fails to load a full 1% of the time, you’re probably going to lose a certain number of customers. Despite this divergence, this doesn’t mean you need to have two entirely separate SLOs. You can use the data you have about both of these aspects of reliability to power a single SLI and SLO.
In this case, a reasonable SLO might read like the following:
99.9% of responses to our website will return a 2xx, 3xx, or 4xx HTTP code within 2,000 ms.
Note
You could absolutely get more detailed than this. For one example, we aren’t accounting for a potential long tail with percentiles. For another example, you often want to count 4xx response codes as “good” responses, because you don’t want to burn all of your error budget if someone with a large social media presence tweets out a link to a page that doesn’t exist. However, an elevated rate of them could also mean that your own website has links that don’t work. The difficulty comes from not knowing whether a request itself is “good” or not. Another example is that you’ll generally consider 5xx response codes as “bad,” but a 505 (while exceedingly rare in the real world) could be caused by a client when there is nothing wrong on your end. There are a lot of nuanced options at your disposal. Be as detailed (or simple!) as you need for your service and your realities—but no matter what your service looks like, it’s best to start simple and get more complicated later.
Having 99.9% of responses completing within our parameters seems reasonable. Just convert this into a number of page views and ask yourself how you’d feel if faced with this as a reality. From an events-based perspective, if you were browsing a website for dog clothing and only 1 in 1,000 clicks resulted in a slow load or an error, you’d almost certainly be able to shrug this off. The Wiener Shirt-zel Clothing Company has been able to track that the average user clicks on approximately 25 links per browsing session. This means that only 1 in 40 customers is expected to experience even a single bad response during their time on the site. Trying to fix the database problems that lead to these errors would be a major project that could take several quarters, and it’s been determined that users that experience an error rarely abandon their browsing, so the engineering, product, and business teams agree on 99.9%.
As you may recall from Chapter 4, that translates to about 43 minutes of downtime per month. From a time-based perspective, the company certainly might lose some sales if the site were down for a full 43 minutes in a row, but this target does account for it being able to endure blips in reliability. Everything has trade-offs, and the company feels good about this target for now.
SLO: Search results
Now that we have general page loads covered, we can talk about a special class of page load: search results. Here again you can make things easier on yourself when you put yourself in your users’ shoes and think about what they expect.
Humans have come to expect computers to have to “think.” In fact, it is not unheard of for UI designers to purposely introduce delay into a task because if things happen too quickly, the human user at the other end of things will assume nothing happened or that there was some kind of problem. Those spinny circles or bars that fill up are sometimes just there for effect. For this reason, you can relax your SLO for search result page loads versus just visiting the front page. The Wiener Shirt-zel Clothing Company did some research and determined it could make the following changes to its search results SLO when compared with the front page load SLO:
Search results likely will take longer than a standard front page load, since the backend service is being asked to perform actual work instead of serving static assets that might already be cached.
Humans are more accepting of failure, both in terms of error rate and latency, when a service is being asked to perform actual work.
4xx response codes can no longer be considered as “good” since this problem would be due to the company’s own service and not to a user entering an incorrect URL. Even if there are no results to return, the service should be returning a 200 instead of a 4xx.
Acknowledging the findings of the research, the following SLO was defined:
99.8% of responses to product searches will return a 2xx or 3xx within 4,000 ms.
I could go on and on in this manner and define any number of SLOs for the website itself and how users interact with it, but that would get dry and boring. (For example, a lot of the lessons from Chapter 11 could be applied here—search results don’t just need to return good HTTP response codes, they need to contain the correct data.) These two examples should put you well on your way in terms of thinking about what your own customer-facing website might need to do in order to be seen as reliable.
Other Services as Users: Buying Products
Now that we’ve discussed some aspects of what the external customers need from the company, let’s talk a bit more about what services as users need in order to see The Wiener Shirt-zel Clothing Company architecture as reliable.
Response latencies for services that are relied upon by others have to be more strict. The humans loading your website are okay with a few seconds of response time—however, all of the services that are talking to each other in order to make that happen will have to respond to each other much faster. Since the company has SLOs that target end user experience in terms of latency, the latency of the services that back the web app need to be quicker and therefore have more stringent SLOs. A service cannot be faster than those it depends on for data.
For example, if you have a request and response service with an SLI target that requires responses within 2,000 ms, and that’s talking to two other services that are vital to it being able to respond correctly, those both can’t have a target of 1,000 ms at any percentage. Even if those services often respond much more quickly than 1,000 ms, the math just doesn’t work out.
Going back to our architecture diagram, let’s focus on microservice A, which acts as a payment gateway by communicating with a payment vendor. This will be a little more interesting than any of the other request and response services in the architecture since it relies on something that is itself an external paid service, instead of just another part of the internal architecture. Figure 12-5 shows the components involved.
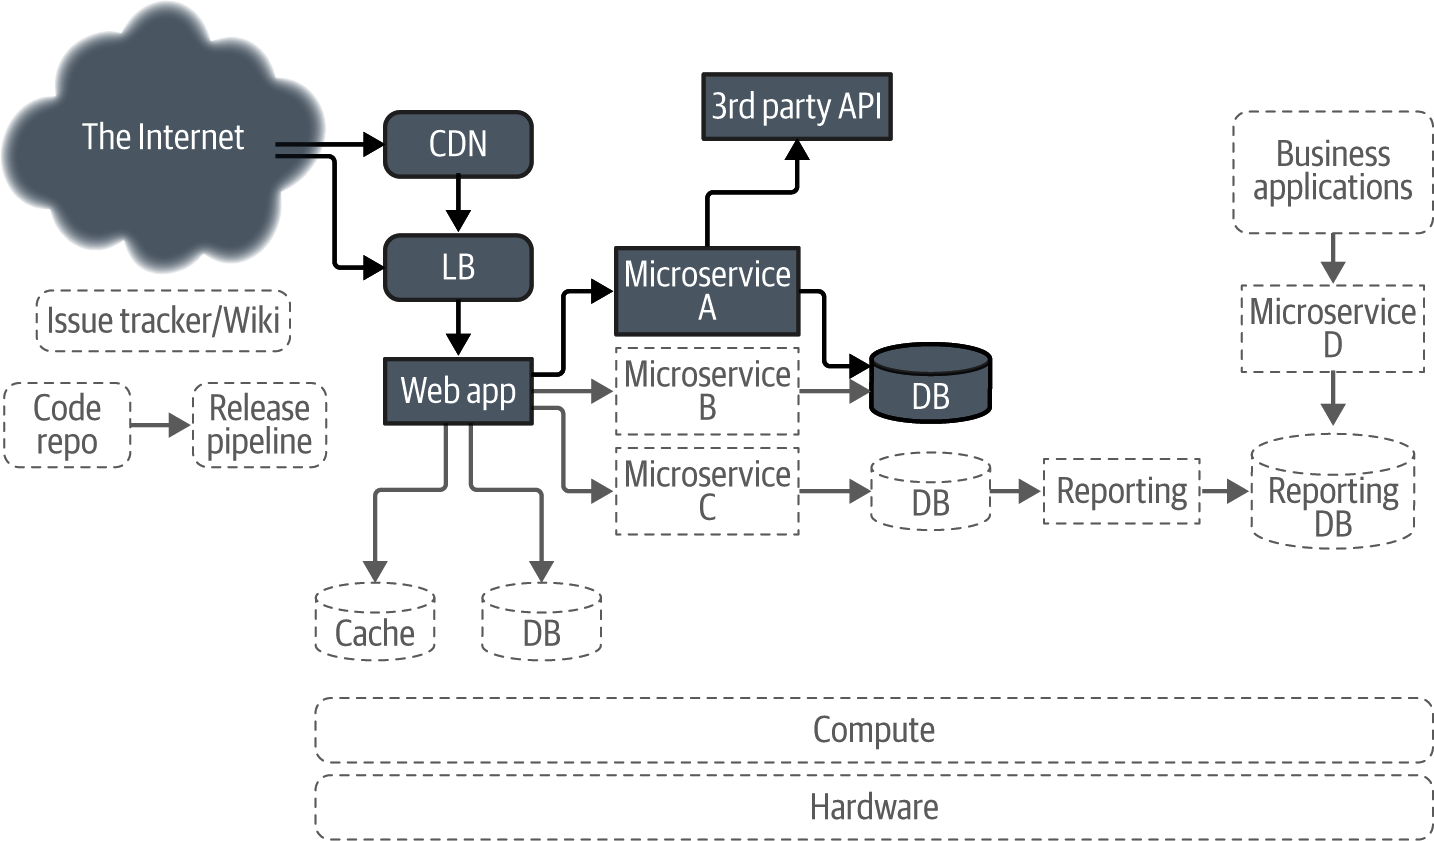
Figure 12-5. The components involved with buying products
The primary reason this service exists is to allow customers to actually check out and pay when they’re done shopping. This is almost certainly the most important part of a retail business.
SLO: Checkout success
Checkout success rates for The Wiener Shirt-zel Clothing Company are directly tied to another company. Payment vendors have to be pretty good at successfully responding to their users, for a few reasons. Even if we account for retry logic that could cover some transient failures contained within the “humans are okay with a little extra latency when computers do work” bubble mentioned earlier, customers would quickly move on to another solution if they couldn’t make money selling things to their own customers.
SLAs are business decisions, and I’ve mentioned why we don’t talk about them much in this book. They require contract language and legal consultation and remuneration techniques and all sorts of other things that are simply out of scope for what this book is about. What is also generally true about them is that they’re almost always much simpler than SLOs. Rarely do SLAs involve using percentiles or classifying various response types. They don’t even always include any sort of threshold. In contrast to the SLO for the request and response service responsible for serving The Wiener Shirt-zel Clothing Company website’s front page, the SLA provided by the vendor in a contract could be as simple as:
99.99% of transaction requests will succeed over any calendar month.
Note
A lot of vendor services actually define their SLAs depending on your volume of usage and/or how much you’re paying. There is a reason many vendors don’t have all (or any!) of their SLAs published: because they’re often tied to each contract that is signed, with different thresholds and remunerations depending on the specific contract. This is another reason SLAs aren’t discussed much in this book, despite being very closely related to SLOs.
This seems reasonably sufficient to account for with retry logic. Unless the vendor is down hard, having to retry 1 in every 10,000 requests should be workable without also severely impacting whatever SLO the clothing company has for checkout attempts. Even so, don’t forget about how things can add up quickly. 99.99% is a difficult target to reach.
As always, this is a little easier to think about when using time-based language: 99.99% implies 4 minutes and 22 seconds of hard downtime per 30 days. Let’s explore what that means in terms of the SLO that the payment processing microservice itself could have at 99.99%, 99.9%, and 99% percent (see Table 12-1).
| Vendor | Internal service | Result | Events failed | Time failed |
|---|---|---|---|---|
| 99.99% | 99.99% | 99.98% | 2/10,000 | 8m 45s |
| 99.99% | 99.9% | 99.89% | 21/10,000 | 48m 12s |
| 99.99% | 99% | 98.99% | 201/1,000 | 7h 22m 40s |
And this goes in both directions, of course. Perhaps the vendor has a target that’s lower than four nines. If the payment service can only promise a 99.9% reliability rate and the vendor does the same, you’re now dealing with a guarantee of 99.80% reliability, which translates to 20/10,000 events potentially failing or 1h 27m 39s of downtime being considered acceptable every 30 days. From an events perspective, this might still be manageable when using retries—but when thinking about time, approximately an hour and a half when the site is unavailable and customers cannot purchase from the company is probably starting to be a bit much.
And it continues to escalate so quickly! Let’s say the vendor can only promise 99% and the microservice can only aim for the same. Now we’re at 98.01%, which equates to 299/10,000 requests and 14h 32m 11s of downtime per month. That’s likely going to really start being a pain for customers, even with good retry logic.
And this doesn’t even account for any other SLO targets, such as that of the database this microservice depends upon, or the front page SLO we defined earlier, or your networking setup, and so forth.
Clearly this is a service that not only needs to be very reliable, but has to set its own targets based on the contract the company signed with the vendor. You can use this kind of math to ensure that everyone knows up front what kind of service they’re going to be maintaining and what kind of commitment they’re going to have to make in terms of keeping it reliable into the future.
Let’s return to our example where the vendor has promised you an SLA of 99.99%. If the company aims toward a goal of 99.99% reliability, and the database that is depended upon has an objective of 99.95%, you’re left with an overall user journey percentage of 99.93%. This translates to 7/10,000 events failing, or just about 1 minute of unavailability per day per month. This seems like a number that can easily be accounted for via retries or other logic in other parts of the architecture. So, the SLO for the payment microservice itself reads:
99.99% of checkout requests will succeed on their first attempt.
And a further SLO is set for the entire payment workflow that reads:
99.93% of checkouts following the entire workflow will succeed on their first attempt.
That number can then be used to build the correct retry logic into the web app to ensure that actual customers of The Wiener Shirt-zel Clothing Company are happy with their day-to-day experience. It could also be used to draw attention to when the different teams responsible for this workflow need to work together to focus on the entire SLI-as-user-journey. Therefore, the following SLO is defined as well:
99.99% of checkouts following the entire workflow will succeed within 5 attempts.
You can apply this same sort of thinking in terms of setting SLOs for all your services that depend on other services, whether they be internal or external. Remember to do the math to determine how multiple target percentages impact each other, but also remember that you can use better math (see Chapter 9 to account for this) or retries and other methods to account for how multiple percentages impact each other.
Internal Users
Your internal users—be they other engineers, people on the business side, customer operations, or even your facilities staff—need things from you much in the way that your external, paying customers do. Here we’re no longer thinking about other internal services that depend on each other, but the other humans that work at your company: your coworkers!
While it is often true that your coworkers can be more understanding about reliability problems than paying customers might be, this isn’t always the case. Unreliable services aimed at internal users can be just as frustrating to people as those your customers rely upon, and it’s not unheard of for people to leave their jobs entirely due to frustration with internal tooling not working well.
Let’s examine two such services now: one that operates as a desktop application and one that is more of a standalone service. Figure 12-6 shows the components we’re focusing on now.

Figure 12-6. The components involved for some internal services
SLO: Business data analysis
One of the neat things The Wiener Shirt-zel Clothing Company does is provide its business and marketing departments with excellent data. Every single user interaction on the site is cataloged in some manner, from what is clicked, to how long is spent on a page, to what clothing options such as size or color are browsed most frequently. Of course, actual purchases are also cataloged, as well the number of “shares” to social media these items receive. This data is all sent from the web app to a database, where occasional batch jobs run to pass the data through a processing pipeline, with the resulting output data stored in a second database. A custom desktop application has been written allowing for various internal departments to interact with the analysis via a microservice that acts as an API in front of the results database.
Note
This chapter won’t be covering what an SLO for the processing pipeline itself might look like, since that’s covered very well in Chapter 11. Instead, it would be more useful to talk about what SLOs for the application that lets humans interact with the resulting data might look like, since that’s a rarely covered topic.
Almost without fail so far in this book (and elsewhere!), example services for SLO-based approaches revolve around response and request APIs. After that, you might see people discuss SLOs for things like databases and platforms, and even more rarely for data itself. What you essentially never see anyone discuss are SLOs for things that aren’t network services, but instead act as something like a desktop application or a mobile app. Here, we’re not concerned with the SLOs for the APIs these applications need to talk to in order to get their data (if they do that at all), but the applications themselves.
As always, you just need to put yourself into your users’ shoes and ask them what they need. A good exercise in order to do this is to imagine yourself actually using the application. In this case the users are coworkers, so engineers at the company can just go talk to them directly! Here is a quick list of user journeys engineers at The Wiener Shirt-zel Clothing Company discovered via interviews that they can use to inform some SLIs:
Application needs to start
Application needs to not crash and remain running
Application needs to be able to deliver queries for customer interaction data
Application needs to be able to present the results of the queries in a manner human operators can understand
Application needs to be able to export this data for sharing or inclusion in documents and presentations
We could go much deeper, but that’s a great start in terms of describing some things that the users of this internal application need it to do. Let’s now dive a little more deeply into what #5 might look like to a user.
An internal user in the marketing department at The Wiener Shirt-zel Clothing Company is curious about what particular shirt patterns have recently been viewed often or for lengthy periods of time, but haven’t actually been purchased very often. Familiar with the use of their internal application, they key in the appropriate query and wait for a result. Processing sometimes takes upwards of 20 seconds, but that’s fine. That’s how this system has always worked, and it’s not really a detriment to the business. Not everything has to be lightning fast, and that should be remembered when you’re thinking about SLOs.
But what does matter is whether the application is able to export the data once the user has it. Measuring this might seem a little tricky, but it’s not all that different from how you’d measure any other sort of event-driven process. Let’s say that the user should be able to click a button to save the results of their analysis to a file on local storage. Any reasonable piece of software that performs this sort of task likely has the capability to log about each step of the way. First the click is registered, then a routine is called to perform the export, and so on. You can collect metrics on each of these steps and use these metrics to inform an SLO.
If this feels pretty different from everything else we’ve talked about in this book, that’s because it is. Log lines are not a great source for SLOs that help you understand high-performance web services. They are easily delayed, they are computationally expensive to parse, they require a lot of storage if you need to analyze them over lengthy periods of time, etc. However, that doesn’t mean you can’t use them in the right scenario. And using them to analyze the performance of a feature of an application that might only be used a few times per day (and not at all on some days!) seems like a totally reasonable choice.
Note
Remember, SLOs are about thinking about your users—and those users are not always millions of people on the internet. Sometimes they’re three people in a marketing department. Maybe you can’t gather enough data in this sort of scenario to ever properly develop alerting or even power an actual error budget, but you can use the concepts behind SLO-based approaches to reliability to tell you where and when you need to focus your work on improvements.
You might only have a few data points per day in this sort of situation, but you can still use that to drive discussions and decision making. You probably don’t want to be alerting off of this data, and even a dashboard is likely overkill, but if you can identify an SLI that tells you whether things are working for customers or not, you can use it to pick an SLO target that tells you when you need to look at something. It’s certainly an improvement over doing nothing, which could result in the marketing department having to constantly interrupt the engineering team to ask them why things aren’t working.
For example, at The Wiener Shirt-zel Clothing Company, 95% of exports were working on the first attempt last month, but this month that dropped to 80%. Perhaps a bug introduced a regression into the code, or the users have changed their habits in a way that needs to be addressed; any number of things could be responsible. Even with just a few data points per day, the team responsible for this service is able to define the following SLO:
90% of data export attempts log a success over the course of a month.
This is simple, it’s unambiguous, and it doesn’t require anything more than a report produced once per month—but it forces the team to measure things and lets them think about their users and have better data about how to plan future work. Is the export feature still working, even if it’s only used by one small marketing team? Suppose after a month the measurement says that 91% of exports completed correctly, but the marketing team is still upset. The target could be moved to 92% as a next step, since all SLOs need to be open to evolving—and it will continue to evolve with feedback from the users.
SLO-based approaches give you a way to find out whether users are happy or not, even if this example doesn’t fit all of the traditional trappings of the general discussions about SLOs. Always remember that it’s the philosophies behind these approaches that are the most important, not having the slickest technology to use to perform complicated math against statistically derived SLIs.
SLO: Internal wiki
Another great example of the kind of service that is often overlooked when discussing SLO-based approaches to reliability is pieces of third-party or open source software—especially those that stand alone and might be managed by IT teams that are unfortunately often left out of the discussions that surround software or systems engineering. They’re services all the same, they have users, and those users need them to perform at certain levels!
It’s always a great idea to try to ensure that your SLIs are as close to what your users need from you as possible—this is an idea that has been repeated over and over again. But we’ve also tried to be reasonable in terms of what data you have to work with. A service for which you don’t control the codebase is a great example of where you might want to fall back on something simpler while still getting the job done well enough.
Note
Well-known pieces of open source software are often fairly well written and tested. When problems arise, they sometimes have hundreds of developers involved and ready to respond to a bug or push out a fix. This sort of community is at the heart of what makes open source software beautiful. Some open source software is infinitely tunable and configurable. A lot of the more popular database options, for example, have so many layers of additional caching and tooling and replication orchestrators that surround them that you can have an entirely separate part of your architecture that’s as complicated as the sum of the rest of your setup. This means you have many things to think about and measure, and therefore likely have many potential SLI candidates.
For the internal wiki documentation setup, the measurement options available to the team running it are a bit limited. And here is a great example of a place where something like “Is it up?” is probably sufficient for everyone! Not everything has to be complicated. An example SLO for the team responsible for the internal wiki in this case reads:
The internal documentation wiki will be available to users 99.9% of the time during working hours.
Working hours at The Wiener Shirt-zel Clothing Company are defined as 08:00–18:00 ET. An SLO like this allows for the team responsible for it to experiment or perform upgrades or other work whenever they’d like outside of normal working hours.
Platforms as Services
The final part of The Wiener Shirt-zel Clothing Company architecture (shown in Figure 12-7) that we’ll examine is one of the platforms everything else at the company relies upon. Because they’re at the bottom of the dependency chain, these services need to be the absolute most reliable of all.

Figure 12-7. The components acting as platforms
Container platforms are a common way to make it easy1 to manage, deploy, and scale services. Because The Wiener Shirt-zel Clothing Company is not entirely homogeneous, like most companies, some components (like the wiki and the release pipeline) run on VMs, but all of the microservices and the web app run on this platform. Because of this, the reliability of the container platform is incredibly important!
The way most container platforms are intended to work makes them a particularly interesting candidate for measuring via an SLO-based approach. I’ll very briefly outline at a very high level how everything works in order to explain why this is.
The primary working unit is known as a pod, which is a grouping of containers (or sometimes just one) that is managed as a single object and guaranteed to run on the same host. The reason this is important to call out is because if you have a replicated service, you’ll have more than one pod—in some cases, hundreds. These individual pods, while all being part of the same service, can run on many different hosts. This helps with the reliability of a service, because if there is a problem on a single host and the pod (or pods) running there subsequently experience problems, your service as a whole shouldn’t go down, and will hopefully only be degraded at worst.
But the real twist is that pods are intended to be ephemeral; that is to say, they’re not all guaranteed to exist at any point in time. When building services on top of container platforms, you should be building them in a manner that can afford for pods to be restarted and moved from host to host as needed so the entire platform cluster itself can ensure load is distributed, so that it can also remain reliable. Here you might start to pick up why it can be an interesting challenge to develop user journey–based SLIs for the users of such a platform.
SLO: Container platform
For example, since pods are intended to sometimes not be available, measuring total pod uptime doesn’t give the company a great data point, even if at first glance that would seem like a thing users would care about. When something is a platform, you can’t just measure the health of the platform itself; you need to keep users in mind.
A better SLI might be something that talks about having a certain percentage of an individual service’s pods running at the same time, but that can run into additional problems. If you say that 90% of pods for a certain service should be available, how do you handle the fact that you can’t have partial pods? You can’t round up, since, for example, 90% of 7 is 6.3, which rounded up would just be 7 again. So instead you round down. This works, but it’s just an example of some of the extra calculation you have to do in this situation.
However, this also now means that you are aiming for all services with fewer than 20 pods to never have more than a single pod unavailable at a time. This probably makes sense for services that have, say, 10 or fewer pods, but it may be stricter than necessary for services with closer to 20 pods. For example, The Wiener Shirt-zel Clothing Company has 200 pods running the primary web app, but only 19 handling communication to the payments vendors. Perhaps those smaller services should never have more than one missing pod at a time. But it could also seem reasonable that a service with 19 pods should be able to handle only 17 being available at a time. This is a great example where the company decided it needed multiple SLOs powered by a single SLI measurement, as follows:
For services with 20 or more pods, at least 90% of their pods will be available 99.9% of the time.
For services with 10–19 pods, no fewer than 2 of their configured number will be unavailable 99.9% of the time.
For services with fewer than 10 pods, no fewer than 1 of their configured number will be unavailable 99.9% of the time.
As you can see, this allows you to set a reasonable SLO target percentage like 99.9% while allowing the services that are dependent on yours to set even higher targets. Introducing multiple constraints to your target can make your SLOs much more meaningful without you having to resort to a ridiculous number of nines in a row.
Other great ideas for something that acts as a platform include thinking about things like pod startup time or eviction rate.
Summary
A lot of this book has been abstract, since SLO-based approaches are mostly philosophical. You might use a lot of math and numbers to help you gather data, but it’s ultimately about using this data to engage humans to make decisions. Have we been reliable enough? Are our users happy? Are our engineers happy? Are our measurements correct?
A lot of this book has also been very technical, since you need the most correct numbers you can get in order to provide you with the best data. How can we measure this better? What does probability tell us about whether this makes sense or not? What math can we use to ensure we’re only alerting on a problem when we really need to?
In this chapter, I’ve tried to be as practical as possible. By examining an example company with an example architecture, I’ve hoped to bring some of these concepts into a new light. I didn’t cover every facet possible, but doing so would be infeasible. Complex systems are unique, and if I’d tried to address every single component that our example company should be measuring and setting targets for, you’d have just ended up with an endless and dry chapter.
But hopefully between the examples in chapters elsewhere in this book and this one, you’ve been able to spot one that at least kind of looks like your service. Hopefully there is a bit of a template there. And if not, remember that it’s really the philosophies that matter most, and not the exact implementation. I’m sure you’ll do great at finding your own approaches to figuring out how to turn your user journeys into SLIs and SLOs.
1 Well, as easy as anything with computers ever turns out to be.